


Services on Demand
Journal

Article
 English (pdf)
 Article in xml format
 Article references
 Send this article by e-mail
Indicators
Related links
-
 Cited by Google
 -
 Similars in Google
Share

 Permalink
R&D Journal
On-line version ISSN 2309-8988Print version ISSN 0257-9669
R&D j. (Matieland, Online) vol.21 Stellenbosch, Cape Town 2005
Temperature Prediction on a Turbine Blade Using a Combination of Turbulent and Laminar Flow Models for the Calculation of Thermal Stresses
K. Kulik; S. Govender
Department of Mechanical Engineering, University of KwaZulu-Natal, South Africa Email: Krzysztof.Kulik@pbmr.co.za
ABSTRACT
In the quest for the calculation of thermal stresses inside a transonic turbine blade, correct modelling of the flow field and the thermal boundary layer are vitally important and pose one of the most difficult tasks in aeronautical science. A 2-D plain strain CFD/FEM model to simulate thermal stresses in an internally cooled turbine blade has been set up using the commercially available software FLUENT and NASTRAN. The CFD model was validated against experimental pressure and temperature data. It was shown that no available Navier-Stokes turbulence model could accurately predict the heat load to a turbine blade in the laminar region of the blade. It was discovered that by employing a simple Laminar model and combining it with a turbulence model, produced excellent agreement with experimental data, which in turn resulted in realistic thermal stresses.
Keywords: CFD, FEM, FLUENT, NASTRAN, NGV, transonic, turbine, flow field, thermal stress
Introduction
Assessing the life and improving the thermal design of a turbine blade play major roles in all fields where gas turbine engines are utilised. Analysing the thermal design of a blade begins with understanding the complex velocity and thermal boundary layers around the blade. Predicting highly accurately the blade surface heat load created by the hot gas stream moving over the blade is essential to predicting the corresponding thermal stresses inside the blade. The problems associated with predicting heat transfer to the blades are coupled with: turbine blade aerodynamics; free stream turbulence; boundary layer transition onset and -length; separation and reattachment; shock waves and main flow acceleration and deceleration. These are just a few of the phenomena associated with the three-dimensional unsteady flow.
Numerical codes predicting the flow around and heat transfer to a turbine blade have been developed over the past 30 years, mainly due to the experimental community. It has advanced to the point where time resolved 3-D heat transfer data for vanes and blades are obtained routinely by those operating full rotating rigs. The quality of experimental data produced has been used to validate and create the numerical codes.
Dunn1 reviews the progress of turbine blade aerodynamics and heat transfer research run by many research organisations over the last 30 years, from the early plane turbine cascade measurements performed by Langston et. al.2 which gave insight into flow visualisation to the development of full 3-D Boundary-Layer and Navier-Stokes codes. One of the earliest Boundary-Layer codes STAN 5 developed by Crawford and Kays3 was extensively used by researchers in the 1980s. The measured values were lower than the predicted values. Daniels and Brown4 used 5 different computer programs to calculate heat transfer to gas turbine blades, where each program incorporated a different one or two equation turbulence model. The results were similar for all the models where none could accurately predict transition and the agreement with the experimental results were only fair.
By the late 90s some of the most established and successful Navier-Stokes codes were the two-equation k-ε turbulence models developed by Lam and Bremhorst5 and the two-equation k -co turbulence models developed by Wilcox6, as well as the one equation Baldwin-Lomax and Spalart-Allmaras turbulence models. The flow phenomena around turbine blades have been fully explained using numerical codes, however, Dunn1 concludes that there is no Navier-Stokes model in existence that can accurately predict the transition points on a turbine blade. The idea behind the work presented in this paper was to establish a modelling procedure for the calculation of thermal stresses. The heart of the analysis was the CFD modelling of a transonic turbine Nozzle Guide Vane (NGV), which experiences shock initiated transition on the suction side and stability initiated transition on the pressure side. It was discovered through the CFD analysis that the transition points can be accurately determined by the use of both; a laminar and turbulent flow model.
Experimental Test Case and Previous Analysis on the MARK II
The analysis described in this paper is on the blade known as the MARK II NGV. Hylton et. al.7 performed experimental pressure, temperature and heat transfer measurements on the MARK II. All the experimental data presented in this paper are those taken from Hylton et. al.7. The measurements were performed in a linear, two-dimensional, steady-state aerothermodynamic cascade facility, as further described in Hylton et. al.7.
For the test condition, a pressure inlet condition was set at 3.34 bar with a total temperature of 788 K, while a pressure outlet condition of 1.67 bar was set at the outlet. Hylton et. al.7 determined experimentally the turbulence intensity at 6.5 %.
Bohn et. al.8 performed an aerodynamic and temperature CFD prediction on the MARK II, using the full compressible, 2-D Navier-Stokes equations within the fluid boundary. The closure of the Reynolds averaged equations was provided by the Baldwin-Lomax algebraic eddy-viscosity turbulence model. The temperature prediction was almost exact with the experimental results along the entire blade surface. Dorney and Davis9 performed a 2D CFD study on the Langston cascade also using the Baldwin-Lomax algebraic eddy-viscosity turbulence model. The study showed that the model could predict heat transfer to a blade to within 2% of the experimental results.
Problem Definition and Modelling procedure
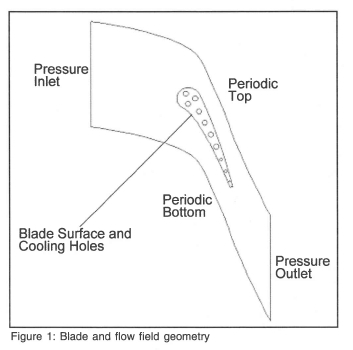
Using the experimental conditions as boundary conditions for the simulations, the authors made predictions using the commercial CFD code FLUENT. The experiments were performed on a seven-vane cascade. To reduce the computational domain, a section of the flow field containing one blade was modelled with the section boundaries being periodic.
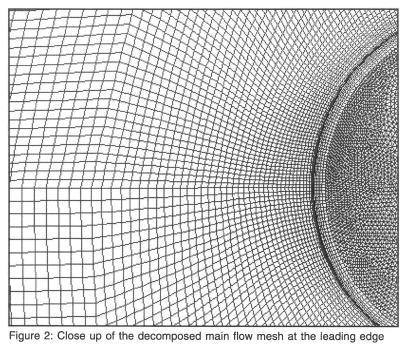
Figure 1 shows the blade along with the boundaries. The flow field was decomposed into many carefully adjusted four-sided regions so as to achieve a near perfect structured quad mesh, a close up of the mesh around the leading edge is shown in Figure 2.
A conjugate heat transfer model was used at the fluid-solid interface. For the cooling holes, a convection heat transfer model was enabled using the experimentally determined heat transfer coefficients and free stream temperature of the cooling air.
In order to ensure that the correct solutions were calculated, a grid sensitivity study was necessary for each different model created. The idea was to demonstrate that the solution was insensitive to the size of the mesh. The grid insensitivity was determined by computing a solution for a specific model, refining the mesh in critical regions, and then comparing the results until changes could no longer be detected. The boundary layer mesh on the test blade is the most critical region and had to be modelled accurately. The size of the boundary layer mesh is dependent on the type of turbulence model being employed in the simulation. The two turbulence models investigated were the one-equation Spalart-Allmaras and two-equation k-ε in its realisable form. For both the models, a fine enough near-wall mesh was required to fully resolve the viscous affected region. The differentiation between fully turbulent and the viscous affected zone is defined by the Reynolds number based on the perpendicular distance y from the blade wall, i.e. where Rey = 200. The Realisable k-ε turbulence model with enhanced wall functions uses a single-wall-law for the entire near-wall region by blending the linear and logarithmic (laminar and turbulent respectively) laws of the wall using a blending function. The blended single-wall law ensures correct asymptotic behaviour for small and large y+ values, and is capable of predicting the velocity profile for 3 < y+ < 10. For both the turbulence models a y+ value of order 1 is required, this keeps the first cell within the viscous affected region.
With all the immense research activity into turbulence modelling, many researchers struggle to compute the heat load to a blade. There is one model in FLUENT that is usually overlooked, namely the Laminar model, which, as its name suggests, is used for laminar flow.
Laminar flow can be defined as an organised flow, which can be streamlined, where the viscous stresses dominate over the fluid inertia stresses. For no-slip wall conditions, FLUENT uses the property of the flow adjacent to the wall/fluid boundary to predict the shear stress on the fluid at the wall. In the laminar flow model, this calculation simply depends on the velocity gradient at the wall, while in turbulent models, approaches such as the near wall treatment are used, which solve for turbulence production and turbulent viscosity throughout the flow domain. The three models were investigated, where for each simulation a first cell size of 0.00314 mm that equated to a y+ value of 1 was used, which was determined by using flat plate theory in order to fairly accurately estimate the first cell size. For a flat plate, Incropera and De Witt10 give the necessary equations to calculate y+ based on free stream velocity, kinematic viscosity and Reynold's number. The flow conditions were used in the calculation. Although flat plate theory assumes zero pressure gradient, the first cell size can be approximated using the above calculation.
CFD Results
For each of the simulations, the convergence was monitored using the scaled residuals of the conserved variables. Although there is no universal law for judging the convergence of a solution, the scaled residuals were set to a convergence criterion of 10-5, which indicates that the overall error in the variables is about five orders of magnitude less than the bulk value in the system.
The two turbulence models performed equally well, with the difference in the results being within 4%. It is therefore necessary to only present the Spalart-Allmaras results. Figure 3 shows the results for the pressure distribution, where the discrepancy is within 2%. On the pressure side, the flow on the surface begins to slowly increase in velocity from the stagnation point causing the gentle drop in static pressure up to 70% axial chord. Thereafter, the flow rapidly accelerates through the reducing blade passage throat area, causing the steep drop in pressure over the last 30 % axial chord of the blade pressure surface and the first 40% axial chord of the suction surface.
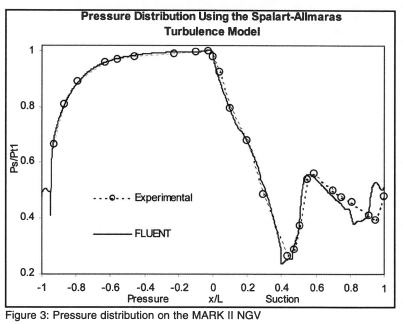
The suction surface pressure prediction follows the drop in pressure down to the minimum, which corresponds to the maximum velocity of 704 m/s, corresponding to a Mach number of 1.53 at 44% axial chord. At this point, no separation is predicted, yet the flow almost instantaneously decelerates from its maximum (704 m/s) supersonic velocity, to a subsonic velocity (457 m/s) in a plane normal to the blade surface, as a result of a shock wave. The shock wave can be clearly seen in Figure 4, where a locally higher density of Mach number contours can be seen on the suction side of the blade.
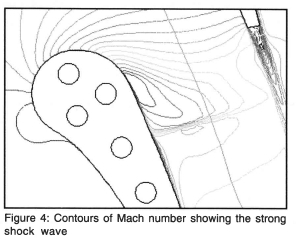
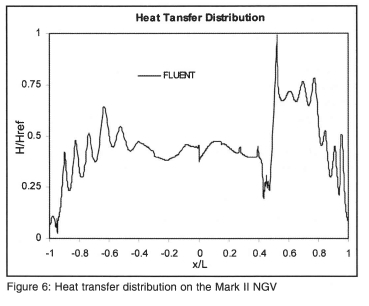
Figure 5 shows the results of the temperature prediction using the Spalart-Allmaras turbulence model. On the pressure side of the blade, the temperature at the stagnation point in the laminar region is over-predicted by 8%. The over prediction decreases to zero at 18% axial chord, where transition to turbulent flow in the boundary layer is initiated at roughly 22% axial chord, which results in a temperature increase from 22 % to 36% axial chord along the transition zone. The development of the heat transfer along the blade surface is analogous to that of the temperature as can be seen in Figure 6. The shock induced transition on the suction side can clearly be seen by the spike in heat transfer. The increase in heat transfer in this region gives further evidence that transition occurs through this area. Unlike the suction side, where transition is primarily Mach number influenced due to the shock wave, the pressure side exhibits an increased tendency towards transition as the Reynold's number is elevated. From 36% axial chord to the trailing edge, there is an increase in temperature, which is exceptionally well predicted by FLUENT, where a local maximum can always be observed in between two cooling holes and a local minimum in the vicinity of a cooling hole.
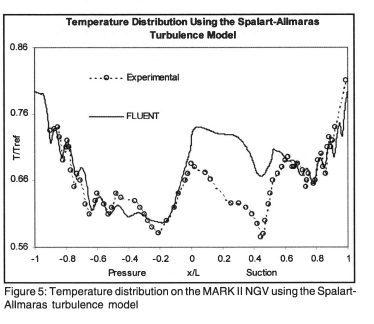
On the suction side of the blade, from the stagnation point, there is a steady decrease in temperature up to the shock wave at 44% axial chord, which encompasses the entire laminar region on the suction side. The large positive pressure gradient in this area caused by the rapidly accelerating fluid due to a decreasing passage cross-sectional area, as well as the decrease in fluid temperature, cause the temperature to decrease in the laminar region.
Both the Spalart-Allmaras and the k-e turbulence models can accurately predict the temperature distribution on the turbulent regions of the blade but are unable to predict transition or the temperature in the laminar region. The failure of the FLUENT turbulence models to predict the correct temperature was put down to the fact that Navier-Stokes turbulence models are formulated for turbulent flows and hence assume turbulent flow over the entire blade surface.
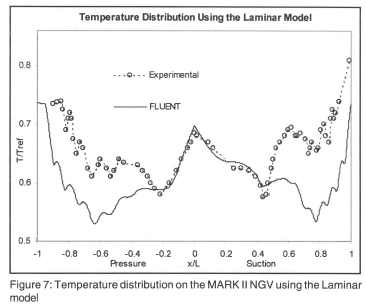
The temperature results for the simulation using the simple Laminar model are shown in Figure 7. The model shows excellent temperature prediction in the laminar region. The stagnation point temperature is over predicted by a mere 1 %. On the pressure side, the temperature prediction is exact with the data in the laminar region up to 18% axial chord where transition is initiated as described earlier. As expected, the model thereafter under predicts the data as it assumes laminar flow and does not model turbulence, which increases heat transfer to the blade. The same trend is observed on the suction side, where the prediction again follows the data accurately up to 44% axial chord where transition as a result of the shock wave occurs. The same under prediction is then observed on the suction side in the turbulent region.
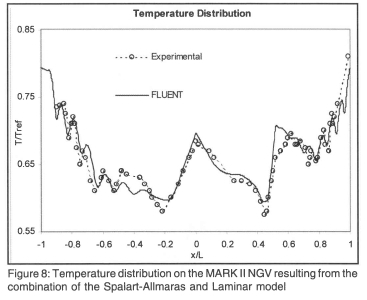
The Laminar model and the Spalart-Allmaras turbulence model can now be combined into a single graph, where the prediction for the laminar region can be taken from the Laminar model and the prediction for the turbulent region from the Spalart-Allmaras turbulence model. Figure 8 shows the result of combining the turbulence and laminar model in a piece-wise fashion, at the transition points, which were determined from the pressure, temperature and heat transfer plots.
FEM Results
The resulting temperature profiles on the MARK II blade surface, as well as the temperature profiles inside the blade on the cooling hole surfaces were used as the boundary conditions for the thermal analysis. The blade was modelled in the FEM code NASTRAN assuming isotropic linear elastic material behaviour. The thermal stress distribution due to the thermal loading in the blade is modelled at the mid-span cross section using the plain-strain condition. The blade material used was ASTM 310 Stainless Steel, where the thermal expansion coefficient, Young's modulus and thermal conductivity coefficient were modelled as a function of temperature.
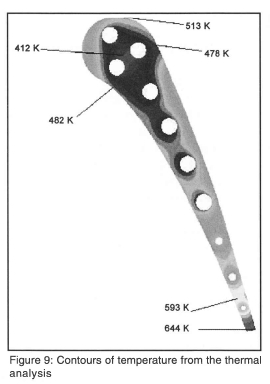
For the thermal analysis the steady state conduction equation was solved in NASTRAN. The resulting temperature contour plot is shown in Figure 9. The maximum temperature predicted by NASTRAN was 644 K and was situated at the trailing edge. The minimum temperature in the blade is predicted in between the second and third cooling holes, where the temperature is 412 K. The overall contour plot shows the effect of the cooling holes, where the temperature can be seen increasing from the cooling holes to the blade surface.
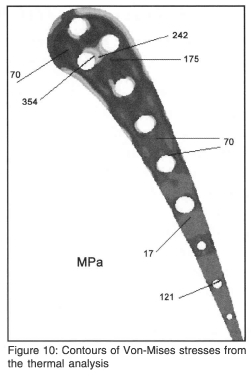
The corresponding Von-Mises stress profile is shown in Figure 10. As expected, the maximum stress of 354 MPa in the blade occurs at the minimum temperature, which is located at the rim of the second cooling hole. Because of the shock wave on the suction side, the heat transfer to the blade after the shock wave increases greatly, as is evident from the temperature plot in Figure 8, where the temperature spikes as a result. The temperature gradients are therefore more severe towards the suction side of the blade and hence result in higher thermal stresses.
Conclusion
By combining the turbulent and laminar flow models, it was discovered, that an excellent correlation to experimental data exists along the entire circumference of the blade. On the pressure side of the blade it is vital to determine where transition is initiated in order to base the laminar/turbulent boundary. As the pressure and suction surface transition points appear to correspond in this case, the piecewise addition of temperature distributions only appears justified (as indicated by the results). Future work will involve extracting heat transfer coefficient distributions of laminar and turbulent solutions, and investigating methods of predicting transition for stability-dominated blades. The authors believe that by involving this promising technique this approach can be applied to any blade configuration. The excellent temperature prediction is vital to achieving correct thermal stress predictions. The entire analysis also showed that a coupled simulation for the fluid flow along the blade profile, the heat transfer in and through the blade wall, and the determination of the corresponding stresses must be performed in order to comprehensively evaluate and understand turbine blade operation.
Acknowledgement
The authors would like to acknowledge ARMSCOR for funding the research.
References
1. Dunn M. G., Connective Heat Transfer and Aerodynamics in Axial Flow Turbines, ASME Turbo Expo, New Orleans, Louisiana, USA, 4-7 June 2001.
2. Langston L. S., Nice M. L. and Hooper R. M., Three-Dimensional Flow within a Turbine Cascade, Journal of Fluids Engineering, ASME, Vol. 99,1977, pp 21-28. [ Links ]
3. Crawford M. E. and Kays W. M., STAN 5 -A Program for Numerical computation of Two-Dimensional Internal and External Boundary Layer Flows, NASA CR 2742, 1974.
4.Daniels L. D. and Browne W. B., Calculation of Heat Transfer Rates to Gas Turbine Blades, International Journal of Heat and Mass Transfer, Vol. 24, no. 5, 1981, pp 871-879. [ Links ]
5. Lam C. K. G. and Bremhorst K., A Modified Form of the k-£ Turbulence Model for Predicting Wall Turbulence, Journal of Fluids Engineering, ASME, Vol. 103,1981, pp 456-460. [ Links ]
6.Wilcox D. C, Turbulence Model Transition Predictions, AIAA Journal, Vol. 13,no.2,1975, pp 241-243. [ Links ]
7. Hylton L. D., Milhec M. S., Turner E. R., Nealy D. A. and York R. E., Analytical and Experimental Evaluation of the Heat Transfer Distribution Over the Surfaces of Turbine Vanes, NASA CR 168015, 1983.
8.Bohn D., Lang G., Schronerborn H. and Bonhoff B., Determination of Thermal Stress and Strain Based on a Combined Aerodynamic and Thermal Analysis for a Turbine Nozzle Guide Vane, ASME Cogen-Turbo Power Conference, Vienna, Austria, 23-25 August 1995.
9. Dorney D. J. and Davis R. L., Navier-Stokes Analysis of Turbine Blade Heat Transfer and Performance, Journal of Turbo-machinary, ASME, Vol. 114,1992, pp 795-806. [ Links ]
10.Incropera F.P and De Witt D.P., Fundamentals of Heat and Mass Transfer, 4th Ed., Wiley and Sons, 1996.
