


Serviços Personalizados
Artigo
 Inglês (pdf)
 Artigo em XML
 Referências do artigo
Indicadores

Links relacionados
-
 Citado por Google
 -
 Similares em Google
Compartilhar

 Permalink
R&D Journal
versão On-line ISSN 2309-8988
versão impressa ISSN 0257-9669
R&D j. (Matieland, Online) vol.39 Stellenbosch, Cape Town 2023
http://dx.doi.org/10.17159/2309-8988/2023/v39a3
A Digital Twin System for Railway Infrastructure
GC DoubellI; AH BassonII; K KrugerIII; PDF ConradieIV
IDepartment of Mechanical and Mechatronic Engineering, Stellenbosch University, South Africa. E-mail: christiaan1207@gmail.com
IIFellow. Department of Mechanical and Mechatronic Engineering, Stellenbosch University, South Africa. E-mail: ahb@sun.ac.za
IIIMember. Department of Mechanical and Mechatronic Engineering, Stellenbosch University, South Africa. E-mail: kkruger@sun.ac.za
IVMember. Department of Industrial Engineering, Stellenbosch University, South Africa. E-mail: pieterc@sun.ac.za
ABSTRACT
This paper presents a concept and case study implementation for a system of digital twins (DTs) aimed at supporting the management of railway infrastructure maintenance. The system of DTs includes DTs and software services. The case study uses, as physical asset, a subset of the railway infrastructure managed by the Passenger Rail Agency of South Africa (PRASA). The DT system concept is evaluated, using a case study, to assess its ability to meet users' information requirements and contextual requirements. The paper also evaluates the generality of the case study results. The case study illustrates that the DT system can acquire and integrate data from diverse data sources and be adapted to a changing context (in terms of user requirements, infrastructural elements, and data sources). Even though the case study considers only a subset of infrastructure, the scalability of the DT system is illustrated, indicating its potential for larger implementations, within and beyond PRASA. The paper, therefore, shows that the DT system concept can provide an integrated view of the data on the railway infrastructure, thereby supporting data-led decision-making by infrastructure maintenance managers.
Additional keywords: Digital twin, railway infrastructure, maintenance management, data-led decisionmaking
1 Introduction
Digital twins (DTs) have received notable attention from researchers [1] as the fourth industrial revolution continues. With roots in product lifecycle management [2], the DT concept has gained popularity in both industry and academia in various application domains. As a consequence, the definition of a DT has become obscure, without one agreed-upon version [3]. This paper draws from a combination of definitions from the context of the built environment [4] and road and rail infrastructure [5] to define a DT as a digital representation of a physical entity that integrates different static and dynamic data sets, as well as different support tools (such as physical models, data analytics, simulation, and prediction capabilities). This digital representation can then be used to generate insights for physical asset management decision-making.
Early applications of DTs have been reported in the manufacturing and aviation/aerospace sectors [6]-[8]. The fourth industrial revolution is also entering the transport, and specifically, the railway sector. Presentations and keynote addresses throughout the InnoTrans 2022 fair promoted "moving towards digital technology", "the rails of tomorrow" (referring to digital technology), monitoring, data analytics, etc. [9].
The implementation of DTs is expected "to greatly improve the management level of planning, design, construction, operation, and safety" [10]. A particular benefit that is often stressed in literature is the potential of DTs to integrate data from heterogeneous data sources [11]-[13].
The application of DTs to railway infrastructure is considered to have great potential, but research towards DT applications in this domain is still scarce [5], [10]. This paper aims to address this scarcity by presenting a concept design and a case study implementation of a DT system for railway infrastructure to support maintenance decisions. Here the term "DT system" refers to a combination of DT hierarchies, software services (typically microservices) and external data sources.
The paper is structured as follows: Section 2 introduces the context for the study; Section 3 reviews related work; Section 4 describes the design of the DT system concept; and Section 5 focuses on the case study implementation. Finally, Sections 6 and 7 offer the evaluation and conclusion, respectively.
2 Application Context
Railway infrastructure here includes rails, sleepers (railroad ties), ballast (the coarse gravel material upon which sleepers are laid), overhead electrical track with its supporting structure and supply, signalling and communication. The term "perway" (permanent way) is used in this context for the rails, sleepers and ballast.
To illustrate the value that the concept of a DT holds for railway infrastructure, the paper uses the application context of the Passenger Rail Agency of South Africa (PRASA), and in particular the department responsible for infrastructure maintenance in the Western Cape. This section describes the PRASA context in terms of maintenance management processes and the corporate agenda at the time of writing.
Maintenance management at PRASA is currently done by different teams for each infrastructural domain (i.e. perway, electrical, signalling and telecommunications), through a combination of planned and unplanned maintenance activities. Planned maintenance is performed in accordance with a condition-based maintenance tactic, with periodic inspections indicating the condition of the infrastructure according to which the necessary action is taken. Unplanned maintenance activities are executed in accordance with a breakdown maintenance tactic and are dispatched without consideration for the planned maintenance activities.
A strong need for PRASA's infrastructure management office is the consolidation of all the data that they have available on specific assets from different sources. An example of this is the overhead cables (catenary cables), for which there are four data sources describing different aspects of its condition: the geometry (from the track geometry inspection vehicle, TGIV); the wire thickness (from contact wire measurement reports); the data captured by routine maintenance tasks (from the maintenance database, EMPAC); and whether the cable has been vandalised or stolen (from the "Electrical control report").
Each of the above-mentioned data sources also has its own interface (such as accessed from a local hard drive, through proprietary web-services, via email, etc.). The nature of the data in these data sources typically differs in terms of format, structure, frequency of data acquisition, means through which it is acquired (e.g. through manual inspection, telephonic reports, or autonomous acquisition through inspection vehicles) and means with which it is recorded (e.g. manual or automatic data entries).
Along with the issue of numerous, disparate data sources for each asset or asset group, there is also the concern of different stakeholders and decision-makers not having access to the same information at the time of making decisions. This results in isolated decisions that could be better informed, or have greater impact, if coordinated or made with integrated information on hand.
An example of such an isolated decision is when the stakeholders responsible for specific breakdown maintenance tasks must decide when to dispatch maintenance teams. Often, these stakeholders are unaware of where other breakdown maintenance tasks (associated with different infrastructural domains) are being executed at the time, which may lead to conflicts or delays. In such cases, if breakdown maintenance tasks could be better coordinated, infrastructural corridors may be brought to an operational condition much quicker.
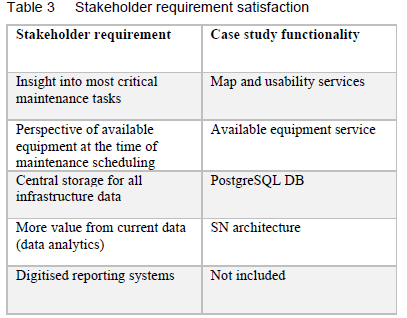
For operational infrastructure, a series of semi-structured and ad-hoc interviews with PRASA staff indicated a need for insight into most critical maintenance tasks, a perspective of available equipment at the time of maintenance scheduling, central storage for all infrastructure data, more value from current data (e.g. by means of data analytics), and digitised reporting systems.
Along with these needs, PRASA has expressed, as a high-level objective in their Corporate Plan for the medium-term expenditure framework period of 2021-2024, the intent to "enable the transition to a digitally enabled organisation", under which plans to "build digital capabilities to empower PRASA's workforce" from 2021 to 2022 and "Shift from silos to the enterprise-wide services model (central ICT unit)" are reported [14].
The current contextual needs for maintenance management, together with the corporate agenda towards digitisation, present the opportunity to evaluate the implementation of a DT for the context of railway infrastructure.
3 Related Work
Railway infrastructure is a complex system [15]. DTs, from their inception, have been considered to hold great promise for the management of complex systems [2]. However, the application of DTs to railway infrastructure to date has been scarce [5].
Current DT applications are generally centred around maintenance management [5], [16], with specific points of interest that can be grouped into three categories: firstly, prognostics and health monitoring (including simulation and condition monitoring) [12], [16]-[21]; secondly, closed lifecycle management [22]-[24]; and, finally, sustainable smart infrastructure [25]. These are naturally all related, but this categorisation highlights the focus of the DT applications as seen in literature.
Building Information Modelling (BIM) currently forms an integral component of the published literature in the context of DTs applied to railway infrastructure. BIM is considered the basis for constructing DTs, with a combination of cloud computing, BIM and IoT technologies forming the DTs' typical design as encountered in most of current literature [26].
The roles of BIM within the DT context in railway infrastructure are for data visualisation [20], [27], for storing the relevant data [27], and for providing services based on the data (such as calculating the "energy performance" of the assets) [28]. [27] considers BIM as a data source, distinct from the DT, while other publications use the terms BIM and DT interchangeably [10], [16]. In the latter case, the BIM software used, such as Navisworks or Bentley BIM, is responsible for the integration of data from the monitored data sources. In all of these cases, proprietary BIM technology is considered integral to the implementation of DTs.
Furthermore, studies that describe implementations of DTs within railway infrastructure can be classified as having done either an actual implementation [20], [27]-[29] or a conceptual implementation [22], [23], [25]. Most of these implementations do not use just a single DT, but a system of DTs, with various digital entities, representing the corresponding physical infrastructural elements (entities), and interacting with one another through information exchange.
4 Digital Twin System Concept
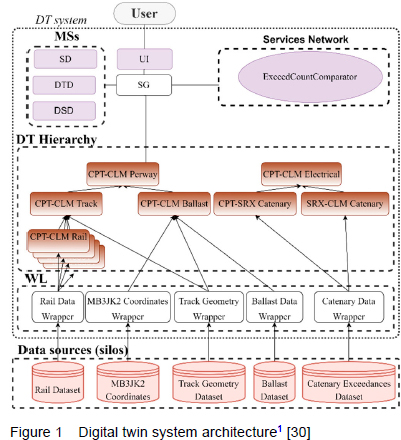
This section presents the DT system concept and describes how the underlying reference architecture was adapted to the application context. The first subsection describes the architecture as a whole, which is followed by discussions of selected architectural components and the interaction protocol. Even though the architecture presented in Figure 1 shows a specific number of DTs, wrappers and data sources, it is straight-forward to expand it to include more instances of each, as will be illustrated in Section 5.3.
Further details regarding the implementation and operation of the digital twin system, including system startup and data ingestion procedures, is given by [30].
4.1 Overall Architecture
The architecture adopted here for the DT system (Figure 1) is an adaption of the distributed DT system reference architecture presented by [31] - following a similar grouping paradigm, and logical interconnections between the different elements.
The DT system has three major component groupings: the Services Network (SN); the DT aggregation hierarchy; and the Management Services (MS). The components interact via the Services Gateway (SG), while the architecture interacts with users through the User Interface (UI) component.
The specific elements are elaborated upon in the following sections, but it is worth noting the differentiation between the physical reality reflection in the DT hierarchy and the value extraction in the SN, which is a key feature of this architecture. However, the architecture also includes services hosted by DTs (referred to below as DT services), where those services rely on only the data of their particular DT.
The architecture in Figure 1 extends the one proposed by [31] in two ways: firstly, it adds a fourth major component grouping - the "wrapper layer" (WL) - within which wrapper components exist (described in Section 4.3); and, secondly, it divides the "Directory Service" (DS) component into three separate components: a Services Directory (SD), a DT directory (DTD) and a Data Source Directory (DSD).
Although the concept in Figure 1 omits some of the MS given by [31], such services may be included in a full implementation.
[31] uses the "six-layer architecture for digital twins with aggregation" (SLADTA), as developed by [32], for the DT aggregation hierarchy. SLADTA presents a DT as internally composed of six architectural layers. In the aggregation hierarchy, DT Instances (DTIs) obtain data from the physical data sources, while DT Aggregates (DTAs), in turn, obtain and aggregate data from the DTIs and other DTAs. SLADTA is here also modified to suit the context in that Layer 1 (the sensors and actuators) and Layer 2 (the data acquisition systems and sources) are removed. Layer 3 (the short-term data repository) is here used for interaction inside the DT system and not for data ingestion. Layer 4 (the IoT Gateway) accesses the data from sources that already store processed measurements in databases (DBs). In the DT system concept, the traditional role of Layer 5 (long-term data repositories) is retained, while aggregation communication is not done through Layer 4 (as done by [32]), but Layer 6 (the emulation, simulation and services component) provides information to other DTs and to services. Layer 6 also contains DT services, where those services rely purely on the data contained by its DT.
The definition of DTAs is also extended to include the ability to obtain data not only from DTIs, but also directly from external data sources. The extension of the DTA definition is required because some data sources contain information that relate to an aggregation and not its underlying DTIs.
4.2 Data Sources
Data sources typically already exist in the form of either proprietary systems or established organisational systems, each with its own purpose. It is often impossible or undesirable to alter these data sources. Therefore, for use in this DT concept, the only requirement is that an interface must be available to access the data in these data sources - no modification to the original source(s) is required. If, for example, a data source provides data through a web Application Programming Interface (API), the Internet Protocol (IP) address, authentication information and the message ontology for that web API need to be known.
Examples of data sources that exist in PRASA's current context include the locally hosted Microsoft Excel files generated by the TGIV, the locally hosted contact wire measurement records, the web servers for the substation energy meters, and the signalling system's proprietary software system and DB.
4.3 Wrappers
The WL is the main enabler for interfacing with various data sources. The components within the WL provide a standardised interface to the other elements in the DT system, hiding the peculiarities of the respective data sources. Each wrapper is therefore custom developed for a designated data source. The wrapper components enable SN services and DTs to make standardised data requests to any data source (regardless of the source's interface specifications) through the associated wrapper. This approach enhances the vender-neutrality and scalability of the DT system.
To limit the amount of custom development required for the wrapper components, each wrapper's functionality is limited to: monitoring its data source for new data; broadcasting a notification to all listening/subscribing components when new data becomes available in the data source; and responding to data requests from other components in the DT system.
Changes in a specific data source would thus only require changes to that data source's wrapper component, instead of having to change the entire DT system's communication channels or changing the interfacing code for all the DTs that require data from that data source.
Queries to data sources often involve large data transfers, incurring significant latencies. The wrapper, therefore, contains a temporary, local storage component to store a mirror of the data source every time it is checked for new data. This reduces the number of repeated queries that need to be made to the data source, thereby reducing the overall latency of data ingestion into the DT system.
Wrappers also present a means through which SN services can interface with other services or DB outside of the DT system. The wrapper layer therefore also provides the SN with a standardised interface to external data sources, enhancing modularity and ease of system maintenance.
4.4 Digital Twin Aggregation Hierarchy
The DT hierarchy maintains the digital representation of the physical entities. The choice of infrastructural elements to be represented by a DT is determined by the stakeholder requirements. In this paper, the DTs were selected and grouped based on infrastructural domain type and physical proximity - parameters of interest in the execution of maintenance.
A DT should maintain knowledge of its own scope of reality and the relevant domain knowledge associated with its physical counterpart. This is done by the DT maintaining an inherent knowledge of where the data for the entity that it represents can be accessed (e.g. from its own storage or from another data source), and the relationships between the data (e.g. which kilometre values on a certain railway corridor relate to which latitude and longitude values).
Each DT maintains this knowledge of its data in Layers 3, 4 or 5 of SLADTA (depending on whether and how the data is stored) and provides the data as information by means of services through Layer 6. A DT can also provide static data, such as its attributes (e.g. the date of entity installation, the entity's OEM, etc.).
The DT can be configured to obtain data through either of the general approaches mentioned in literature: data federation or data warehousing [33]. The former would be used in the case where the DT does not store the data itself, but rather maintains knowledge of where the data is stored and how it relates to other data. In such a case, data is then gathered upon service request. Data warehousing, on the other hand, is where the data is gathered for storage. This is typically done to duplicate data from sources for which the long-term accessibility of data might be in doubt. When dealing with large quantities of data, one might also want to opt for data warehousing instead of data federation, since the transfer of large quantities of data over the network, between various components, might incur significant latencies - as is e.g. discussed in Section 5.3.
The concept presented here employed data warehousing when obtaining data directly from the wrappers, storing (duplicated) the data that they got from the wrappers in a DB in the DT's Layer 5. Data transfer from a non-wrapper component to any other component in the system, however, employed data federation.
4.5 Services Network
The SN is typically implemented as a service-orientated or microservices architecture, possibly utilising a service orchestrator. The SN is intended to provide to users information that is derived from (i.e. integrated, processed or analysed) the data present in the DT Hierarchy, e.g. to satisfy the user requirements for the management of the physical system. Although it is not shown in Figure 1, the SN can also access data unrelated to the DT hierarchy's reality reflection, such as weather forecast data or financial data.
4.6 User Interface
The implementation of the UI is highly application-specific and therefore the DT system concept encapsulates those details in the UI component and requires that the communication between the UI and the DT system utilises the SG. However, the UI and the services (DT and SN services) are closely interlinked because the destination of the information requests (i.e. the services) should to be indicated in the message that is sent from the UI.
4.7 Inter-component Interaction
Components within the DT system interact by exchanging messages through the sequence illustrated in Figure 2.
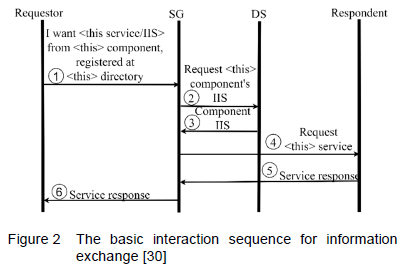
Every component (other than the SG itself) will, upon start-up, be provided with both its own Interaction Information Set (IIS) and the IIS of the SG by the configuration file. The IIS contains the information required for interaction with the component in question, such as socket address (IP address and port number where the component is hosted) and authentication information. The SG is initiated with knowledge of the IISs of the MS.
The basic interaction sequence occurs when a component requesting information (the requestor) wants to obtain information from a component that can provide the information (the respondent). Note that components can serve as both requestors and respondents. The sequence is initiated by the requestor sending to the SG a message that specifies three key-value pairs: the identity of the desired respondent (i.e. the name/id of the component that should provide the requestor with information); the management service where the IIS for this component can be found; and the service requested from it (i.e. the information that it should provide). This is indicated by step (1) in Figure 2.
The SG then queries the specified management service for the respondent's IIS (steps 2 and 3), after which the SG then also requests the respondent to provide information through the specified service (step 4). Respondents will then perform the service and provide the SG with the result (step 5), which the SG passes on to the requestor.
However, it might be necessary for the respondent to query other components while performing its service. In this case, there are two types of interactions: inter- and intragroup interactions. With intergroup interactions, the interaction(s) occur between components in different areas of the system, such as between the DT hierarchy and MS, or between the DT hierarchy and the SN. Intragroup interactions occur between components within the same group, such as between components within the SN, or between components within the DT hierarchy.
An example of intragroup interactions is where a given SN service requests information from the same SN services every time. This is opposed to the intergroup interactions required when "SN service A" requests information from "DT A" for one query, but for another query requires information from "DT B" instead.
The two types of interactions are differentiated based on the intensity of interactions. Intragroup interactions are characterised by the same set of components interacting with one another repeatedly, leading to interactions that generally occur much more frequently and are more predictable than intergroup interactions.
Due to the frequency of interactions involving the same components, intragroup communications are designed to request the IIS of the responding component only once, after which the requestor can store the IIS of that component. By storing the corresponding components' IISs, the latency for consecutive interactions involving the same components is reduced. The reduced latency for consecutive interactions between components within the same group subsequently accumulates to significantly decrease the latency for the entire system.
The less predictable intergroup interactions, on the other hand, will have to request the SG repeatedly for the ISS of the responding component.
5 Case Study Implementation
5.1 Service Specifications
For the case study implementation of the above DT system concept, the PRASA department described in Section 2 was the primary stakeholder. PRASA staff indicated several needs related to the integration of data and the display of integrated information regarding a specific asset or asset group. This section discusses the demarcation and specification of service functionality to meet those needs in the case study. The means through which information is exchanged between different components in the DT system, along with an example case, are presented in Section 5.2.
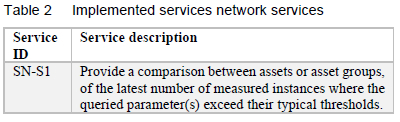
As discussed in Section 4.1, information provided by the UI to the user is obtained from either DT services, SN services or a combination of DT and SN components. The needs of PRASA outlined in Section 2 were therefore used to formulate the DT services in Table 1 and the single SN service shown in Table 2, as a typical example of such services. The system requirements stipulated by the stakeholders were selected and addressed as summarised in Table 3.
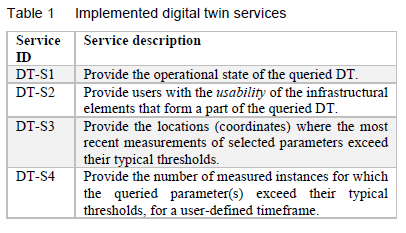
The term usability, mentioned in DT-S2 of Table 1, requires some explanation. For an asset to be usable for train operations, it needs to be both operational and accessible by the train. It will only be accessible if all the infrastructural elements that might prohibit trains from reaching that asset are also operational (thereby enabling the train to pass). The usability of an asset can therefore be described by the following logical expression:
Usability = (OpStateSelf)&&(OpStateRelatedInfra)
where OpStateSelf refers to the operational state of the infrastructural element itself, and OpStateRelatedlnfra refers to the operational state of the infrastructural elements that determine the accessibility of the infrastructural element in question. Note that implementing this service, therefore, requires some domain knowledge on what elements are critical to accessibility.
5.2 Information Request Sequence
To demonstrate the use of the interaction sequence described in Section 4.7, this section provides a chronological discussion of the interactions required by a typical service, i.e. the service that compares the number of threshold exceedances of the electrical infrastructure with the exceedances of the ballast. The various interactions are illustrated in Figure 3.
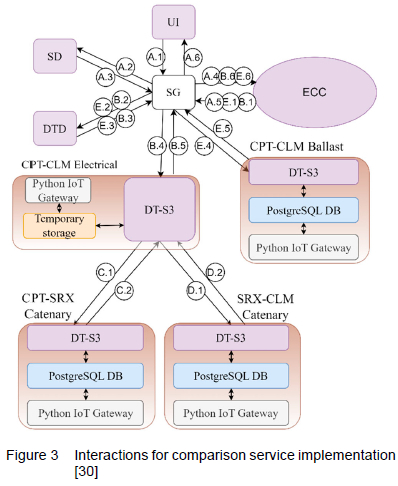
A total of five basic interaction sequences can be seen in Figure 3. The letters indicate distinct interaction sequences, and the numbers next to the letters indicate the step in each of the respective basic interaction sequences (as explained in Section 4.7). For example, "A.3" indicates the third step in the first interaction sequence initiated.
Note that interactions A, B and E are intergroup interactions, whereas interactions C and D are intragroup interactions. Here it can be observed that the electrical DT does not ask for the IlSs of the catenary DTs again; instead, the catenary DTs are queried directly from Layer 6 of the electrical DT. It can do this because the IISs of the two catenary DTs have been stored in its own temporary storage layer (Layer 3 in SLADTA) from previous interactions.
A service request is initiated when the user requests information about the comparison between the two infrastructural elements from the UI. This initiates basic interaction sequence A. The back-end of the UI then communicates to the SG that the SN-service labelled "ExceedCountComparator" (ECC) is requested (A.1). The SG then obtains the IIS of the ECC service from the SD (A.2-A.3), creates a Socket.io connection to the ECC service, and requests the comparison (A.4).
Upon receiving this request, the ECC service first needs to obtain the number of exceedances from the Electrical DT (B.1-B.6); thereafter, it should also obtain the number of exceedances of the Ballast DT (E.1-E.6) before it can perform its own function of comparing the two and populating the UI with a resulting string (A.5).
The number of threshold exceedances are provided to the requesting component, through the DT-S3 service (refer to Section 5.1) within the DTs' Services Layer (Layer 6). Interaction sequences B and E are similar. However, sequence B will take slightly longer to perform, since the Electrical DT would first need to perform two additional intragroup interactions (C and D). Note that interactions C and D do not require the SG, since these are intragroup communications - the IIS of the "child" DTs are already known to the requesting DT.
5.3 Further Implementation Details
For the case study, the UI was implemented using the Svelte web framework (using JavaScript, HTML and CSS) and all other components were implemented as a distributed Python program, packaged with all its dependencies into a single Microsoft Windows executable file. Socket.io was used for communication between all components in the system, with predefined event names and JSON messages with a predefined data structure used for communication. A locally hosted PostgreSQL DB was used for Layer 5 long-term repositories.
A JavaScript Object Notation (JSON) configuration file was used to specify the network address, data source(s), component relationships and the threshold values of system components upon start-up. For the case study implementation, changes to these properties require a restart of the DT system to take effect, but a more mature implementation could include "hot updating" capabilities. A JSON configuration file also contained static information for each DT, e.g. the date of entity installation, the entity's OEM, etc.
6 Evaluation
An evaluation of the DT system concept, as implemented for the case study, is presented in this section. The DT system's ability to meet users' information requirements and contextual requirements is evaluated by first validating the system operation - confirming that all the services described in Section 5.1 can be performed. Thereafter, the system's reconfigurability (i.e. the system can adapt to changing contexts) is evaluated. This section concludes with a broader, qualitative evaluation that, inter alia, considers how widely the case study results are expected to be applicable.
This validation and performance evaluation is based on three sets of tests during which each of the Python components was run as a separate thread, with the total set of components distributed across two computers. A third computer was also included in the reconfigurability evaluation. Further details and figures of the evaluation can be found in [30].
6.1 Validation of Service Execution - Tests
The performance of service execution was validated in two tests, which focused respectively on the system response time and system behaviour in case of data loss.
6.1.1 Response Time
The response time was determined, and verification of the system's ability to provide the services stipulated in Section 5.1 was performed, by requesting the entire available range of services from a variety of DTs (as summarised in Table 4). The output on the UI served to provide verification of service-provision, and the response times were calculated as the period from user-request to output-display.
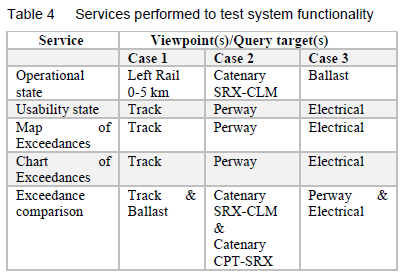
The Map of Exceedances, Chart of Exceedances and Exceedance Comparison services are all applied to filter for where the condition parameters exceed 1% of their respective thresholds. The historical data inspected (through the Chart of Exceedances service) considers the period of 1 January 2019 to 30 July 2022. Each of the three cases was queried six times for each service.
The tests illustrated the successful completion of all the services shown in Table 4. The outputs to the UI, having been verified with individual filters applied to the raw Microsoft Excel data, serve to verify that the services performed the intended function of displaying visual results upon request.
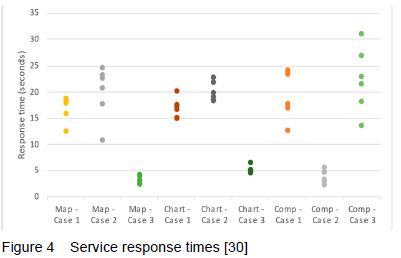
Figure 4 shows a plot of the response times, excluding the response times for the operating condition and usability of the infrastructure. The omitted response times were less than 1 second.
6.1.2 Operation amidst Original Data Loss
The developed DT system should be robust to scenarios where the original data source becomes unavailable while the DT system is in operation - such as when data is corrupted, or a proprietary data provider terminates its contract with PRASA. To handle such a scenario, the DT system concept duplicated the original data from the data sources in a PostgreSQL DB.
For the experiment, the DT for the SRX-CLM catenary is queried to provide a chart that illustrates the number of measurements that exceed the allowable threshold by more than 1%, for the period of 1 January 2019 and 30 July 2022. To simulate the removal/disappearance of the original data, the data table that represents the data source for which the MB3JK2_OHTE_Exceedances wrapper is responsible, is deleted while the system is running. This makes the "original" data (i.e. in the source) unavailable to any entity that did not duplicate it in a different storage location.
The continued availability of the data in the system was then tested by performing the same query before and after deleting the source data. The output to the UI before and after removing the original data source provided the same result, with the graph on the output of the UI plotting the same dates, with the same number of exceedances calculated.
6.2 Validation of Service Execution -Discussion
6.2.1 Service Response Times
Figure 4 shows most services achieving response times around 20 seconds, which is slow. Only the operational and usability services performed in the millisecond range. A first possible explanation for the slow response is the communication delay induced by subsequent queries made by the services to other system components - more queries generally corresponded to slower response, with each query involving multiple steps, as shown in Figure 2. However, the usability service (performing in the millisecond range) often had to make the same number of queries, or more, than its slower-performing peers.
A second possible explanation would be the processing time required. One distinguishing factor between the fast and slow performing services is that the operational and usability services did not have to process any measurement data. A correlation is also observed between the volume of the data to be processed by the other services. The electrical DT had to process significantly less data for its services than the other two DTs. The average number of records ingested per DB update by the catenary DTs, "feeding" the electrical DT, is 153. In contrast, the average number of records ingested the track, ballast and rail DTs are more than 47 000 each. It is thus postulated that the bottleneck causing slower service response came from the large DB queries, and the processing time required to filter and manipulate those records.
Another possible contributing factor is that each component in the architecture ran in its own thread and that the performance was degraded by the large number of threads.
Future work should evaluate whether it is better to pre-calculate and store the results, so that services do not need to recalculate or process all of the data every time that they are queried. The additional storage requirements will have to be traded off against the lower latencies.
6.2.2 Operation amidst Original Data Loss
The test and results reported in Section 6.1.2 illustrate that the system can still obtain data from its own DB even when the original data is unavailable. When data is thus duplicated within the DT system, it does not matter what happens to the original data source - the data will be contained in and accessed from the DT system itself.
The decision to duplicate the data was made for this case study. However, it is not a prerequisite to the proposed architecture, and it should be noted that duplicating data in such a way requires careful consideration of the advantages and disadvantages of creating and maintaining such storage.
6.3 Validation of Reconfigurability - Tests
The reconfigurability of the system is evaluated through a consideration of the complexity of reconfiguration. Here, complexity is evaluated by quantifying the lines of code or configurations to be modified/added/removed for a specific reconfiguration action, and the time taken to complete such an action.
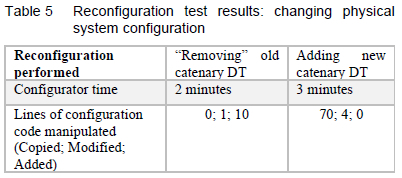
6.3.1 Reconfiguration test I: Changing physical Infrastructure
This test simulates a scenario where a piece of the catenary wire from Salt River substation to Claremont substation is stolen, vandalised, or broken, causing the entire catenary wire to be replaced. The stakeholders require that the data from the "retired" asset needs to be retained for use in prognostics and health monitoring applications that might be developed in the future. The test determines the effort required by the system configurator and developer to adapt the DT system accordingly.
The system configurator will be responsible for adapting the DT hierarchy to reflect the change in physical infrastructure brought about by the removal and replacement of the catenary wire. Because the data should still be available, the only change that is required to the old DT is to remove its data acquisition links to the data sources in the system configuration file. This DT now represents the asset in its last known state - not obtaining any new information.
A DT that represents the new catenary wire should now be specified in the configuration file. Since the catenary DTs are all similar in configuration, this could be done by just reusing code from another (functioning) catenary DT and making only minor changes.
Having performed these modifications in the configuration file, the system configurator will restart the system.
The time taken and lines of code changed in the reconfiguration tests are given in Table 5. It should be noted that this reconfiguration requires no changes to the source code of the system, but only to the configuration file. The system downtime, which is counted from when the system is restarted until all the DTs have registered themselves, was just under 3 minutes.
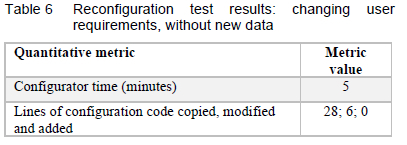
6.3.2 Reconfiguration test II: New user information requirements, without new data
System reconfiguration to meet changing user requirements can be separated into two scenarios, as presented in this subsection and the following one. The first scenario is where a new perspective on data already captured by the DT system is required. The scenario used for the test was that executive management required a combined view of the perway and electrical railway infrastructure between Cape Town and Claremont.
For this scenario, a new DT was created to provide the new perspective. Adding a new DT here followed the same procedure as described in the previous section, except that here the new DT was configured to run on a different computer than the old DTs to also evaluate the distribution capabilities of the concept. This reconfiguration required only additions to the configuration file (no source code changes or other configuration file manipulations).
The quantitative results are summarised in Table 6. The changes did not require any source code changes and therefore no developer time. System downtime (from restart until completed registration of all components) was slightly under 4 minutes.
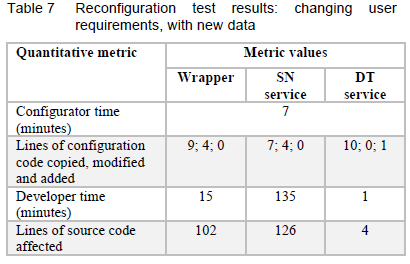
6.3.3 Reconfiguration test III: New user information requirements, with new data
The second system reconfiguration scenario is where completely new information is required and that information relies on a new external data source. In this scenario, the planning office desired a service with which they can view the available maintenance tools/materials for any entity in the DT hierarchy. The available maintenance tools/materials are tracked on a MS Excel file that is manually updated and stored locally on a computer that is used for the DT system.
In this scenario, a new SN service was added. This new SN service was configured to run on its own on a third computer. A new DT service also had to be added in the DT source code, to provide the new SN service with the infrastructural domain that the DT forms a part of, because the SN service needs this data to establish the available materials. The infrastructural domain of each DT was added as an additional parameter to its configuration file.
To make the materials DB accessible to the DT system, a new wrapper component that interfaces with the materials DB was developed. The new SN service queries a DT to ask it for its infrastructural type and, subsequently, queries the newly-developed wrapper to request which materials are available for that domain. The result is then provided to the UI.
For this reconfiguration, the system developer had to develop three new components: the SN service, the DT service, and the wrapper. The addition of the new components required modifications to the configuration files, which could be done by a system configurator. The corresponding quantitative metrics are given in Table 7. As in the previous test, system downtime (from restart until completed registration of all components) was slightly under 4 minutes.
6.4 Validation of Reconfigurability -Discussion
The reconfigurability tests illustrated the value of a significant feature of the DT system concept, i.e. that each DT and each service operates as a separate holon [34]. These holons are autonomous and independent of other components, though also loosely coupled and cooperative -sending or responding to asynchronous messages containing data, information, requests, etc. The modular DT hierarchy and SN services allow for an intuitive subdivision of concerns, which simplifies reconfiguration.
The first reconfigurability test (Section 6.3.1) shows that the DT hierarchy's role to reflect the physical reality of infrastructural network, with a clear mapping from physical assets to DTs (another feature of the holonic approach), simplifies the introduction of a new "area" of concern. Representing a new physical aspect similar to previous ones or removing a physical aspect merely requires changes to configuration files.
This holonic nature simplifies the reconfiguration of the DT system in a number of ways: Changing user needs, in terms of the information they require, can be accommodated by providing new services in the SN, by adding DT services or by adding new DTs that aggregate data for a new perspective. Section 6.3 gives examples of all of these system changes. Physical infrastructural changes, such as the removal of infrastructure, can easily be implemented by "retiring" DTs from the system through configuration file changes (as illustrated in the first reconfiguration test, reported in Section 6.3.1). Similarly, adding physical aspects similar to ones previously included, can be mirrored in the DT hierarchy by adding another DT through configuration file changes. The test in Section 6.3.3 show that changes in data sources (e.g. a new company is contracted to provide additional data on the condition of a piece of infrastructure that already has a DT component in the system) can be accommodated by adding wrappers to the system and configuring these wrappers to be data sources to the existing DTs. These changes all affect only the components directly involved, and the rest of the DT system can be left untouched. As illustrated in the reconfiguration tests, these reconfigurations also require limited, if any, changes to the system source code.
Section 6.3 therefore shows how the DT system concept allows for new and different stakeholders' concerns to be easily accommodated. The ability to provide these different perspectives that overarch typical system or organisational boundaries was appreciated by the PRASA staff to whom the results were presented.
The holonic behaviour can also be exploited by letting the different components of the DT system run as different processes (on the same or different computational hardware) or as different threads on the same hardware. The system components can thus easily be distributed across computational resources. This is proven in the reconfiguration tests (Section 6.3), where a new DT and a new SN service were run on other computers that were not included in the system implementation before.
Even though the DT system had to be restarted to effect these changes, the overall downtime can be considered minimal given the low frequency at which this data is typically required.
6.5 Qualitative Evaluation
For the DT system to be generally applicable to a larger network (and not just to the selected sections of infrastructure of PRASA in the Western Cape), it needs to be both scalable (accommodate more DTs and more services), and able to provide DTs for physical elements that might not have been encountered in the case study. The latter factor is referred to as the "representativeness" of the case study.
Even though the performance of a significantly scaled system was not evaluated, the reconfigurability evaluation in Section 6.3, where new services and DTs were added to the system, showed that it requires little development effort to add more infrastructure and/or services. Because the DT system can run distributed over many computers, performance is unlikely to limit scalability.
The reconfigurability evaluation also shows that the DT system concept does not predetermine the actual infrastructure to be represented. Rather, in an implementation, the significant considerations are (a) the data acquisition method, i.e. whether data warehousing or data federation is used, or a combination of these; and (b) the data sources that need to be integrated for the DT of that specific infrastructural element and, specifically, their interfaces, and the structure and types of the data they provide. Therefore, the representativeness of the case study depends on the representativeness of its data acquisition methods and data sources.
In terms of data acquisition, the case study illustrated three approaches: Only data warehousing was used for the rail, ballast and catenary DTs; only data federation was used for the perway and electrical DTs, and for the section DT added in the reconfiguration test in Section 6.3.2; and a combination of data warehousing and data federation was used for the track DT.
The data sources that were queried varied in terms of their interfaces and the types of data that they provide. Three types of interfaces were implemented in the DT system concept and the tests: SQL queries to a PostgreSQL DB; REST-API queries to a simulated (Flask) web server; and reading from a local Microsoft Excel file (the materials "database"). Though this range is not extensive, it is more than what is typically encountered currently for PRASA's data. The second reconfiguration test also illustrated that new interfaces could be created when required.
The case study shows that data can be integrated in spite of these different interfaces and datatypes. For example, the ballast DT integrates data from a wrapper that obtains data through SQL queries, as well as from a wrapper that obtains data through a REST API. Similarly, data is extracted from a single data source to multiple DTs: both catenary DTs obtain their data from the same wrapper, and the rail DTs obtain their data from another wrapper, different from that of the catenary DTs'. In contrast to this, the track DT obtains location data (latitude, longitude and distance from Cape Town station) from its constituent rail DTs, while the condition or geometry of the track is provided by the wrapper. The case study, therefore, shows that the DT system concept can integrate data from different external sources and/or DTs.
In summary, the representativeness of the case study is not based on the selection of physical infrastructural elements, but rather on their characteristics in terms of the data sources encountered and integrated. This broadens the scope of applicability notably, since the case study would be representative of any case where these data source, interface and integration challenges exist. Therefore, it can be concluded that the DTs in the system concept provide a representative case for a railway infrastructure network like PRASA's and even other contexts where data from diverse data sources need to be consolidated in the creation of a DT system.
The case studies used maintenance decision support as target application and showed that the DT system concept is well suited for such applications. However, the decision support provided was not unique to maintenance and the DT system concept should also be able to support other decision making that will benefit from integrated information on railway infrastructure.
In contrast to typical DT implementations in infrastructure reported to date, the DT system presented here uses a vendor-neutral approach. None of the technologies used to implement the DT system is vendor specific and many alternatives are available for developers. This vendor-neutrality ensures that the architecture can be used in different contexts, and implemented in various ways, and prevents it from being excluded from consideration by organisations that already implement proprietary software systems.
7 Conclusion and Recommendations
This paper presents a DT system concept aimed at representing railway infrastructure and supporting data-led decision making. The concept is developed and evaluated using a case study context of supporting maintenance decisions, but the concept can be more widely applied.
The DT system comprises primarily a wrapper layer that interfaces with external data sources, a DT hierarchy that maintains a digital reflection of the physical reality and services that generate information for decision support, using the data in the DT hierarchy. Each service can be either directly associated with a DT or can form part of a network of services. The DT system serves users through user interfaces that communicate with the rest of the system through a gateway.
The paper presents case studies that demonstrate that the DT system concept supports maintenance decisions for PRASA's railway infrastructure network. The case studies also show that the concept is amenable to reconfiguration as the physical system changes or scales and as user requirements develop, with minimal changes to the system source code. The reconfiguration case studies further demonstrated that the modularity and holonic nature of the DT system allow distribution across several hardware devices.
The DT system concept presented here adds to the growing body of knowledge in the field of DTs in the context of railway infrastructure. Two of the features of the presented concept that is in contrast to other implementations in literature are: Firstly, this DT system uses vendor-neutral software and is amenably to incremental development. Secondly, the DT system concept can facilitate the integration of data from different data silos, instead of replacing existing information systems. These two features minimise barriers to the adoption of the concept and contribute to the applicability of the DT system concept in a wide variety of contexts, beyond maintenance management of PRASA railway infrastructure.
The natural decomposition of the complex system into its constituent components, coupled with the extensibility of the architecture, was particularly attractive for the PRASA staff who evaluated the end result. The architecture enables them to add new perspectives to the system, thereby obtaining new and different insights into data that was previously isolated as a result of system or organisational boundaries. The modularity also enables distributed operation - across several hardware devices, as has been tested in this implementation.
Further research is, however, required to reduce the service response times. The adoption of such a system in a commercial setting would also require the verification of the computational and network characteristics of the deployment context. Data security and data-handling policies may have to be adapted, while also ensuring network safety and security.
Acknowledgements
This research was financially supported in part by the National Research Foundation of South Africa (Grant Number 129360) and the PRASA Research Chair at Stellenbosch University. The PRASA Research Chair and PRASA staff at the Metrorail infrastructure depot at Salt River have also greatly contributed with regards to insights, perspectives, and expertise. The authors gratefully acknowledge all these contributions.
References
[1] F. Psarommatis and G. May. A literature review and design methodology for digital twins in the era of zero defect manufacturing. International Journal of Production Resesearch, 61(16):5723-5743, 2022. [ Links ]
[2] M. Grieves and J. Vickers. Digital twin: mitigating unpredictable, undesirable emergent behavior in complex systems. In: Kahlen, J., Flumerfelt, S., Alves, A. (eds) Transdisciplary Perspectives on Complex Systems, pages 85-113, 2017.
[3] A. Fuller, Z. Fan, C. Day and C. Barlow. Digital twin: Enabling technologies, challenges and open research. IEEE Access, 8:108952-108971, 2020. [ Links ]
[4] A. Johnson, J. Heaton, S. Yule, S. Luke, D. Pocock, A. K. Parlikad and J. Schooling. Informing the information requirements of a digital twin: a rail industry case study. Proceedings of the Institution of Civil Engineers: Smart Infrastructure and Construction, 174(2):33-45, 2021. [ Links ]
[5] J. Vieira, J. Poças Martins, N. Marques de Almeida, H. Patrício and J. Gomes Morgado. Towards resilient and sustainable rail and road networks: A systematic literature review on digital twins. Sustainability, 14(12):7060, 2022. [ Links ]
[6] W. Kritzinger, M. Karner, G. Traar, J. Henjes and W. Sihn. Digital twin in manufacturing: A categorical literature review and classification. IFAC PapersOnLine, 51(11):1016-1022, 2018. [ Links ]
[7] B. R. Barricelli, E. Casiraghi and D. Fogli. A survey on digital twin: Definitions, characteristics, applications, and design implications. IEEE Access, 7:167653-167671, 2019. [ Links ]
[8] M. Shafto, M. Conroy, R. Doyle, E. Glaessgen, C. Kemp, J. LeMoigne and L. Wang. Modeling, simulation, information technology & processing roadmap. National Aeronautics and Space Administration, 2010. URL: https://www.nasa.gov/pdf/501321main_TA11-MSITP-DRAFT-Nov2010-A1.pdf.
[9] InnoTrans. Closing report - InnoTrans 2022 Industry summit for rail transport and mobility. InnoTrans, 2022. URL: https://www.innotrans.de/en/press/press-release/news_15360.html?referrer=/press/press-release/#news-en-15360.
[10]Y. Gao, S. Qian, Z. Li, P. Wang, F. Wang and Q. He. Digital twin and its application in transportation infrastructure. IEEE 1st International Conference on Digital Twins and Parallel Intelligence (DTPI), pages 298-301, 2021.
[11] S. Malakuti, R. Borrison, A. Kotriwala, B. Kloepper, E. Nordlund and K. Ronnberg. An integrated platform for multi-model digital twins. Proceedings of the 11th International Conference on the Internet of Things, pages 9-16, 2021.
[12]W. Xiaodong, L. Feng, R. Junhua and L. Rongyu. A survey of digital twin technology for PHM. In V. Jain, S. Patnaik, F. Popentiu Vlädicescu, I. Sethi (eds) Recent Trends in Intelligent Computing, Communication and Devices. Advances in Intelligent Systems and Computing, pages 397-403, 2020.
[13]L. Fernando, C. S. Durão, S. Haag, R. Anderl, K. Schützer and E. Zancul. Digital twin requirements in the context of Industry 4.0. In: P. Chiabert, A. Bouras, F. Noël, J. Ríos (eds) Product Lifecycle Management to Support Industry 4.0. PLM 2018. IFIP Advances in Information and Communication Technology, pages 204-214, 2018.
[14]PRASA. Corporate Plan 2021/2024. URL: https://www.prasa.com/Corporate%20Plans/Corporate%20Plan%202021-24.pdf, 2021.
[15]L. Mussone and R. W. Calvo. An analytical approach to calculate the capacity of a railway system. European Journal of Operational Research, 228(1):11-23, 2013. [ Links ]
[16] S. Kaewunruen, J. Sresakoolchai and Y. H. Lin. Digital twins for managing railway maintenance and resilience. Open Research Europe, 1:91, 2021. [ Links ]
[17]A. Kochan. Digital twin of the ECTS application. WUT Journal of Transportation Engineering, 131:87-98, 2020. [ Links ]
[18]M. Ahmadi, H. J. Kaleybar, M. Brenna, F. Castelli-Dezza and M. S. Carmeli. Adapting digital twin technology in electric railway power systems. 12th Power Electronics, Drive Systems, and Technologies Conference (PEDSTC), pages 1-6, 2021.
[19]E. Febrianto, L. Butler, M. Girolami and F. Cirak. A self-sensing digital twin of a railway bridge using the statistical finite element method. Cornel University. URL: http://arxiv.org/abs/2103.13729, 2022.
[20]C. Ye, L. Butler, B. Calka, M. Iangurazov, Q. Lu, A. Gregory, M. Girolami and C. Middleton. A digital twin of bridges for structural health monitoring. Structural Health Monitoring 2019, Proceedings of the Twelfth International Workshop on Structural Health Monitoring, pages 1619-1626, 2019.
[21]A. Kampczyk and K. Dybeł. The fundamental approach of the digital twin application in railway turnouts with innovative monitoring of weather conditions. Sensors, 21(17):5757, 2021. [ Links ]
[22]F. Jiang, Y. Ding, Y. Song, F. Geng and Z. Wang. An architecture of lifecycle fatigue management of steel bridges driven by digital twin. Structural Monitoring and Maintenance, 8(2):187-201, 2021. [ Links ]
[23] S. Boschert, C. Heinrich and R. Rosen. Next generation digital twin. Proceedings of TMCE, pages 7-11, 2018.
[24] Y. Tchana, G. Ducellier and S. Remy. Designing a unique digital twin for linear infrastructures lifecycle management. Procedia CIRP, 84:545-549, 2019. [ Links ]
[25] D. G. Broo and J. Schooling. A framework for using data as an engineering tool for sustainable cyber-physical systems. IEEE Access, 9:22876-22882, 2021. [ Links ]
[26] M. Marocco and I. Garofolo. Integrating disruptive technologies with facilities management: A literature review and future research directions. Automation in Construction, 131:103917, 2021. [ Links ]
[27] M. Marzouk and A. Abdelaty. Monitoring thermal comfort in subways using building information modeling. Energy and Buildings, 84:252-257, 2014. [ Links ]
[28]P. E. D. Love and J. Matthews. The "how" of benefits management for digital technology: From engineering to asset management. Automation in Construction, 107:102930, 2019. [ Links ]
[29] A. Meixedo, J. Santos, D. Ribeiro, R. Calçada and M. D. Todd. Online unsupervised detection of structural changes using train-induced dynamic responses. Mechanical Systems and Signal Processing, 165:108268, 2022. [ Links ]
[30] G. C. Doubell. A Digital Twin System for the Integration of Railway Infrastructure Data, MEng thesis, Stellenbosch University, Stellenbosch, South Africa, 2022. [ Links ]
[31]C. Human, A. H. Basson and K. Kruger. A design framework for a system of digital twins and services. Computers in Industry, 144:103796, 2022. [ Links ]
[32] A. J. H. Redelinghuys, K. Kruger and A. Basson. A six-layer architecture for digital twins with aggregation. In: Borangiu, T., Trentesaux, D., Leitão, P., Giret Boggino, A., Botti, V. (eds), Service Oriented, Holonic and Multi-agent Manufacturing Systems for Industry of the Future. SOHOMA 2019. Studies in Computational Intelligence, pages 171-182, 2019.
[33] J. Pathak, Y. Jiang, V. Honavar and J. Mccalley. Condition data aggregation with application to failure rate calculation of power transformers. Proceedings of the 39th Annual Hawaii International Conference on System Sciences (HICSS'06), Kauia, HI, USA, pages 241a-241a, 2006.
[34] A. Koestler. The Ghost in the Machine. New York: The Macmillan Company, 1967.
Received 18 April 2023
Revised form 31 August 2023
Accepted 30 November 2023
1 Although the details are not relevant to this paper, the case-specific abbreviations used here and elsewhere are: CPT: Cape Town Station; CLM: Clairmont Station; SRX: Salt River Substation; MB3JK2: a track inspection service.

