


Services on Demand
Article
 English (pdf)
 Article in xml format
 Article references
Indicators

Related links
-
 Cited by Google
 -
 Similars in Google
Share

 Permalink
R&D Journal
On-line version ISSN 2309-8988
Print version ISSN 0257-9669
R&D j. (Matieland, Online) vol.39 Stellenbosch, Cape Town 2023
http://dx.doi.org/10.17159/2309-8988/2023/v39a2
XFOIL Performance Validation for Medium-Scale Variable Pitch UAV Rotor Systems
B. V. R. NielsenI; M. GilpinII
IDepartment of Mechanical Engineering, Durban University of Technology, South Africa. E-mail: Byron.nielsen@outlook.com
IISAIMechE Member. Department of Mechanical Engineering, Durban University of Technology, South Africa. E-mail: markg@dut.ac.za
ABSTRACT
This study focuses on experimentally validating the performance of XFOIL, a sophisticated software airfoil analysis tool used for approximating lift and drag coefficients. XFOIL output data was incorporated into a theoretical model simulating a variable pitch rotor system operating in a hovering state. The output of the Blade Element Momentum Theory (BEMT) rotor model is compared to thrust and power output performance data collected from a constructed rotor test bench and analysed in MATLAB. Using XFOIL as input, the BEMT rotor model was observed to yield good robust results when compared to experimental data, but demonstrated sensitivity to airfoil performance characteristics, laying the groundwork for future empirical validation. In comparing BEMT model performance, it was interesting to find that thrust performance remained within tolerance in contrast to an overprediction of rotor power output resulting from XFOIL drag at high blade pitch angles. Upon further interrogation by means of variable isolation, XFOIL demonstrated instability resulting from sensitivity to variability of model constraints. Modification of rotor geometry definitions or environmental constants beyond the test environment framework showed simulated systems may not necessarily behave reliably nor enhance output performance. This highlights the critical importance and utility of experimentation for understanding theoretical model behaviour or validating simulation output performance.
Additional keywords: AoA - Angle of Attack, XFOIL - Airfoil Analysis Application, BEMT - Blade Element Momentum Theory, UAV - Unmanned Aerial Vehicle, BEMT - Blade Element Momentum Theory, FSI - Fluid Structure Interaction, BLDC - Brushless Direct Current Motor
Nomenclature
Ar Annulus Area [m2]
A Rotor Area [m2]
aB Blade Mach Number
Β Chord Length [m]
CD Drag Coefficient
CL Lift Coefficient
CP Power Coefficient
CT Thrust Coefficient
cisasl Speed Of Sound Sea Level [m/s]
GTW Gross Take-off Weight [kg]
Ib Mass Inertia [kg. m2]
Ism Sample Mean Current [A]
Im Mean Current [A]
Is Sample Current [A]
lb Blade Length [m]
L Energy [Kg. m2/s]
Nr Rotor Speed / Head Speed [r/s]
Nι Blade Section Increment [n]
np Pitch Sample Rate / Resolution [n]
n, Current Sample Rate / Resolution [n]
nraw Raw Sample Rate / Resolution [n]
Nb Number Of Blades
Ps Sample Power Output [W]
Ppoiy Polynomial Power Output [W]
Re Reynolds Number
rt Radial Position Increment
Tsm Sample Mean Thrust [Kg]
Tm Mean Thrust [N]
Ts Sample Thrust [N]
Tpoly Thrust Polynomial [N]
Vave Average Voltage [V]
Vm Mean Voltage [V]
Vs Sample Voltage [V]
vkin Kinematic Viscosity [N. s/m2]
a Lift Slope Constant
θίχ Increment Pitch Angle, (AoA) [Deg]
rnet Net Torque [N. m]
ωτ, ωb Rotational Speed, Tip Speed [rad/s]
λ Induced Velocity [m/s]
σ Rotor Solidity [N/m2]
1 Introduction
The UAV market is expected to triple in size by 2027, and the significant investment forces generated by large corporations have accelerated technological development efforts of quad-rotorcraft platforms for light transport, agricultural, and surveillance applications. [1] With advancing electronics, aerodynamics, and materials science, sophisticated rotorcraft technologies will seamlessly integrate into everyday life, becoming nearly imperceptible. [2] Given their success, these platforms continue facing scalability challenges attributed to factors such as energy density constraints and propulsion efficiency. [3] The optimization challenge lies in expanding mission profiles while balancing performance expectations through trade-offs in endurance, payload capacity, cost, and complexity. [4-6]
Focusing on propulsion efficiency challenges highlighted earlier - For quadrotors employing fixed-pitch propulsion systems, manoeuvring and stabilization is achieved by altering the thrust balance of opposing rotors through rapid speed modulation, requiring greater effort from motors to overcome resulting inertial forces produced by rotors. BEMT theory and other works [7-9] show that rotors incur efficiency losses from work required to maintain altitude at low flight speeds. Fixed-pitch propulsion systems used in modern UAV's [10] are optimized for specific [7-9,11] Combined, the technical challenges presented earlier are especially emphasized in medium scale quad-rotorcraft (GTW>10 kg) considering how payload and endurance are intwined. [12-15]
If the technical challenges shown in work examining the adaption of variable pitch propulsion technology for quadrotors could be overcome [16-20], the benefits of higher endurance and payload capacities resulting from optimizing rotor efficiency could have significant commercial implications.
While software-based modelling and simulation strategies applied to the mentioned problems could provide high-resolution insights, aircraft are sensitive to aerodynamic performance characteristics, often requiring empirical validation to ensure reliable performance. [21] Consequently, this work will focus on empirically evaluating the scalability performance in terms of rotor geometry of a variable pitch rotor system scaled for a medium size quadrotor platform using MATLAB and XFOIL.
Developing a MATLAB-based rotary propulsion system is dependent on combining momentum principles with elemental airfoil flow theory [8,22]. Airfoil performance characterized in terms of lift and drag coefficients is traditionally evaluated empirically from measurements obtained in wind tunnel testing [23]. Due to limited cost and access to test equipment, airfoil flow behaviour can also be simulated using software tools such as Ansys Fluent or Ansys CFX which offer sequential (One-Way Coupling) or parallel (Two-Way Coupling) analysis schemes depending on the significance of the FSI (fluid structure interaction) effect [24,25]. In this case, the BEMT model will rely on a well-established wind tunnel emulator XFOIL known for its ease of use, robustness, and computational efficiency. In this work, XFOIL is used to simulate the airfoil lift (CL) and drag (CD) coefficients using code developed using potential flow panel and integral boundary layer formulation methods to predict flow separation. Since the solver assumes flow to be two-dimensional, inviscid, and incompressible it may not accurately represent real-world scenarios with three-dimensional or compressible effects. [21,24,26]
It was observed that the simulation of the theoretical rotor model correlated with experimental results.
2 Theoretical Formulation
The MATLAB-based model used to simulate variable pitch rotor system (see §4) incorporates well established Blade Element Momentum Theory (BEMT) referenced from Bramwell, et al. [8] and Johnson [7]. To simulate maximum power demand scenario, the rotor is assumed to be in a hovering condition using rigid, untwisted blades.
Coefficients for thrust (1) and power (2), CP and CT are obtained by integrating over the blade length from radius R0 Rmax at a given angle of attack 9t form lift and drag coefficients CD, CL obtained from XFOIL.
Rotor power output is defined from coefficients of airfoil profile drag dCPo (3) to overcome drag acting on the blade, and induced power dCPi (4) to generate lift. Since velocity ωΓ (8) increases with radius station rt, dCPo and dCPi are integrated over the blade span at blade angle increment θt, with Ni=100 blade sections.
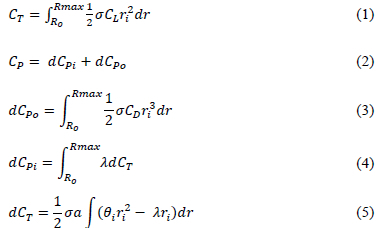
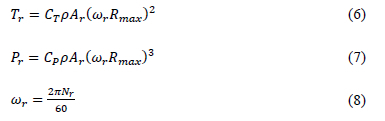
From the equations above, and taking air density as ρ = 1.224kg/m3 - rotor thrust Tr (6), and power consumption Pr (7), is then calculated by:
2.1 Rotor Solidity, Inflow Velocity, Lift Slope and Blade Area
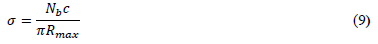
Rotor solidity σ (9) defines thrust force per unit area of the annulus and is the function of the number of blades Nb, chord length c, and rotor tip radius Rmax.
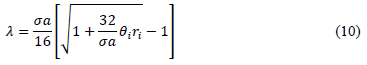
Combining blade element and momentum theory [22], for a rotor in a hovering condition with non-uniform inflow, induced velocity λ (10) can be calculated:
Airfoil lift slope a (11) is defined from the ratio of lift coefficient CL (output from XFOIL) to incidence angle a.

In accordance with momentum conservation laws [27], a net torque, rnet produces a rotating motion in a body, where changes in rnet causes an angular acceleration (12). In this study, we assume a constant rotor head speed (Nr) therefore angular velocity a>b and rnet are constant, conserving momentum. Thus, balanced torques result in no angular acceleration, therefore rnet = 0 (13).
Any net torque rnet (13) transmitted during operation is therefore equal to mechanical friction of the drive-train and hub of the Brushless Direct Current (BLDC) Motor, as well as aerodynamic lift and drag forces acting on the rotor blades. (See §3.1)
3 Rotor Test Bench Design
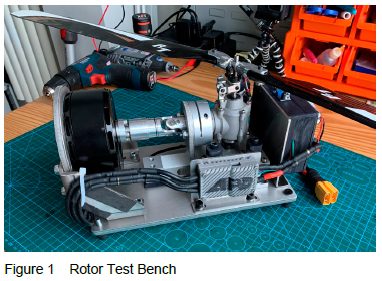
A rotor test bench (figure 1, below) was constructed to serve as the empirical framework for validation of XFOIL and BEMT models outlined in §4.
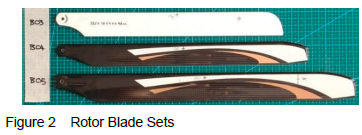
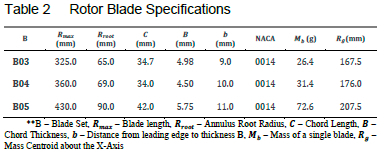
Various sets of rotor blades (figure 2, below) with specifications listed in table 2 were tested at specific rotational speeds (Nr) and pitch angles (θix ). Sample data collection and processing are further detailed in §3.5.
3.1 Technical Description & Specifications
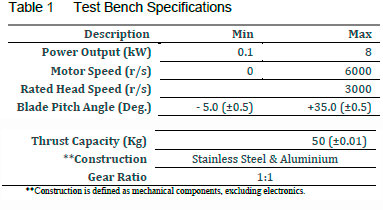
In reference to figure 1 above - an APD 200F3 electronic speed controller (ESC) powers a V10L T-Motor BLDC coupled to 1:1 bevel gearbox. Collective pitch is modulated by a servo, and current and voltage are detected using an MSC1500 hall effect sensor and voltage divider. IR sensors monitor rotor head speed, and a 50kg load cell connected to a HX711 amplifier measures thrust. The Arduino Nano logs data collected from the servo and sensors via a serial monitor. Table 1 provides an overview of the rotor test bench specifications.
3.2 Test Bench Working Principle
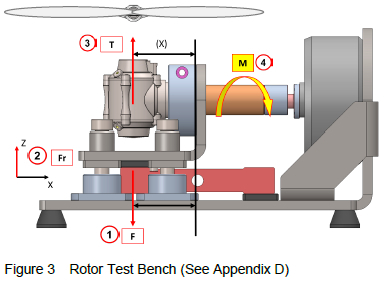
As illustrated in figure 3, the load cell is positioned such thrust force Τ (3) is transmitted to the load cell via reactionary force F (1) along the Z-axis. Bearing guides sliding on rigidly mounted guides isolate residual reactionary forces Fr (2) or moments Μ (4) about X|Y axes to prevent torsional forces acting on the load cell.
3.3 Experimentation
Three blade sets were tested at constant speed (Nr = 1000 - 2500 rpm) with a collective pitch of Qix = 0° - 14°. Sample data was processed and conditioned in MATLAB before being compared to theoretical performance results. The sample collection and processing procedure is summarized below.
1. Set rotor to specific speed with θix = 0°,
2. TARE load cell to zero thrust readout,
3. Collect rij,> 10 samples for (Vsm,IsmTsm,θix) at pitch increment θίχ ,
4. Increase pitch 6ix + 0.25° and repeat for entire pitch range mentioned above.
3.4 Raw Sample Collection - Arduino Nano
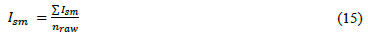
Voltage (Vs) and current (Is) are measured at pitch increment θix and accumulated with a sample rate of nraw = 100. Mean values Vsm and Ism are calculated and output on the serial monitor from (14) and (15):

Raw thrust (Ts) samples are collected and averaged over nraw from (16):

The pitch angle (0j) measurement range is determined by manual calibration using a dial gauge with setpoints θmax, θmin corresponding to the pulse width modulated (PWM) signal output range ymax, ymin.
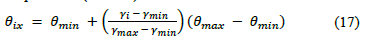
Pitch angle θix (17) can then be determined by converting current servo position (γ{) to degrees using linear interpolation. (Table 1)
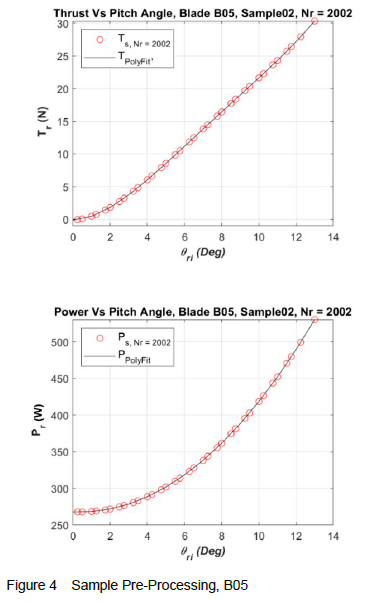
3.5 Sample Pre-Processing & Signal Conditioning
MATLAB is used to process raw sample data (Tsm, hm, Vsm,, θίχ) to calculate the indicated power consumption (20) & thrust (21) produced by the rotor system. (Figure 4)
Over the duration of a test run for a single set of blades, voltage drop was observed to be consistently small (Vave = 2 - 2.5%). Mean voltage, Vm (18) is calculated by averaging accumulated raw samples Vsm for duration of the test run (np) at a constant speed of Nr using:

As blade pitch (θix) increases, more work is done by the rotor to move air, consequently leading to higher current demands from the motor to maintain speed. Mean current (Im) is calculated at each pitch increment (θix) from:

Where n, is the sample range collected at increment θix.
Using the mean voltage (18) and current (19), rotor power output (Ps) can then be calculated by applying Ohm's Power Law:

Using the same sample range for (19), Rotor thrust Tr is calculated by converting mean thrust (Tsm) samples accumulated at increment θix into Newtons (g = 9.810 m/ s2) and then averaging over n, (21):

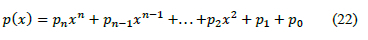
Due to the 10bit resolution limitation of the ATmega 328 microcontroller used in the Arduino Nano, the indicated pitch angle resolution was limited to θix ± 0.25° . Discrete outputs of θix that didn't correspond to integers (θix ¢. Z) were approximated in MATLAB by applying a 3rd degree polynomial curve fitting method [28] as it was challenging to perform a direct comparison to theoretical approximations described in §2. The polynomial form is represented as θi(x) = p(x) = Σnk=0Pkxk (22). Results for thrust and power consumption (JPoly, PPoly) were obtained as shown in figure 4.
4 Rotor Modelling & Analysis
Analysing the theoretical performance characteristics of rotors necessitated the development of a two-step method. Matching the test environment in which Re, MB = const, performs a polar analysis of the airfoil, accumulating lift and drag coefficients at pitch anglesθix following the workflow illustrated in figure 7, Appendix A. MATLAB [29] then evaluates the rotor performance for thrust (Tr) and power output (Pr) of the BEMT rotor model (see figure 9, Appendix B and figure 10, Appendix C) using data defined in table 2, and output from XFOIL.
Firstly, XFOIL is configured to perform an airfoil analysis to evaluate lift and drag properties. This analysis method is also useful for interrogating airfoil performance characteristics such as stall behaviour and for optimising aerodynamic efficiency. The following respective are commands required to configure XFOIL for polar accumulation of lift and drag coefficients, Ci, Cd. Refer to user documentation for definitions [26]:
1. NACA - Airfoil number (table 2)
2. OPER: Operation selection,
3. ITER: Number iterations = 100,
4. VISC - Set viscous analysis mode to active,
5. RE - Input Reynolds Number (Re), see below,
6. MACH - Set Critical Mach number (aB), see below
7. SEQP - Select sequential polar analysis mode,
8. PACC - Set to polar accumulation active,
9. ASEQ - Set pitch angle range and increment (0° -13°, θίχ + 1.00).
Reynolds number is determined from Re = VrB/vkin, where vkin = 1.5111E~5 N. s/m2 (air properties at ISASL), tip velocity Vr = ωrRmax , and chord length Β (table 2). Mach number is calculated from aB = Vr/cISASL where the speed of sound for air at sea level is cISASL = 343 m/s.
Rotor thrust and power output is determined for each pitch increment of θίχ = 1.0° using a MATLAB-based rotor model based on BEMT (see §2). Code originally developed by Bell [29] was extensively modified to integrate XFOIL outputs and optimized to automatically accumulate sequential calculations as illustrated in figure 5. The analysis method follows the respective steps below according to the workflow illustrated in figure 8, Appendix A.
1. Import lift and drag coefficients from XFOIL text file,
2. Define blade specifications (table 2),
• Number of blades Nb,
• Rotor Max Radius Rmax (m),
• Rotor root radius R0 (m),
• Chord length Β (m),
3. Air density, pisasl = 1.225 kg/m3,
4. Pitch angle range, θίχ = 0° - 13° (deg.),
5. Rotor Speed Nr (r/s).
5 Results & Findings
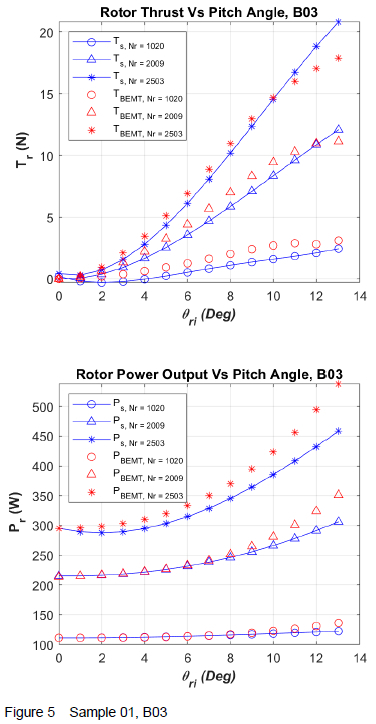
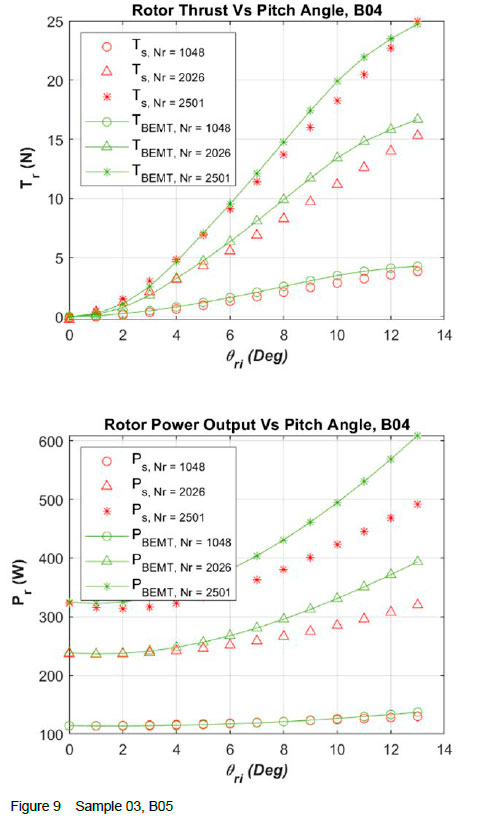
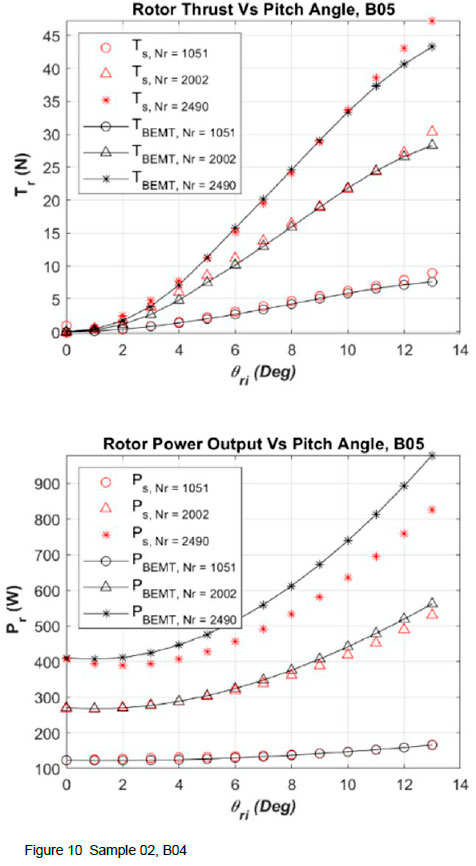
Comparisons discussed in section 5 use blade set B03 (figure 5) for illustrative purposes, comparisons for B04 & B05 are shown in figure 9 (Appendix B) and figure 10 (Appendix C).
5.1 Thrust Comparison Overview
Theoretical approximations for thrust output by BEMT and XFOIL closely matched experimental data (TBEMT, Tsample) at speeds (Nr = 1000 - 2500 rpm) and rotor pitch angles (θί = 0° - 14°) for all rotor blades tested (table 2).
As shown in figure 5, the consistency of the MATLAB-based rotor model's performance, particularly in terms of thrust and power output, is noteworthy when considering the variations in geometry and speeds that were tested. This consistency implies that the simulated environment in MATLAB closely aligns with the conditions observed in the experimental tests. In other words, the results obtained from the MATLAB simulation closely match the outcomes observed during physical testing. This alignment suggests that the simulated and real-world environments share a strong resemblance, thereby indicating the reliability and accuracy of the MATLAB model in predicting the thrust performance of the rotor system.
5.2 Power Output Comparison Overview
When operating rotor blades at speeds Nr « 1000 -2000 rpm, theoretical power consumption estimates (Pbemt) were observed to follow experimental test results (Psample), as Psampie ~ Pbemt within a pitch range of et = 0° - 7°. At larger pitch angles (θi « 7° - 13°), theoretical power outputs are overestimated (Pbemt > Psample) for all rotor blades tested at all speed ranges. To try and establish deviations observed for power output mentioned prior, a further investigation was conducted as is discussed in §5.3.
5.3 Investigation of XFOIL Instability
Applying configuration settings and variables (see §3.3), XFOIL outputs Ci, Cd for each increment of 9t after which the BEMT rotor model (illustrated in figure 8, Appendix A) outputs performance data according to the blade set as defined in table 2. All rotor experiments were performed in an ideal environment matching the model geometry definition and processed in MATLAB to remove sensor noise.
From momentum theory it is shown that outputs Tr, Pr are dependent on constants p, Ar, ωΓ, Rmax relating to thrust and power coefficients (CT, CP), which in turn rely on Cl and Cd output by XFOIL. [7,8] Given the rotor scale, model performance is highly dependent on the accuracy of Cl, Cd, especially for low Reynolds numbers in which experiments were conducted. [21,24]
From comparisons (figure 5), it observed that thrust (Tbemt) behaviour remained stable (eTr « 10 - 12%) indicating that BEMT rotor model can be used reliably with XFOIL to analyse thrust performance scalability of medium scale rotor systems. In contrast, Pr was consistently overestimated, and so a deeper analysis of the rotor model and XFOIL configuration was conducted.
The BEMT power term, PBEMT (7) is dependent on CP (2) - the sum of lift induced drag dCPi (3) and parasitic drag dCPo (4). Adjustment to rotor definitions and environmental constants (Rmax, B, vkin) when simulated according to tests (where Nr ~ 1000 - 2500 rpm and 0° - 13°) did not improve prediction for PBEMT - but it was found that the contribution of dCPi remained stable as Cl output by XFOIL remained almost unchanged.
Further expanding on findings - the increase in Pbemt at higher pitch angles (9t « 1° - 13°) was found to be resulting from the contribution of dCPo which are dependent on Cd output from XFOIL.
To investigate Cd variance, the analysis described above was repeated for B05 (Table 2) with rotor speed set to Nr = 2500 rpm focusing on isolating the air quality factor Ncrit (see §4). Output results are plotted for CL and CD as shown in figure 6.
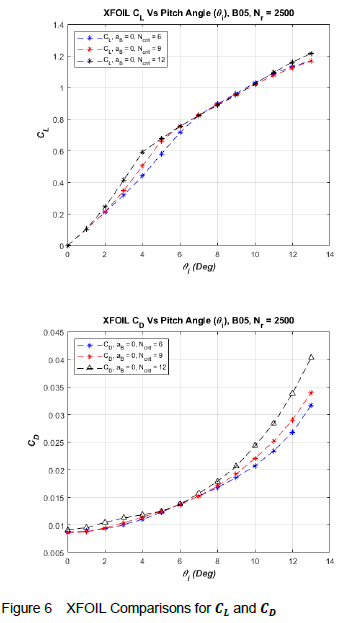
Before discussing results, it's important to note that the Ncrít =3 - 14 (range) parameter in XFOIL defines air disturbance level in which the airfoil operates in from poor to ideal. In this work (figure 5), Ncrit = 9 is used to assume average air turbulence quality. Authors of XFOIL note that calculating dynamic pressure over the airfoil may result in convergence errors since flow is dominated by viscous effects when Re < 1x10⁶ and compressibility effects can be assumed to be negligible. [26] At Nr = 2500 rpm, rotor produces Re = 3.13x10⁵ which is below the aforementioned Re threshold, thus MACH is prescribed as aB = 0.
As an example (figure 6), Cd correlates to increasing values for Ncrit = 6 - 12 when aB = 0, especially when the blade enters the stall region (9t « 1° - 13°). As shown, the Ncrit has no significant effect on reducing Cd which contributes to dCPo leading to overestimating PBEMT.
It was intriguing to discover that XFOIL appeared to stabilize at higher Reynolds numbers (Re > 1x10⁶) with minimal improvements for Cd when augmenting model parameters Rmax, B, rotor speeds (Nr), or environmental constants (vkin). However, no quantitative comparisons or conclusions could be made because the model definition no longer reflected the actual test scenario.
6 Conclusion
The non-linear behaviour exhibited by aerodynamic systems is inherently challenging to approximate, highlighting the importance of experimental validation for simulated performance. As comparisons (figures 5, 9, 10) for all rotor geometry variants demonstrate, the BEMT rotor model accurately emulated the test environment indicating that rotor geometries, speeds and environmental constraints are comprehensively defined.
Thrust (Tbemt) approximations are consistently predicted within a tolerance of eTr « 10 - 12% at varying speed ranges (Nr = 1000 - 2500 rpm). Closing the error gap will require the inclusion of more advanced theoretical assumptions with regards to rotor aerodynamics such (tip losses etc.), environmental variabilities and more sensitive test equipment.
In contrast to thrust, rotor power output (PBEMT) was overestimated showing BEMT model performance remains sensitive to the accuracy of airfoil characteristics as was found in similar work. [21,24] Interrogation of Pbemt revealed XFOIL instability to predict Cd and may be related to low Reynolds numbers (Re) which possibly lie beyond what the software could resolve. Artificially modifying model definitions to increase Re showed some improvement to predict Cd, but model definitions no longer mirrored the test environment.
Reviewing the comparisons above as depicted in figures 5, 8 & 9 , it is important to emphasize that the BEMT model demonstrated consistent performance, but exhibits sensitivity to the precision of environmental factors, model constraints, and airfoil properties output from XFOIL. Variable isolation efforts of model definitions also revealed evidence of a complex interdependence between multiple parameters which influence the contribution of drag Cd to dCPo, indicating that care should be taken when approximating airfoil performance characteristics.
Finally, this work demonstrated that the theory and methodology outlined in this work has practical utility and can be directly applied during early design parametrization efforts to establish accurate thrust and power estimations. This investigation has inspired efforts for future such as
• Refining the BEMT rotor model to enhance the precision of thrust and power predictions,
• Analysing complex parameter interdependencies that influence drag contribution to better understand their impact on the performance of the BEMT rotor model.
• Validation with a wider variety of rotor geometries and operating conditions to further validate the performance and applicability of the BEMT rotor model in a variety of scenarios.
References
[1] L. Wood. Commercial Drones Market: Global Industry Trends, Share, Size, Growth, Opportunity and Forecast 2022-2027. URL https://www.researchandmarkets.com/reports/5642337/commercial-drones-market-global-industry-trends.
[2] S. Ueland. Drone Delivery Companies. Practical Commerce URL https://www.practicalecommerce.com/8-commercial-drone-delivery-companies
[3] DRONEII. Drone Energy Sources - Pushing the Boundaries of Electric Flight. DRONEII.com. https://www.droneii.com/drone-energy-sources.
[4] L. R. Jenkinson and J. Marchman. Aircraft Design Projects: For Engineering Students. ButterworthHeinemann, 2003.
[5] S. G. Kee. Guide for Conceptual Helicopter Design. Master's thesis, Naval Postgraduate School, Monterey, California, 1983.
[6] J. M. G. F. Stevens, J. F. Boer, W. F. Lammen, W. J. Vankan, and C. Sevin. Helicopter Pre-design Strategy: Design-to-mass or Design-to-cost? National Aerospace Laboratory NLR, NLR-TP-2009-306, The Netherlands, 2009.
[7] W. Johnson. Helicopter Theory. Dover Publications, 1994.
[8] A. R. S. Bramwell, D. Balmford, and G. Done. Bramwell's Helicopter Dynamics. Elsevier, 2nd edition, 2001.
[9] S. Newman. The Helicopter - Efficiency or Efficacy? Aircraft Engineering and Aerospace Technology, 78(1):15-19.
[11] T. Bingelis. The Fixed Pitch Propeller Dilemma. EAA Sport Aviation. URL https://www.eaa.org/eaa/aircraft-building/builderresources/while-youre-building/building-articles/propellers-and-spinners/the-fixed-pitch-propeller-dilemma
[12] Skyfront. Skyfront Tailwind. URL https://skyfront.com/products/tailwind-drone/
[13] Griff Aviation. Griff 135. URL https://www.griffaviation.com/drones/griff-135/
[14] Dragon Fly. Draganfly Heavy Lift Drone. URL https://draganfly.com/wp-content/uploads/2022/06/Draganfly-Heavy-Lift.pdf
[15] New Atlas. SOAPdrones variable pitch quadcopter uses petrol power for heavy-lifting endurance. URL https://newatlas.com/soapdrones-variable-pitch-multirotor-endurance/48202/
[16] M. J. Cutler. Design and Control of an Autonomous Variable-pitch Quadrotor Helicopter. PhD thesis, Department of Aeronautics and Astronautics, Massachusetts Institute of Technology, 2012. [ Links ]
[17] T. Pang, K. Peng, F. Lin, and B. M. Chen. Towards Long-endurance Flight: Design and Implementation of a Variable-pitch Gasoline-engine Quadrotor. In 12th IEEE International Conference on Control and Automation (ICCA), pages 767-772, 2017.
[18] A. Abhishek, A. Duhoon, M. Kothari, S. L. Kadukar Rane and G. Suryavanshi. Design, Development, and Closed-loop Flight-Testing of a Single Power Plant Variable Pitch Quadrotor Unmanned Air Vehicle. In: Proceedings of the 73rd American Helicopter Society Annual Forum, pages 205-218, 2017.
[19] X. Wu. Design and Development of Variable Pitch Quadcopter for Long Endurance Flight. PhD thesis, Mechanical and Aerospace Engineering, Oklahoma State University, Stillwater, OK, 2018. [ Links ]
[20] A. Abhishek, A. Duhoon, M. Kothari, S. Kadukar, L. Rane and G. Suryavanshi. Design, Development, and Closed-loop Flight-testing of a Single Power Plant Variable Pitch Quadrotor Unmanned Air Vehicle. In Proceedings of the 73rd American Helicopter Society Annual Forum, pages 205-218, 2017.
[21] A. Seeni and P. Rajendran. Analysis of Pressure Coefficient Around Three Airfoils Operating at Different Reynolds Number Using CFD and XFOIL. In Proceedings of International Conference of Aerospace and Mechanical Engineering, Universiti Sains Malaysia, Malaysia, pages 127-137, 20-21 November 2019.
[22] J. Seddon and S. Newman. Basic Helicopter Aerodynamics: An Account of First Principles in the Fluid Mechanics and Flight Dynamics of the Single Rotor Helicopter. Blackwell Science, 2002.
[23] F. J. Bailey, F. B. Gustafson. Charts for Estimation of the Characteristics of a Helicopter Rotor in Forward Flight. I -Profile Drag-Lift Ratio for Untwisted Rectangular Blades. National Advisory Committee for Aeronautics, 1944.
[24] J. Morgado, R. Vizinho, M. A. R. Silvestre, and J. C. Páscoa. XFOIL vs CFD Performance Predictions for High Lift low Reynolds Number Airfoils. Aerospace Science and Technology, 52:207-214, 2016.
[25] I. Berezin, P. Sarkar, and J. Malecki. Fluid-Structure Interaction Simulation. In Recent Progress in Flow Control for Practical Flows: Results of the STADYWICO andIMESCONProjects, pages 263-281, 2017.
[26] M. Drela. XFOIL. MIT. URL https://web.mit.edu/drela/Public/web/xfoil/
[27] R. C. Hibbeler. Engineering Mechanics: Statics and Dynamics. Pearson, 2015.
[28] MATLAB. Polynomial Curve Fitting. URL https://www.mathworks.com/help/matlab/ref/polyfit.html
[29] S. Bell. Analysis of a Rotor Blade System using Blade Element Momentum Theory. URL https://ww2.mathworks.cn/matlabcentral/fileexchange/21994-analysis-of-a-rotor-blade-system-using-blade-element-momentum-theory
Received 11 December 2022
Revised form 14 May 2023
Accepted 5 June 2023
7 Appendix A


8 Appendix B
9 Appendix C
10 Appendix D


