


Serviços Personalizados
Artigo
 Inglês (pdf)
 Artigo em XML
 Referências do artigo
Indicadores

Links relacionados
-
 Citado por Google
 -
 Similares em Google
Compartilhar

 Permalink
Journal of the Southern African Institute of Mining and Metallurgy
versão On-line ISSN 2411-9717
versão impressa ISSN 2225-6253
J. S. Afr. Inst. Min. Metall. vol.124 no.3 Johannesburg Mar. 2024
http://dx.doi.org/10.17159/2411-9717/2638/2024
COMPUTATIONAL MODELLING PAPERS
Near real-time interpolative algorithm for modelling air quality in underground mines
KW. Brown Requist; E. Lutz; M. Momayez
Department of Mining and Geological Engineering, University of Arizona, Tucson, Arizona, USA. ORCID: K.W. Brown Requist: http://orcid.org/0000-0002-5408-5340
SYNOPSIS
As real-time air quality monitoring becomes more prevalent in US underground mines, it is important to provide the highest data reliability with the fewest possible sensors. Real-time sensors remain costly, and these costs are not exclusively financial; the time required to install, calibrate, and maintain real-time sensors poses a large barrier to widespread implementation. Current atmospheric monitoring systems typically rely on displaying point-specific values. This requires operators to infer real-time airborne contamination distributions. Monitoring and control software utilizing mine ventilation network (MVN) solvers has been implemented in limited cases because of their ability to simulate ventilation systems quickly, but these solvers use a one-dimensional representation of the mine, limiting spatial resolution of estimated distributions. Computational fluid dynamics (CFD) has likewise been considered as a means to improve spatial resolution, but processing times prevent its use as a basis for monitoring and control. For the real-time monitoring of airborne contamination distributions, we propose a spatial interpolation method that can estimate the distribution of airborne contaminants in near-real time. This method provides a middle ground between fast processing times and increased spatial resolution. With the use of a pathfinding algorithm and optimization through absolute percentage error minimization, this method outperforms spatial interpolation with a Euclidean distance. By providing contamination distribution information to operators, this method and its derivatives stand to outperform current atmospheric monitoring systems.
Keywords: real-time monitoring, occupational exposure, carbon monoxide, underground mining, mine gases, coal dust.
Introduction
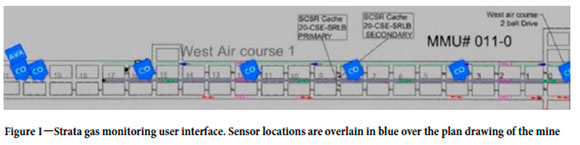
Air quality has long been a concern in underground mines. From the understanding of the role coal dust exposure plays in life-long human health outcomes (Wang and Christiani, 2000; Rogan, 1970; Kissell and Colinet, 1900) to the recent increased concern regarding crystalline silica exposure (Wang and Christiani, 2000; Ziskind, Jones, and Weill, 1976; Holman, 1947), the mining industry has been acutely aware of the importance of a healthy air mixture in underground working areas. The 2006 MINER Act, stemming from the Sago Mine disaster on 2 January 2006, required the US Mine Safety and Health Administration (MSHA) to expand its policies for environmental monitoring in underground mines (United States, 2006). This legislation laid the pathway for a final ruling in 2008, which required underground coal mines to monitor carbon monoxide with sensors that automatically alert and record values and required the training of individuals managing these sensors (US Mine Safety and Health Administration, 2008). Since this ruling, the data from these federally mandated sensors has been extensively warehoused, with minimal further use. Current atmospheric monitoring systems (AMSs) provide methods to display sensor values overlain on a mine plan as in Figure 1, or individual graphs of sensor values over time, but critical information available to these systems is not leveraged.
Sensor networks are costly to install and maintain. These costs are not exclusively monetary, particularly considering federal requirements for routine maintenance. In the USA, underground mines using realtime sensors as part of an AMS must visually inspect the sensors daily, bump test the sensors weekly, and calibrate them monthly (US 30 CFR 75.351). The time spent in calibration and maintenance results in a loss in productivity. Current movements to expand the monitoring and control of ventilation systems have been hindered by the operational and capital costs associated with the monitoring of airborne contamination. The total cost to establish a wireless sensor network can quickly increase with increasing safety ratings, sensor capability, wireless functions, and naturally, the number of sensors. Real-time sensing of airborne particulate matter has proven particularly challenging, with purchase prices for diesel particulate matter (DPM) and dust sensors in the tens of thousands of US dollars (Shriwas and Pritchard, 2020; Halterman, Sousan, and Peters, 2018). Alternatively, wireless electrochemical carbon monoxide sensors are available commercially starting at US$105, but notably these do not meet intrinsically safe requirements for coal mines (Estrada et al., 2019). With the high costs associated with adding more sensors to a mine's AMS, operations opt to use the minimum number of sensors necessary to meet regulatory requirements. In 2018, the largest AMS in the USA consisted of 300 sensors, a notable outlier from the industry average of 38 (Rowland, Harties, and Yuan, 2018).
The cost and time associated with expanding air quality monitoring capabilities in underground mines poses as significant barrier to improved ventilation system monitoring and control. Current AMSs have wide-ranging utility as early warning systems for mine fires in underground coal mines, but offer no currently accepted method to infer the distribution of gases between sensors (Shriwas and Pritchard, 2020). This lack of data ultimately limits the functionality of the AMS; gas distribution data is virtually inaccessible to AMS operators because of the location-specific nature of sensor data.
In general, the issue of estimating distributions between known sensor locations is a solver problem. Methods for estimation are wide-ranging, including deterministic methods like nearest-neighbour and polygonal interpolation and inverse distance weighting, and stochastic methods like ordinary kriging, Bayesian maximum entropy, and sequential Gaussian simulation (Lam, 1983). All of these methods are well documented for the spatial interpolation of distributions between known data-points, but no method has been implemented in any commercially available AMS. This is in part due to current practices with representations of underground ventilation systems and difficulties associated with creating robust statistical relationships between locations that account for changes in mine geometry.
Various solutions and improvements to modern AMSs have been suggested in the literature. Mine ventilation network (MVN) solvers have long been the backbone of modern ventilation system design. MVN software has shown promising results for real-time monitoring and control of mine ventilation conditions. In the late 1990s and early 2000s, a real-time monitoring and control project was started at the Waste Isolation Pilot Plant (WIPP) in New Mexico. This project focused on the use of WIPPVENT, a specially designed MVN software for the WIPP monitoring infrastructure. The WIPP employed pressure and velocity sensors to monitor the flow of air through the mine but (critically) did not include any implementation of air contamination monitoring (Shriwas and Pritchard, 2020; McDaniel and Wallace, 1997; Ruckman and Prosser, 2010). Further implementations of real-time monitoring and control using MVN software have not included air contamination monitoring as a key variable in the assessment or ventilation system control (Gillies et al., 2004; Wu and Gillies 2007).
Importantly, MVN software relies on a one-dimensional network approach. This allows for fast simulation of the ventilation network, making it an ideal candidate for the monitoring and control of air flow within a mine (Sereshki, Saffari, and Elahi, 2016). As a consequence of the one-dimensional approach, variation of contamination estimated using MVN software is only available on the mine entry scale. Because mine entries are represented as vertices of a directional graph, it is not possible to estimate the distribution of airborne contamination within the entry itself. Instead, calculated concentrations apply uniformly as the mean concentration for the entire entry. This poses a similar problem to that seen with traditional AMS systems; the level of data resolution is lower than is useful for the holistic monitoring of contamination within a ventilation system.
Computational fluid dynamics (CFD) has likewise been proposed as a method for improving understanding of contamination distributions in underground mines. CFD can return models with extremely high spatial resolution, but critically struggle with sensitivity to the size of grid used in the simulation and the time required to converge on a stable solution (Mora et al., 2002; Xiang, Wei, and Haibo., 2017). Additionally, CFD cannot model the entire mine with an appropriate grid size in a reasonable time-frame. This, then, requires the creation of several disjointed CFD models in order to simulate the entire mining environment, leading to problems in appropriately modelling boundary and initial conditions for the ventilation system, impacting the accuracy of CFD results compared to experimental observation of mine conditions (Yuan, Zhou, and Smith, 2016). While the spatial resolution of CFD methods is highly desirable for AMSs, the time required to converge on a solution makes these methods unsuitable for real-time monitoring of contamination distributions.
Because current AMSs have no commonly accepted method for the estimation of gas distribution between installed sensors, it is difficult to establish a mine-wide view of airborne contamination. This is especially vital for monitoring and control. While MVN software has shown promise for the monitoring and control of air flow in underground mines, its implementations for contaminants is still problematic. Furthermore, MVN software relies on a one-dimensional network representation of the ventilation system. This means that contamination distributions within mine entries are wholly inaccessible to AMS operators who may choose to use a MVN-based monitoring system in the future. CFD eliminates the issues of resolution, but does so at the expense of calculation time, making it currently unfit for use in real-time monitoring systems.
To improve on current AMSs, a real-time monitoring method should be capable of increasing data resolution by providing estimates of contaminant distribution between sensors. Additionally, the method should be able to run in practically real-time with one-minute temporal resolution. Because of the interrelated nature of airborne contamination from location to location in a mine ventilation system, the use of spatial interpolation of sensed data is a promising avenue to provide a more holistic approach to atmospheric monitoring in underground mines without the need for installation of more sensors.
The real-time estimation of gas distribution in underground mines is limited by the use of a MVN approach. While such approaches are extremely capable of resolving contamination distributions, the lack of spatial resolution makes it difficult to determine the extent of hazardous air conditions, especially within mine entries. We propose a framework for the near real-time spatial interpolation of this data, known as the Near Real-Time Interpolative Measurement (NeaRTIMe) Algorithm. With the use of a pathfinding algorithm, NeaRTIMe attempts to better preserve the effect of air flow in the interpolation of data, which is not feasible with other methods of spatial interpolation. Traditional spatial interpolation methods rely on a Euclidean distance between points as the relevant distance metric. With the use of a pathfinding algorithm, it is possible to encode the interpolation method with a mine's geometry. This allows for distance metrics to be used based on the distance of travel within the mine, rather than assuming constant reduction in concentration through various media like air, rock, and stoppings. By constraining movement to mine entries and measuring the effective distance from entry to entry, this provides an improved confidence in the interpolated contaminant distribution. The pathfinding algorithm runs in pre-processing, allowing for real-time interpolation with minimal computational delays. To further decrease error in the interpolated estimate of contaminant distribution, an optimal power coefficient is determined by minimizing the absolute percentage error as calculated by leave-one-out cross-validation. The use of interpolative modelling methods for atmospheric monitoring in underground mines will allow for time-dependent determination of the source of contamination, enable predictive analysis of contamination behaviour within the mine and provide an avenue for indirect exposure assessment for miners. From data collection to visualization, NeaRTIMe is able to provide site-wide interpolations in under one minute.
Methods
NeaRTIMe is a spatial interpolation algorithm that leverages inverse distance weighting and the A* search algorithm for pathfinding to create an interpolation that respects the geometry of the underground excavation (Hart, Nilsson, and Raphael, 1968). Because this is a spatial interpolation method, the primary information required to arrive at an estimation is the distance between the sensor and the location where airborne contamination is to be estimated. To construct these distance values, information about the mine's geometry and orientation is needed.
The pathfinding algorithm used to calculate distances for spatial weighting of the sensor data requires a set of interior mine points, as well as a set of barriers. This set of barriers comprises air-rock boundaries and air-stopping boundaries. Air-stopping boundaries are generally defined as boundaries between air and non-rock, effectively solid items, such as sealed drifts or crosscuts, or well-sealed doors. Because these boundaries are found in all mines, spatial interpolation of environmental air quality must consider these unique interactions.
In order to to move away from proposed one-dimensional MVN approaches to monitoring, the one-dimensional network model must be updated to a framework that supports higher spatial resolution within mine entries. Concepts like an adjacency matrix are not a feasible option, because adjacency matrices are one-dimensional graphs mapped to a matrix (Ponstein, 1966). This retains the overall one-dimensional nature seen in MVN solvers. The use of a mesh structure like those used in CFD simulations, on the other hand, sacrifices processing time for the sake of spatial resolution. Using an intermediate format would allow for improved spatial resolution without an extreme increase in processing time, making it better suited for real-time atmospheric monitoring. The mine layout must therefore be converted to a rasterized or bitmap image. This image can be created through a variety of methods, the majority of which lie outside the scope of this paper. The method we elected to apply for a two-dimensional air quality analysis in a US underground coal mine utilized AutoCAD 2023 to import a CAD drawing of a section of mine beltway, as shown in Figure 2.
From this imported CAD drawing, pillar, stopping, and excavation boundaries are extracted, yielding a set of distinct lines that may then be converted into points in AutoCAD, as shown in Figure 3. These boundaries can then be overlain with an array of points, creating a network of evenly spaced points within the excavation, not inclusive of points inside pillars or beyond the excavation boundaries, as in Figure 4. The array of points as overlain with AutoCAD represents the mine entries through which air can travel.
These internal points and boundaries are then exported to .csv files, where they are processed in the Julia programming language to create a bitmap image of the mine (Bezanson et al., 2017). This is achieved by rounding the imported point values to the nearest interval. The interval elected for application here is 152 cm (5 feet).
While the goal of NeaRTIMe is to improve the spatial resolution of airborne contamination distribution estimations, it is impractical to use a small scale. Rather, it is better to scale the study area to minimize the number of estimations NeaRTIMe must perform while still providing improved spatial resolution. Scaling the study area is beneficial for two reasons. Primarily, this yields a steep reduction in processing time both in pre-processing of distances used in spatial interpolation and processing of sensor data for spatial interpolation. Additionally, it reduces unnecessary artificial precision. Because individual sensors within an AMS have their own precisions (often 0.1-10 ppm for most gas detection), precision exceeding this threshold is unnecessary and provides a somewhat inaccurate picture of conditions between sensors (Afsb.ar-Mob.ajer et al., 2017). Scaling the area seeks to minimize this creation of artificial precision.
The calculation of distance values for spatial interpolation entails a unique challenge not encountered in most spatial interpolation use cases. Because air quality is the topic of concern, interpolation must focus on distances between points where air flows. This means that standard distance calculations, such as Euclidean distance calculations, as in Equation [1], do not suffice:

where a and b are two vectors representing two n-dimensional points in space and ||b - a|| is the L2-norm (Euclidean norm)
Instead, the A* algorithm can be applied. The A* algorithm is a best-first search algorithm and operates as an extension of Dijkstra's algorithm ,with the use of a heuristic to generate the shortest path between two points while respecting any boundaries between two points (Hart, Nilsson, and Raphael, 1968).
This application of the A* algorithm is especially advantageous; because the A* algorithm calculates a shortest path with respect to any boundaries, it is possible to calculate the shortest path through air between any two points in an underground mine. The use of the A* algorithm ensures that interpolation respects the natural flow of air in the mine, and prevents the interpolation from calculating distances through rock, doors, or stoppings that would otherwise cause an erroneous result.
The A* algorithm seks to minimize the distance between points within a path with the use of a cost function and a heuristic function. Following from Equation [1], the cost function is considered here as the Euclidean distance between the current position and the next position:

This is effectively the distance moved in one step from the current position to a neighbouring position. Likewise, the heuristic function is governed by the distance between the current position and the goal position:

Following Equations [2] and [3], the A* algorithm iteratively creates a path such that:

The length of this path can then be obtained from the number of members in the set of points describing the optimal path. The A* algorithm in this application does not generate a continuous distance, as Euclidean distance calculations do in Equations [1], [2], and [3]. Instead, it counts the number of locations visited along the rasterized path between two locations. This discrete value generated works well for spatial interpolation over the rasterized mine layout. It is important to note that Euclidean distances and A* distances are not inherently interchangeable. The underlying scales of the metrics are different. This means that visual inspection of values attached to a colour scale can show differences in values, but direct comparison of numbers is not a helpful means of determining differences.
As shown in Figures 5 and 6, the average A* distance values tend to bleed horizontally in the centre of the excavation. This spread of average values is noticeably different from the Euclidean distance, which cannot account for stoppings on either side of the centre drift.
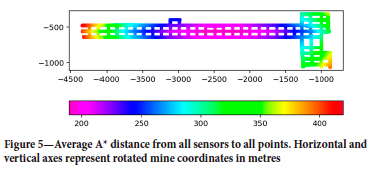
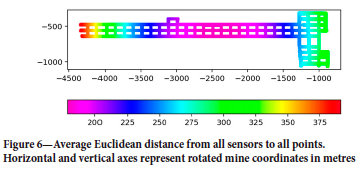
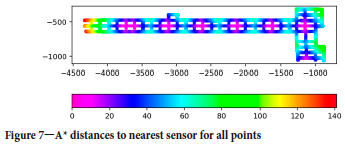
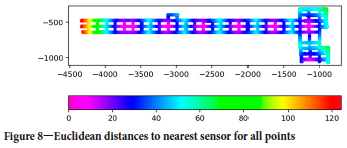
While the visual difference between the two distance metrics is small, the use of A* distances in interpolation with NeaRTIMe provides a meaningful reduction in estimation error. By better accounting for the mine's geometry, spatial relationships between locations within the mine's ventilation system are more realistically preserved than is possible with a Euclidean distance, which may draw its lines through rock or stoppings. This effect is slightly more visible when displaying the minimum distances to sensors within the mine (Figures 7 and 8). The A* distances tend to have curving, subcircular contours, whereas the Euclidean distances tend to preserve horizontal and vertical contours more, due to the orientation of the excavation and placement of sensors.
Spatial interpolation across the underground mine is achieved by inverse distance weighting, which uses the distance from a set of known values to a target (i.e., the output of the A* algorithm) (Shepard, 1968). Inverse distance weighting is predicated on the assumption that values from a known point generally decay with increasing distance from that point. This decay can be generalized as:
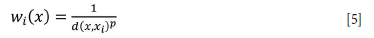
where d is the distance between a known-value location xi and the location to be interpolated, x, and p is the power coefficient describing the rate of decay.
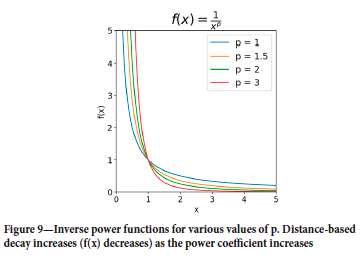
The power coefficient, p, increases the rate of decay for p>0, as shown by graphing the equation f(x) =  with various power coefficients, as in Figure 9.
The value at a point then follows from Equation [5]:
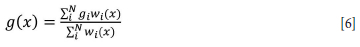
where gi is the value at a known location.
Although a power coefficient of p=2 is commonplace in the application of inverse distance weighting for resource geostatistics, an optimal power coefficient can be determined and used via leave-one-out cross-validation (Babak and Deutsch, 2009). This is advantageous, as various environmental variables may cause nonuniform rates of decay within the mine. These variables can include changes in air flow, changes in temperature and pressure, and individual differences in gas properties.
Optimization of the power coefficient is achieved by minimizing the absolute percentage error as calculated by leave-one-out cross-validation. Error for the interpolated is calculated as:
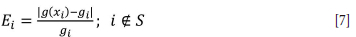
where g(xi) is the calculated value at the known location, gi is the measured value at the known location, and S is the set of all sensor values except those removed for error calculation. This error function does not account for sensors reporting zero; these values are assumed to be at the limit of detection for the sensor, often 0.05-1 ppm, depending on the contaminant (Afshar-Mohajer et al., 2017). Because absolute percentage error is extremely sensitive to differences between true and estimated values when the true value is small, care must be taken to avoid dividing by zero. Using the limit of detection of the sensor can prevent this error. In further implementations, it may be more appropriate to minimize the mean-squared error (MSE) or root-mean standard error (RMSE) to optimize the power coefficient. While MSE and RMSE would be helpful metrics to compare interpolation models where the input data remains constant, comparing various models across changing mine conditions and input concentrations is more difficult, because MSE and RMSE are not directly comparable metrics when the input data changes over multiple successive interpolations. Because of this, we have elected to use absolute percentage error as the current error metric while continuing to compare various interpolation approaches with varying input data.
The error can be calculated with the optimal power coefficient to provide the estimated error for the entire model. This error is minimized to find the optimal power coefficient, as in Equation [8]:
While leave-one-out cross-validation for optimization would be unfit for an interpolation using two or three sensors, underground AMSs generally have an average of 38 sensors, providing an opportunity to better reduce estimated error for the model (Rowland, Harties, and Yuan, 2018).
Results and discussion
Considering a set of concurrent AMS alerts from a portion of an underground room-and-pillar coal mine in Utah, it is possible to use NeaRTIMe to estimate the distribution of carbon monoxide in a portion of the mine, especially in areas between sensors. While the alerts presented here are concurrent, adoption of the NeaRTIMe method would require a departure from the current industry practice of alerting at specific concentrations above the mine's background carbon monoxide concentration. Instead, NeaRTIMe would base interpolation estimates for any sensors above the limit of detection. For commercially available carbon monoxide sensors, this is generally 0.5-1 ppm (Afshar-Mohajer et al., 2017).
Most AMSs display a a visualization output similar to that in Figure 1. Sensor locations are overlain on a mine plan, with popups displaying on the system interface when a sensor in the AMS signals an alert. This yields, at best, a nearest-neighbour assumption of realtime air mixtures available to the AMS operator, most likely without respect to air-barrier interfaces, as in Figure 10. While nearest-neighbour interpolation is possible based on A* distance outputs, this yields no appreciable difference in the resulting visualization and still fails to paint an in-depth picture of most probable air quality conditions.
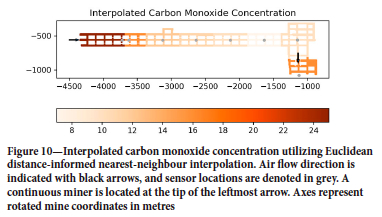
Because nearest-neighbour interpolation is based on the nearest sensor value, lines of demarcation are strikingly apparent between each sensor's radius of influence. Additionally, there is no input of data from other sensors when a point lies entirely constrained by one sensor's radius of influence. This yields a visualization that assumes discrete changes in values from one radius of influence to another, which is naturally not the case when considering the constantly evolving nature of potentially hazardous air mixtures in an underground mine. Interpolation of the sensor data utilizing the A* algorithm, as in Figure 11, creates a much smoother visualization, with minimal demarcation between sensor domains in the study area. This method of interpolation can still be improved. The average error is relatively high, but by adjusting the power coefficient, the interpolation can be optimized to reduce the average error and create a more realistic visualization of air quality conditions.
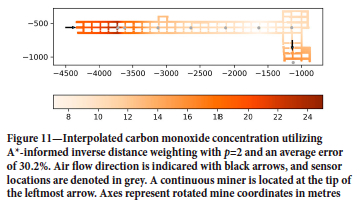
With a power coefficient of p = 2, the average percentage error of the interpolation is 30.2%. By increasing the power coefficient incrementally to reduce the percentage error, an optimized power coefficient of p = 5 is obtained. Because of the nature of optimization via error minimization, power coefficients could range between p = 2 and p = 100 with 0.5-step increments. Upon optimizing the interpolation with p = 5, average percentage error reduces by 9.7%. This yields an interpolation as in Figure 12. Demarcation between sensor domains is noticeable, as in a nearest-neighbour interpolation, but is significantly less prominent. Optimization of this interpolation seeks to equally constrain all sensors; sensors that are further away from an interpolated point have less effect on the resulting value at p = 5 than p = 2. This constraint offers a decrease in error, as well as a better-informed interpolation.
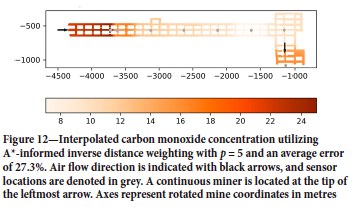
This is most prominent when considering the interpolations in Figures 11 and 12, where the left side of the figure is interpolated to be significantly lower in value in Figure 11 than in Figure 12. At p = 2, the lower sensor value on the right side of the figure has a higher influence on point values than when p = 5, creating artificially depressed values on the left side of the interpolation. Further still, error reduction is visible when considering a linear interpolation, as in Figure 13, compared to an A*-informed interpolation. With an estimated error of 31.5%, NeaRTIMe can achieve a total percentage error reduction of 13.3%. This error reduction is crucial to return a contamination distribution that is as close to real-time mine conditions as possible. As discussed in relation to Figure 9, the power coefficient is related to the rate of decay of concentration from a known location to an unknown location. By optimizing the power coefficient, this assumed rate of decay can be more precisely controlled. This allows for reduced percentage error in the interpolated model as the model begins to reflect the spatial relationships between sensors more accurately. In other words, while a power coefficient of p = 2 may be treated as a default, changing the power coefficient to minimize percentage error will better capture the physical conditions within the mine and return a model with lower error and higher confidence.
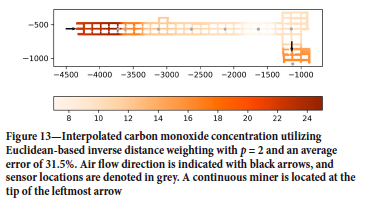
Figures 11, 12, and 13 provide views of different interpolation methods based on a set of concurrent AMS alerts from an active underground coal mine. By extension, the preferred model should return the lowest percentage error as calculated by leave-one-out cross-validation. The optimized interpolated model (Figure 12) is the model that most closely matches the experimental conditions experienced in the mine during the AMS alert period. Obviously, different mines with different equipment operations, mine geometries, and ventilation systems would return different distributions stemming from different input data, with different optimized power coefficients. Further development and verification of the NeaRTIMe method and related approaches is under way to improve model resolution and certainty. Based on inverse distance weighting, NeaRTIMe presumes that the main factor influencing the distribution of airborne contamination is the interaction between a ventilation system and mine geometry in the form of a distance metric. While normal inverse distance weighting typically uses a Euclidean or linear distance, accounting for mine geometry can reduce error in the model. Furthermore, by optimizing the power coefficient, the spatial relationships between input data and estimated values can be more faithfully utilized in interpolation.
An additional aspect of this optimization method is that it permits a greater understanding of the effects of dilution and exhausting. While the figures presented consider a single point in time, air mixtures in underground mines are extremely dynamic. As fresh air enters the excavation at the active face, the resulting contaminated air is exhausted along the beltway. The effects of dilution and exhausting are visible in the right side of both figures, where carbon monoxide remains high as the bulk of the contaminant is exhausted further down the beltway. An additional region of relatively high carbon monoxide is visible on the left side of the figures, which will eventually undergo the same dilution and exhausting processes as the previous bulk of contamination. This raises the point that dilution as a mechanism is only responsible for the location-specific reduction of contaminant concentration. This mechanism does not govern the removal of contamination, but instead describes how contamination in a single area will reduce as fresh air is added. This fresh air does not remain in the same location, so the bulk of the contamination still requires exhausting to physically remove it from the working area. More succinctly, concentration values are reduced at the sensor via dilution (the inclusion of fresh air) but exhausting (the entire or almost-entire replacement of contaminated air with fresh air) remains the physical means of removal of contaminants across the whole excavation.
As a method designed to operate with higher combined spatial and temporal resolution than currently available methods, NeaRTIMe is well suited to visualize the kinematic behaviour of airborne contamination in underground mines. Minute-over-minute, estimations of contamination distribution can be calculated using NeaRTIMe. These estimations can then be plotted and made available for replay by AMS operators. The operator is able to review critical alarm events in a holistic, spatial-visual way rather than relying on a time-stamped record of alerts or a graph for a single sensor. By including the visualization aspect with improved combined spatial and temporal resolution, AMS operators will be afforded a more comprehensive understanding of contamination dynamics within the underground mine than is currently available from AMSs.
The A* pathfinding algorithm is vital for NeaRTIMe's ability to return estimates with higher confidence than other airborne contamination models using inverse distance weighting. While spatial statistical methods like those used in geostatistical resource estimation generally consider relationships along straight lines (Euclidean distances), the use of pathfinding algorithms like Dijkstra's algorithm has been well-documented for cases where spatial relationships vary through a region (Boisvert and Deutsch, 2008; Boisvert, Manchuk, and Deutsch, 2009). The same logic can be applied to the estimation of airborne contamination. Spatial relationships, when considering straight lines drawn through rock and stoppings, fail to properly capture spatial autocorrelation of airborne contamination, increasing the error in the interpolated model, as shown in Figure 13. Instead, the A* algorithm calculates spatial relationships with respect to open mine entries. By preventing the calculation of distances in media separate from mine air, like rock and stoppings, spatial relationships can account for mine geometry and better preserve the effects of air flow in the interpolation.
The A* search algorithm is vital for the spatial interpolation of airborne contamination distributions using NeaRTIMe. Inverse distance weighting requires some distance metric as an indicator of the impact that a known value at a known location has on an estimation location. Because of its ability to resolve paths within airways, rather than requiring that distances be measured through rock and stoppings, the A* algorithm provides an improvement in estimation confidence. Previous methods for spatial interpolation in air typically have used a Euclidean distance for interpolation above ground (Vicedo-Cabrera et al., 2013; Sahu and Mardia, 2005). However, due to the comparatively complex nature of a ventilation system, alternative distance metrics are required. the use of preprocessing for A* distances is highly advantageous; processing of distances with a scale of 152 cm (5 feet) across a study area of approximately 1200 x 300 m requires 7 minutes of processing time when using the Julia programming language. For real-time reporting, this delay is too large to provide a reasonable picture of air quality throughout the study area. Additionally, because of the computational and time complexity of the A* search algorithm, programming languages that utilize just-in-time (JIT) compilers tend to see a sizeable acceleration during A* calculation. This is best evidenced in the use of Julia and Python (Van Rossum and Drake, 2009). Python, being an interpreted language, required an estimated 150 or more days to calculate the A* distances for the same data-set processed in Julia, which uses a JIT compiler.
With pre-processed distances, updates to the geometry only need to be made when the study area has changed significantly. This means that updates to a NeaRTIMe-based AMS would only need to be made as frequently as they currently are with other AMS systems. After the pre-processing of distances, interpolation and optimization, and visualization require approximately 45 seconds in Python to complete, allowing for almost real-time air quality monitoring on a 45-second delay. With optimization, interpolation, and visualization in Julia, we anticipate a moderate reduction in this delay, albeit not as dramatic as the change seen in pre-processing of A* distances.
Current mine ventilation system design programs offer methods for the theoretical modelling of contamination but have limited capabilities for real-time monitoring across the mine footprint (Shriwas and Pritchard, 2020). This is due in part to several factors. One of the largest barriers to real-time analysis is the method used for calculation of these systems. Because MVN software prioritizes calculations for the movement of air, a graph-network approach is used. This is evidenced in the work flow of such programs: discrete sections of the mine are initialized and then connected to other discrete sections to form an (effectively) closed system. These discrete sections are assumed to have uniform properties, such as excavation dimensions, surface roughness, temperature, and humidity. This is an inherent feature of the MVN approach to ventilation system design and monitoring. Because MVN approaches require a one-dimensional representation of the space, there is no means to increase spatial resolution of gas distributions beyond current capabilities. While the one-dimensional approach permits faster simulation, the assumptions of constant conditions within a mine entry limits its ability to provide the clearest possible picture of mine ventilation conditions.
These assumptions create an environment not optimized for the use of experimental or real-time data, because such conditions are constantly changing throughout the discrete sections. For similar reasons, the use of an adjacency matrix to represent the space will not improve the spatial resolution of any model. Because adjacency matrices are one-dimensional directed or indirect graphs mapped to a matrix, the same assumptions must be made - that ventilation conditions within the mine entry remain constant across the entry (Ponstein, 1996; Sereshki, Saffari, and Elahi, 2016). With a rasterized approach like that used by NeaRTIMe, large volumes of discrete points can be individually interpolated, rather than interpolating values at the intersections of the mine excavation and within mine entries. Crucially, this interpolation can provide higher spatial resolution than that available using MVN approaches for contamination monitoring and control, without the extreme processing times required to converge on a solution provided by a CDF simulation. Instead, NeaRTIMe provides an intermediate method for estimation between MVN and CDF methods, while still operating with a time resolution that permits quick action from the AMS operator in the case of a hazardous change in the mine atmosphere.
NeaRTIMe is currently limited by a number of factors. Because NeaRTIMe only considers the location of the value to be estimated and the input sensing data, the resulting interpolation cannot account for additional transport variables, such as temperature and humidity. While NeaRTIMe does not currently consider exogeneous data, expanded sensing capabilities across the mine or additional methods for interpolation may be utilized to create a sound, well-informed modelling method. The application of a multiple input, single output model may positively contribute to a reduction in estimated error for NeaRTIMe or its derivative methods, providing a stable understanding of typical variances encountered in the measurement of additional input variables. Additionally, NeaRTIMe is fundamentally incapable of true real-time sensing. This is limited by the sensing frequency of installed sensors as well as the processing delay time. This delay time can be highly variable from computer to computer, although advances in multithreading may help to reduce this delay at increasing mine scales and higher resolutions.
Conclusion
Real-time carbon monoxide monitoring is rapidly becoming a standard in underground coal mining, and underground metal mines are beginning to adapt this technology for the detection of other contaminants, such as respirable silica. Despite the volume of data available to create meaningful understandings of real-time air mixtures, this data has largely been neglected. Spatial interpolation methods, such as nearest-neighbour interpolation and inverse distance weighting, are powerful tools for creating well-informed snapshots of air quality, with minimal processing delays. Further optimization of the power coefficient used in inverse distance weighting allows AMSs to display more usable data with more confidence than is currently available.
Although required by law, these sensor networks are extremely expensive to operate and maintain. This cost is not only financial - the sensors require scheduled calibration and maintenance that quickly becomes time-intensive with respect to the total number of sensors in the mine requiring servicing. Thus, it is imperative to obtain a comprehensive understanding of air quality conditions within the mine with the fewest sensors possible. Current AMSs cannot achieve this without the incorporation of additional sensors, as the methods used to visualize air quality display only the data at the sensor location. Spatial interpolation seeks to improve data visualization, as well as provide an estimate of values with low error across the mine.
Further work is warranted in the modelling of air quality in underground mines. Most notably, steps should be taken to reduce the estimated error in these models. Likewise, the inclusion of other validation metrics like RMSE and MSE will provide valuable insights into interpolation performance. Inverse distance weighting, by nature, cannot identify minima and maxima that lie outside of the input data. This means that all modelled values within the interpolation are constrained between the minimum and maximum values reported by sensors. In its current state, NeaRTIMe is limited by its interpolation method. With the use of stochastic methods such as ordinary kriging and cokriging, rather than deterministic methods like nearest-neighbour and inverse distance weighting, NeaRTIMe would permit the inclusion of exogenous factors like air velocity, humidity, and temperature (Pan et al., 1993). The combination of these variables in an interpolation model would most likely have a significant impact on estimation error while also returning a distribution of the estimate rather than a point estimate.Ordinary kriging has shown promise for the real-time monitoring of underground gas distributions, with the added benefit of improved quantification of uncertainty for each estimate rather than the estimated distribution as a whole. Work is ongoing to develop a pathfinding algorithm that will account for the flow of air within the mine, which should improve the quality of estimates with NeaRTIMe. The addition of other exogeneous factors will be vital to improved monitoring because of their impact on the fate and transport behaviours of airborne contaminants. Additionally, further work is required to reduce the total delay from data collection to visualization. Methods for error and delay reduction would also provide opportunities for the analysis of fate and transport mechanisms within the mine, allowing AMS operators and ventilation-on-demand systems to detect and mitigate potentially harmful conditions.
The NeaRTIMe algorithm seeks to lay a framework for air quality monitoring and modelling utilizing interpolative methods to create a realistic representation of real-time air quality across an entire mine. Leave-one-out cross-validation allows for the optimization of the power coefficient for interpolation, minimizing the percentage error of the interpolation. With the use of the A* pathfinding algorithm to inform inverse distance weighting, air-rock boundaries can be respected while performing spatial interpolation. Although this pathfinding process is computationally intensive, the use of the Julia programming language in conjunction with pre-processing of distances prior to data collection, interpolation and optimization, and visualization reduces delays to below one minute from data collection to visualization. NeaRTIMe provides a simple numerical approach to the modelling of air quality data with few inputs. While this method cannot account for minima or maxima in the data between sensors, the use of optimization as a means of error reduction stands to provide a more reliable estimate of local airborne contamination distribution based on location-specific air quality monitoring data. As air quality continues to be a major concern in underground mines, the methods used for daily and real-time monitoring should be mathematically and computationally feasible to increase the amount of actionable data available to AMS operators.
Acknowledgements
Research reported in this publication was supported by the National Institute of Occupational Safety and Health (NIOSH) under award number U60OH012351.
The data-set utilized was provided by Bronco Energy's Emery underground coal mine in Emery, Utah, USA. We would like to express special thanks to the Emery mine and its health and safety and technical services teams for their aid in the development of NeaRTIMe with the use of their data.
CRediT Author Statement
Author 1: Conceptualization, Methodology, Software, Validation, Writing - Original draft preparation. Author 2: Resources, Supervision, Writing - Review & Editing, Funding Acquisition. Author 3: Supervision, Writing - Review & Editing, Funding Acquisition.
References
Afshar-Mohajer, N., Zuidema, C., Sousan, S., Hallett, L., Tatum, M., Rule, A.M., Thomas, G., Peters, T., and Koehler, K. 2017. Evaluation of low-cost electrochemical sensors for environmental monitoring of ozone, nitrogen dioxide and carbon monoxide. Journal of Occupational and Environmental Hygiene, vol. 15, no. 2. pp. 87-98. https://doi.org/10.1080/15459624.2017.1388918 [ Links ]
Babak, O. and Deutsch, C.V. 2009. Statistical approach to inverse distance interpolation. Stochastic Environmental Research and Risk Assessment, vol. 23. pp. 543-553. https://doi.org/10.1007/s00477-008-0226-6 [ Links ]
Bezanson, J., Edelman, A., Karpinski, S., and Shah, V.B. 2017. Julia: A fresh approach to numerical computing. Society for Industrial and Applied Mathematics Review, vol. 59, no. 1. pp. 65-98. https://doi.org/10.1137/141000671 [ Links ]
Boisvert, J.B. and Deutsch, C.V. 2008. Kriging in the presence of LVA using Dijkstra's algorithm. Centre for Computational Geostatistics, University of Alberta. https://www.ccgalberta.com/ccgresources/report10/2008-110_lva_kriging_dijkstra.pdf [ Links ]
Boisvert, J.B., Manchuk, J.G., and Deutsch, C.V 2009. Kriging in the presence of locally varying anisotropy using non-Euclidean distances. Mathematical Geosciences, vol. 41. pp. 585-601. http://doi.org/10.1007/s11004-009-9229-1 [ Links ]
Estrada, E., Moreno, M., Martin, K., Meyer, Á. L., Rodrigo, P. M., and Gutierrez, S. 2019. Low cost CO detector integrated with IoT. Proceedings of the 2019 Institute of Electrical and Electronics Engineers International Conference on Engineering Veracrus (ICEV), Institute of Electrical and Electronics Engineers, Boca del Rio, Mexico. http://doi.org/10.1109/ICEV.2019.8920567 [ Links ]
Gillies, A.D.S, Wu, H.W., Tuffs, N., and Sartor, T. 2004. Development of a real time airflow monitoring and control system. Proceedings of the 10th US/North American Mine Ventilation Symposium. Ganguli, R. and Bandopadhyay, S. (eds), Taylor and Francis, London. pp. 145-155. [ Links ]
Halterman, A., Sousan, S., and Peters, TM. 2018. Comparison of respirable mass concentrations measured by a personal dust monitor and a personal DataRAM to gravimetric standards. Annals of Work Exposures and Health, vol. 62, no. 1. pp. 62-71. http://doi.org/10.1093/annweh/wxx083 [ Links ]
Hart, P.E., Nilsson, N.J., and Raphael, B. 1968. A formal basis for the heuristic determination of minimum cost paths. Institute of Electrical and Electronics Engineers Transactions on Systems Science and Cybernetics, vol. 4, no. 2. pp. 100-107. https://doi.org/10.1109/TSSC.1968.300136 [ Links ]
Holmann, T. 1947. Historical relationship of mining, silicosis, and rock removal. British Journal of Industrial Medicine, vol. 4, no. 1. pp. 1-29. http://dx.doi.org/10.1136/oem.4.1.1 [ Links ]
Kissell, F.N. and Colinet, J.F. 1900. Control Of Respirable Dust-Lung Diseases of Miners. https://stacks.cdc.gov/view/cdc/8625 [ Links ]
Lam, N.S.N. 1983. Spatial interpolation methods: A review. American Cartographer, vol. 10, no. 2. pp. 129-150. https://doi.org/10.1559.152304083783914958 [ Links ]
McDaniel, K.H. and Wallace, K.G. 1997. Realtime mine ventilation simulation. US Office of Scientific and Technical Information. http://doi.org/10.2172/515492 [ Links ]
Mora, L., Gadgil, A.J., Wurtz, E., and Inard, C. 2002. Comparing zonal and CFD model predictions of indoor airflows under mixed convection conditions to experimental data. Proceedings of the 3rd European Conference on Energy Performance and Indoor Climate in Buildings. https://www.aivc.org/sites/default/files/members_area/medias/pdf/Conf/2002/118_060%20Mora.pdf [ Links ]
Pan, G., Gaard, D., Moss, K., and Heiner, T. 1993. A comparison between cokriging and ordinary kriging: Case study with a polymetallic deposit. Mathematical Geology, vol. 25. pp. 377-398. https://doi.org/10.1007/BF00901424 [ Links ]
Ponstein, J. 1966. Self-avoiding paths and the adjacency matrix of a graph. SIAM Journal on Applied Mathematics, vol. 14, no. 3. pp. 600-609. [ Links ]
Rogan, J. 1970. Coalworkers' pneumoconiosis: A review. Journal of Occupational Medicine, vol. 12, no. 8. pp. 321-324. http://www.jstor.org/stable/45001381 [ Links ]
Rowland, J.H., Harties, S.P., and Yuan, L. 2018. A survey of atmospheric monitoring systems in U.S. underground coal mines. Mining Engineering, vol. 70, no. 2. pp. 37-40. http://doi.org/10.19150/me.8058 [ Links ]
Ruckman, R. and Prosser, B. 2010. Integrating ventilation monitoring sensor data with ventilation computer simulation software at the Waste Isolation Pilot Plant facility. Proceedings of the 13th US/North American Mine Ventilation Symposium Hardcastle, S. and McKinnon, D.L. (eds) MIRARCO, Sudbury, ON. pp. 237-242. [ Links ]
Sahu, S.K. and Mardia, K.V. 2005. A Bayesian kriged Kalman model for short-term forecasting of air pollution levels. Journal of the Royal Statistical Society, vol. 54, no. 1. pp. 223-244. doi: 10.1111/J.1467-9876.2005.00480 [ Links ]
Sereshki, F., Saffari, A., and Elahi, E. 2016. Comparison of mathematical approximation methods for mine ventilation network analysis. International Journal of Mining Science, vol. 2, no. 1. pp. 1-14. [ Links ]
Shepard, D. 1968. A two-dimensional interpolation function for irregularly-spaced data. Proceedings of the 1968 23rd Association for Computing Machinery. Association for Computing Machinery, New York. pp. 517-524. https://doi.org/10.1145/800186.810616 [ Links ]
Shriwas, M. and Pritchard, C. 2020. Ventilation monitoring and control in mines. Mining, Metallurgy & Exploration, vol. 37. pp. 1015-1021. http://doi.org/10.1007/s42461-020-00231-8 [ Links ]
Trolex. 2022. Strata. https://trolex.com/product/strata [accessed 4 February 2023]. [ Links ]
US Mine Safety and Health Administration. 2008. Flame-Resistant Conveyor Belt, Fire Prevention and Detection, and Use of Air From the Belt Entry. 73 F.R. 80579, to be codified at 30 C.F.R parts 6, 14, 18, 48 and 75. [ Links ]
United States 30TH Code of Federal Regulations 75.351. Atmospheric Monitoring Systems. https://www.ecfr.gov/current/title-30/chapter-I/subchapter-O/part-75/subpart-D/section-75.351 [ Links ]
United States. 2006. Mine Improvement and New Emergency Response Act of 2006. 109 P.L. 236, 120 Stat. 493. Enacted S2803. [ Links ]
Van Rossum, G. and Drake, F.L. 2009. Python 3 reference Manual. CreateSpace, Scotts Valley, CA. [ Links ]
Vicedo-Cabrera, A., Biggeri, A., Grisotto, L., Barbone, F., and Catelan, D. 2013. A Bayesian kriging model for estimating residential exposure to air pollution of children living in a high-risk area in Italy. Geospatial Health, vol. 8, no. 1. pp. 87-95. doi: 10.4081/gh.2013.57 [ Links ]
Wang, X.R. and Christiani, D.C. 2000. Respiratory Symptoms and functional status in workers exposed to silica, asbestos, and coal mine dusts. Journal of Occupational and Environmental Medicine, vol. 42, no. 11. pp. 1076-1084. http://www.jstor.org/stable44995772 [ Links ]
Wu, H.W. and Gillies, A.D.S. 2005. Real-time airflow monitoring and control within the mine production system. Proceedings of the 8th International Mine Ventilation Congress. Gillies, A.D.S. (ed.). Australasian Institute of Mining and Metallurgy, Melbourne. pp. 383-389. [ Links ]
Xiang, Z., Wei, Y., and Haibo, H. 2017. Computational grid dependency in CFD simulation for heat transfer. Proceedings of the 8th International Conference on Mechanical and Aerospace. doi: 10.1109/ICMAE.2017.8038641 [ Links ]
Yuan, L., Zhou, L., and Smith, A.C. 2016. Modeling carbon monoxide spread in underground mine fires. Applied Thermal Engineering, vol. 100. pp. 1319-1326. https://doi.org/10.1016/j.applthermaleng.2016.03.007 [ Links ]
Ziskind, M., Jones, R.N., and Weill, H. 1976. Silicosis. American Review of Respiratory Disease, vol. 113, no. 13. pp. 643-665. https://doi.org/10.1164/arrd.1976.113.5.643 [ Links ]
 Correspondence:
K.W. Brown Requist
Email: katebrown@arizona.edu
Received: 20 Feb. 2023
Accepted: 22 Mar. 2024
Published: March 2024

