


Services on Demand
Article
 English (pdf)
 Article in xml format
 Article references
Indicators

Related links
-
 Cited by Google
 -
 Similars in Google
Share

 Permalink
Journal of the Southern African Institute of Mining and Metallurgy
On-line version ISSN 2411-9717
Print version ISSN 2225-6253
J. S. Afr. Inst. Min. Metall. vol.123 n.2 Johannesburg Feb. 2023
http://dx.doi.org/10.17159/2411-9717/2425/2023
PROFESSIONAL TECHINICAL AND SCIENTIFIC PAPERS
The necessity of 3D analysis for open-pit rock slope stability studies: Theory and practice
A. McQuillan; N. Bar
iGecko Geotechnics, St Vincent and the Grenadines, Australia. ORCID: A. McQuillan: http://orcid.org/0000-0002-1645-6497; N. Bar: http://orcid.org/0000-0001-7948-2468
SYNOPSIS
Geotechnical models developed during the planning stages of open pit mines are three-dimensional so as to capture the spatial variation in lithological, structural, hydrogeological, and geomechanical conditions. Geological models that describe the lithological and structural (faulting and folding) characteristics of a deposit are always 3D. Likewise, boreholes and piezometers used to develop geomechanical properties and groundwater models are drilled at spatial offsets across the deposit to understand the lateral and vertical characteristics. Yet when geotechnical analysis is completed, often the three-dimensional geological, hydrogeological, and structural models as well as geometrically complex 3D mine designs for optimizing economic mineral recovery and overburden removal are simplified to two-dimensional sections. In this paper we demonstrate that this simplification can lead to the wrong failure mechanism being identified, analysed, and/or a conservative factor of safety being calculated and hence an over-estimation of slope stability. Through case studies we show how three-dimensional analysis methods are more suited to rock slopes, particularly those with anisotropic material strength, when singularities such as geological faults are present, and nonlinear slope geometry. When the same slopes are analysed in two dimensions, the failure mechanism calculated is often fundamentally incorrect. The case studies further reveal that the factor of safety calculated in three dimensions is not always higher than the two-dimensional factor of safety.
Keywords: slope stability, 3D, limit equilibrium, finite element, open pit, rock mechanic.
Introduction
Several methods exist to analyse slope stability. Available methods can be broadly categorized into empirical, kinematic, limit equilibrium (LE), and numerical methods. Stability analyses can further be calculated in two dimensions (2D) or three dimensions (3D) using deterministic and/or probabilistic inputs. All of these methods have their advantages and limitations.
Of the available methods, 2D LE analysis is traditionally the most widely applied to slope stability, with stability being assessed and reported in terms of a factor of safety (FOS) (McQuillan, Canbulat, and Oh, 2020).
In this paper we demonstrate the variation in FOS calculated between 2D and 3D slope stability analysis methods. Through case studies, it is shown how 3D analysis methods are more suited to rock slopes, particularly those with anisotropic material strength and nonlinear slope geometry. When analysing the same slopes in 2D, the failure mechanism calculated is fundamentally incorrect. The case studies presented further demonstrate that the 3D FOS is not always higher than the 2D FOS. The only way to determine the 3D FOS with confidence is to analyse the scenario in true 3D, not by applying a rule of thumb or assuming a general percentage increase to 2D FOS.
If the slope under investigation includes any of the following features, 3D stability analysis should be included in the geotechnical design review process.
i. Nonlinear slope geometry (Bar and Weekes 2017, Dana et al., 2018)
ii. Spatially or laterally varying geological and hydrogeological conditions
iii. Spatially varying material strengths, including anisotropic material behaviour in the same unit
iv. Singularities and persistent geological structures, striking and intersecting up to 50° from the slope orientation (McQuillan et al., 2018)
v. Highly variable 2D results within close spatial proximity to each other (Bahsan and Fakhriyyanti, 2018; Chakraborty and Goswami, 2021).
The recommendation of 3D analysis is not limited to 3D LE and 3D numerical analysis. Empirical methods that consider the 3D geometry of slope stability can be just as valuable (Romana, 1993; McQuillan et al., 2018).
3D modelling for slope stability analysis
3D LE analysis methods were first presented in 1969 (Anagnosti, 1969). Kalatehjari and Ali (2013) provide a summary of the development and application of 3D LE analysis from Anagnosti's (1969) publication through to the developments in the early 2010s. Dana et al. (2018) further provide a summary of the developments of 3D slope stability analysis methods (LE and FE) from the 1960s to 2010s and comment on how the different methods affect stability results.
To have confidence in the results of 2D or 3D models, validation should be completed with a fundamentally different type of analysis (e.g. finite element, finite difference). Similarity in results between methods should increase confidence in the results of either analysis method (Ugai and Leshchinsky, 1995; Kainthola et al., 2013).
Results of 3D modelling should also be validated against the known behaviour of slopes. Recent examples of 3D back-analysis of excavated slopes with complex failure mechanisms are presented for Venetia diamond mine (Bar et al., 2022a), Bingham Canyon copper mine (Telfer and Schumacher, 2022), and Pueblo Viejo gold mine (Bar et al., 2022b).
Case studies
Three case studies are presented to demonstrate real-world examples of the following scenarios.
i. Simplifying real-world geometry to a 2D section does not model the true failure mechanism, and results in a mechanistically incorrect analysis of the slope under investigation.
ii. 3D analysis does not always result in a higher stability factor, especially where the slope under investigation has variable surface geometry and sub-surface geology
iii. Analysing the slope using two different methods, 3D LE and 3D FE, can be useful to validate predicted failure mechanisms and stability factors.
The case study sites exhibit the following conditions:
i. Nonlinear slope geometry.
ii. Anisotropic material behaviour, including singularities (bench-scale geological structures) intersecting the slope excavation at acute angles.
3D LE (Slide3), 3D FE (RS3), 2D LE (Slide2), and 2D FE (RS2) modelling software from Rocscience, Inc (2022) were used to calculate the 3D and 2D FOS and SRF respectively.
Case study 1
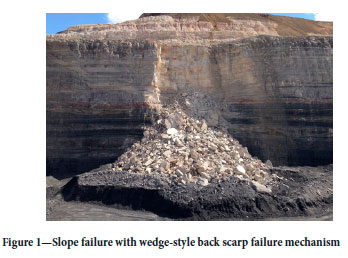
Case study 1 presents an example of where simplifying slope conditions to 2D results in a mechanistically incorrect analysis of the real-world problem. Case study 1 is sourced from an open-cut coal mine and features a near-90° elbow in the slope design. The multi-bench slope is excavated using truck and shovel operations for the weathered horizon, and dragline operations for the main pass horizon down to the target coal seams. The weathered horizon consists primarily of a matrix-cemented coarse sandstone. The main pass overburden is interbedded sandstone and siltstone. Persistent bench-scale joints are present in the main pass highwall, with joint sets oriented 87°/169° and 87°/093° (dip/dip direction). The intersection of these sets contributed to a wedge-mechanism slope failure (Figure 1). The stability of the main pass highwall is assessed using 3D LE analysis to show the limitations of 2D analysis for this type of 3D failure mechanism and slope geometry.
In Slide3, joints can be accommodated in the slope stability calculation as either a ubiquitous material model (e.g. Generalised Anisotropic function) or as explicit joints (e.g. Weak Layer function). This model applies explicit joint orientations as measured from post-failure field survey (McQuillan and Guy 2022). Material properties applied are summarized in Table I.
Results of this analysis method are displayed in Figure 2. A critical FOS of 0.78 is calculated. The failure mechanism is predicted to be sliding along the subvertical joint planes and shear through the rock mass at the base of the critical slip surface. As the joints applied in this model are true to their actual field location, the model is indicating that failure at this measured intersection of joint sets is possible (i.e. FOS < 1) and risk management strategies should be applied. Controls may include exclusion zones based on the critical failure surface volume (or volume of failure surface with FOS < 1.0), which are readily calculated using 3D analysis.

The modelled failure mechanism in Figure 2 is three-dimensional. For comparison, multiple 2D sections were cut through the critical failure surface to show the difference in FOS between 2D and 3D analysis methods. Sections were cut at the intersection of the two joints, and then either side of this central section. Results of the 2D LE analysis for each 2D section are presented in Figure 3.
Simplifying this wedge failure mechanism to a 2D problem (i.e. by cutting a section through the line of intersection of the two joints) results in a FOS of 0.63, section B. This is less than the FOS of 0.78 calculated using 3D methods, but is not directly comparable as the mechanics and forces in the 2D and 3D models are different. Most critically, simplifying to a 2D section for analysis does not represent the actual failure mechanism realized by the intersection of the two persistent geological structures.
Where sections are cut either side of the line of intersection of the two joint sets, these sections similarly result in a lower FOS than the 3D analysis, and are again not representative of the real mechanics and forces involved in the failure that will form at the intersection of the two joints. If such conditions exist, 2D analysis is not suitable for slope stability analysis, as 2D analysis is modelling apparent dip and dip direction only.
Case study 2
Case study 2 presents a situation where the 3D SRF is lower than the 2D SRF. The study is representative of a mine waste dump being extended over natural mountainous topography to take advantage of a short haul-dump circuit. The natural slope geometry consists of competent bedrock material, below an approximately 10 m layer of colluvium soil. Material properties applied to 3D FE modelling are summarized in Table II. Dump design and slope dimensions are illustrated in Figure 4. Dump stability was assessed using 3D FE methods.
In case study 2, both the downslope and cross-slope natural topography vary significantly, leading to a situation where the local 2D conditions resulted in lower shear stresses than the combined 3D section of the slope that the dump was to be constructed over. This resulted in the 3D SRF being lower than the 2D sections cut through the same section of slope.
A comparison of SRFs calculated from 3D FE and 2D FE analysis, at four different locations across the dump design is summarized in Figures 5 and 6. In three of the four 2D sections analysed the critical SRF was equal to or greater than the 3D SRF.

Case study 3
Case study 3 shows an example of how 3D FE analysis can be used to validate the results of 3D LE analysis. The study is representative of a mine waste dump of relatively low strength material. A portion of the dump is constructed over a residual mud pile. The stability of the waste dump is evaluated using 3D LE and 3D FE analysis. Applied material properties are summarized in Table III.
The 3D LE analysis results are presented in Figures 7 and 8. The critical FOS is 2.24, with the critical slip surface sliding through the ponded mud at the base of the dump. Another low FOS and larger slip surface, also sliding through the ponded mud, is identified with a FOS of 2.39.
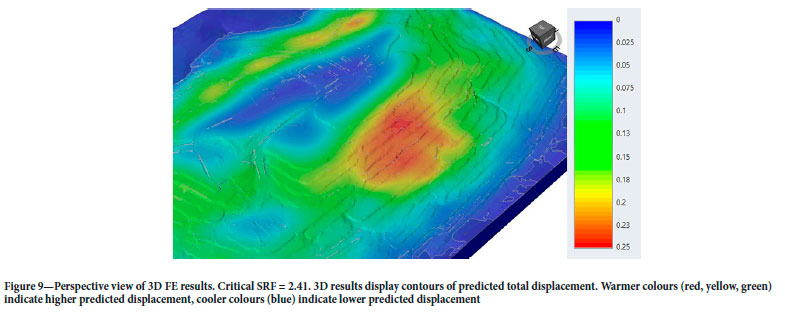
The results of 3D FE analysis are presented in Figures 9 and 10. A critical SRF (Hammah et al., 2005) of 2.41 was calculated. Maximum shearing is modelled to occur primarily through the mud pile at the base of the dump. A difference of 17% was observed between the 3D FE critical SRF and 3D LE critical FOS. However, a comparison of the results of 3D LE (Figures 7, 8) and 3D FE (Figures 9, 10) shows that there is reasonable correlation between the results of these different methods, as regards both the size and location of predicted shearing and displacement. A lower critical SRF is expected with finer mesh settings (Bahsan and Fakhriyyanti, 2018; Dana et al., 2018) and 10-noded elements applied. A 5 m, 4-noded element, graded mesh was applied to this case study.
Discussion
Case study summary
The three case studies show the advantages of 3D stability analysis and limitations of 2D stability analysis.
The case studies have demonstrated that for slopes with (i) 3D failure mechanisms, resulting from anisotropic material strength and/or persistent geological structure and (ii) slopes with nonlinear slope geometry, 3D analysis methods provide a more realistic evaluation of the failure mechanism and estimate of failure volume, and as such provide a more realistic FOS and subsequent indication of risk to an operation.
For the first slope case involving a critical sliding surface along persistent geological structure (bench-scale joints), comparison with 2D stability methods showed that the 2D FOS is lower. However, the 2D analysis does not accurately model the failure mechanisms in play, and the validity of the 2D FOS for assessing these types of slope stability problems is discounted.
The second case study presented a scenario where the 3D SRF is lower than the 2D SRF. Such cases, where the 3D FOS is lower than the 2D FOS, are generally rare and more difficult to predict. This case demonstrates that the only way to truly understand the difference in 2D and 3D stability factors is to assess both scenarios.
The third case study provided an example where FE analysis can be used to validate the results of LE analysis in both two and three dimensions, by comparing both the location of the critical failure surface and the critical FOS (or SRF). This validation process ensures a robust geotechnical review of slope stability by applying two different analysis methods to evaluate stability. In this third case study good correlation between 3D LE and 3D FE critical slip surface results was observed.
3D LE and 3D FE analysis both have their advantages and limitations. The selection of LE or FE, in 2D or 3D, should depend on: (i) slope geometry; (ii) predicted failure mechanism; and (iii) required accuracy of the stability analysis..
Reliability of 3D analysis
The accuracy of 3D FOS (or 3D SRF) analyses should be regarded with caution if (i) material strengths back-analysed using 2D methods are applied to 3D models; and (ii) if the 3D model is highly laterally constrained. These considerations are discussed further below.
Where 2D models have been applied for decades, the strength parameters have typically been based on the back-analysis of 2D sections. It is critical to note that back-analysed 2D material properties cannot be explicitly applied to 3D models without rigorous validation. Back-analysed 2D parameters are based on plane strain conditions and are generally higher than actual, which will lead to an unconservative overestimation of material strength (Stark and Eid, 1998; Arellano and Stark, 2000; Griffiths and Marquez, 2007; Saeed, Maarefvand, and Yaaghubi, 2015; Pyke, 2017; Cala et al., 2020; McQuillan and Guy 2022). If 2D back-analysed parameters are applied to 3D forward analyses, the resulting FOS will likely be higher than the actual FOS (Lu, Fredlund, and Fredlund, 2013).
However, in a scenario where 3D back-analysed material strengths are not available (e.g. either limited in the literature or when initially transitioning to 3D analysis), engineers can apply back-analysed 2D values but should then interpret the results as relative indicators of slope instability until 3D back-analysis can be completed to determine representative material strengths. Relative stability can be determined by identifying the sections of slope with the lowest FOS, regardless of the absolute value of FOS calculated
(McQuillan and Guy, 2022).
Material parameters suitable for 3D analysis can be determined from the downgrading (or upscaling) of laboratory data using empirical methods (e.g. Hoek and Brown, 2018), or back-analysed using known-performance slope geometry and reconciling to observed slope movement. Examples of such back-analysis are presented by Saeed, Maarefvand, and Yaaghubi, (2015), Bar et al. (2019, 2020, 2021), Bar and Dixon (2021), and Figueiredo et al. (2021).
It is also important in the 3D modelling process to ensure that the model is not constrained laterally. 3D models that are highly laterally constrained will produce a higher, unrealistic FOS than longer, laterally unconstrained 3D models. Examples of this behaviour are given by McQuillan, Bar, and Yacoub (2021) and Hammah and Awuku-Asabere (2021), and described by Ugai and Leshchinsky (1995) and Griffiths and Marquez (2007).
Conclusion
The calculation of FOS is fundamental to geotechnical design review and acceptance criteria. To adequately calculate the FOS, geotechnical engineers need to representatively model slope geometry, geology, material strength, groundwater conditions, and structural conditions, all of which inherently vary in 3D. Three-dimensional slope stability analysis is the only way to truly represent spatially varying slope geometry, geology, material strengths, and structural and hydrogeological conditions, particularly where material strengths are anisotropic, or persistent geological structures are present and aligned at angles acute to the slope orientation.
Although more often than not, FOS values obtained from 3D analysis will be higher than with 2D analysis, black swan cases exist where the 3D FOS (or SRF) is lower than the 2D FOS (or SRF). Such cases are difficult to predict without analysing in both 2D and 3D. Combinations of analysis (i.e. 3D LE and 3D FE) are always recommended to validate model results.
References
Anagnosti, P. 1969. Three dimensional stability of fill dams. Proceedings of the 7th International Conference on Soil Mechanics and Foundation Engineering, Mexico City. Sociedad Mexicana de Mecánica, pp. 275-280. [ Links ]
Arellano, D. and Stark, T. 2000. Importance of three-dimensional slope stability analysis in practice. Proceedings of Slope Stability 2000, Reston, VA: ASCE. pp. 18-32. [ Links ]
Bahsan, E. and Fakhriyyanti, R. 2018. Comparison of 2D and 3D stability analyses for natural slope. International Journal of Engineering and Technology, vol. 7, no. 4.35. pp. 662-667. [ Links ]
Bar, N. and Weekes, G. 2017. Directional shear strength models in 2D and 3D limit equilibrium analyses to assess the stability of anisotropic rock slopes in the Pilbara region of Western Australia. Australian Geomechanics Journal, vol. 52, no. 4.pp. 91-104. [ Links ]
Bar, N., Ryan, C., Yacoüb, T., McQuillan, A., Coli, N. Leoni, L., Harries, N., Bu, J., Rea, S., and Pano, K. 2019. Integration of 3D limit equilibrium models with live deformation monitoring from interferometric radar to identify and manage slope hazards. Proceedings of the 14th International ISRM Congress on Rock Mechanics and Rock Engineering, Foz do Iguassu, Brazil. CRC Press. [ Links ]
Bar, N., Kostadlnovski, M., Tucker, M., Byng, G., Rachmatullah, R., Maldonado, A. Põtsch, M., Gaich, A., McQuillan, A., and Yacoüb, T. 2020. Pit slope failure evaluation in near real time using UAV photogrammetry and 3D limit equilibrium analysis. Australian Geomechanics, vol. 55, no. 2. pp. 33-47. [ Links ]
Bar, N., Arrieta, M., Espino, A., Diaz, C., Mosquea, L.A., Mojica, B., McQuillan, A., Baldeon, G., and Falorni, G. 2021. Back-analysis of ductile slope failure mechanisms and validation with aerial photogrammetry, InSAR and GbRAR to proactively manage economic risks to protect the mine plan. Proceedings of RIC2021, Toronto, Canada. Taylor & Francis. pp. 512-526. [ Links ]
Bar, N. and Dixon, R. 2021. Unveiling unknowns: Practical application of InSAR for slope performance monitoring and risk management across multiple surface mines. Engineering Geology, vol. 293, no. 4. 12 pp. https://doi.org/10.1016/j.enggeo.2021.106326 [ Links ]
Bar, N., McQuillan, A., Ndlovu, X., and de Graaf, P. 2022a. Three-dimensional slope stability analysis for late-stage slope design optimization options trade-off studies at Venetia diamond mine. Proceedings of Slope Stability 2022, Tucson, AZ. https://www.researchgate.net/publication/364357906_Three-Dimensional_Slope_Stability_Analysis_for_Late-Stage_Slope_Design_Optimization_Options_Trade-off_Studies_at_Venetia_Diamond_Mine/link/634f79f28d4484154a1669f7/download [ Links ]
Bar, N., Mojica, B., Cobian, J.C., Bautista, M., Hammah, R., McQuillan, A., Yacoüb, T., Gaich, A., Potsch, M., Coli, N., and Preston, C. 2022b. Cumba pit slope failure: A technical review. Proceedings of Slope Stability 2022, Tucson, AZ. https://www.researchgate.net/profile/N_Bar/publication/364358037_Cumba_Slope_Failure_A_Technical_Review/links/634f76426e0d367d91a98440/Cumba-Slope-Failure-A-Technical-Review.pdf [ Links ]
Cala, M., Cyran, K., Jakobczyk, J., and Kowalski, M. 2020. The challenges of open-pit mining in the vicinity of the salt dome (Belchatow lignite deposit, Poland). Energies, vol. 13. doi:10.3390/en13081913 [ Links ]
Chakraborty, A. and Goswami, D. 2021. Three-dimensional (3D) slope stability analysis using stability charts. International Journal of Geotechnical Engineering, vol. 15, no. 5. pp. 624-649. doi: 10.1080/19386362.2018.1465743 [ Links ]
Dana, H., Kakaie, K., Rafiee, R., and Bafghi, A. 2018. Effects of geometrical and geomechanical properties on slope stability of open-pit mines using 2D and 3D finite difference methods. Journal of Mining & Environment, vol. 9, no. 4. pp. 941-957. [ Links ]
Figueiredo, L., Barros, M., Hammah, R., Santos, Y.. Souza, T., and Nogueira, C. 2021. Case study: open pit three-dimensional slope stability back-analysis for an anisotropic iron ore rock mass. Proceedings of SSIM2021, Perth. Australian Centre for Geomechanics. pp. 107-120. doi:10.36487/ACG_repo/2135_04 [ Links ]
Griffiths, D. and Marques, R. 2007. Three-dimensional slope stability analysis by elasto-plastic finite elements. Geotechnique. vol. 57, no. 6. pp. 537-546. doi: 10.1680/geot.2007.57.6.537 [ Links ]
Hammah, R., Yacoüb, T., Corkum, B., and Curran, J. 2005. The shear strength reduction method for the generalized Hoek-Brown criterion. Proceedings of the 40th U.S. Symposium on Rock Mechanics, Anchorage, Alaska. https://www.rocscience.com/assets/resources/learning/papers/The-Shear-Strength-Reduction-Method-for-the-Generalized-Hoek-Brown-Criterion.pdf [ Links ]
Hammah, R. and Awuku-Asabere, F. 2021. Does 3D slope stability analysis always produce higher factors of safety than 2D? https://www.rocscience.com/learning/does-3d-slope-stability-analysis-always-produce-higher-factors-of-safety-than-2d [ Links ]
Hoek, E. and Brown, E.T. 2018. The Hoek-Brown failure criterion and GSI - 2018 edition. Journal of Rock Mechanics and Geotechnical Engineering, vol. 11. pp. 445-463. [ Links ]
Lu, H., Fredlund, M., and Fredlund, D. 2013. Three-dimensional limit equilibrium analysis of open pits. Proceedings of Slope Stability 2013, Brisbane, Australia. Australian Centre for Geomechanics, Perth. pp. 541-554. [ Links ]
Kainthola, A.. Verma, D., Thareja, R., and Singh, T. 2013. A review on numerical slope stability analysis. International Journal of Science, Engineering and Technology Research. vol. 2, no. 6. pp. 1315-1320. [ Links ]
Kalatehjari, R. and Ali, N. 2013. A review of three-dimensional slope stability analyses based on limit equilibrium method. Electronic Journal of Geotechnical Engineering, vol. 18. pp. 119-134. [ Links ]
McQuillan, A., Canbulat, I., Payne, D., and Oh, J. 2018. New risk assessment methodology for coal mine excavated slopes. International Journal of Mining Science and Technology, vol. 30, no. 2. pp. 151-155. https://doi.org/10.1016/J.ijmst.2018.07.001 [ Links ]
McQuillan, A. Canbulat, I., and Oh, J. 2020. Methods applied in Australian industry to evaluate coal mine slope stability. International Journal of Mining Science and Technology. https://doi.org/10.1016/j.ijmst.2019.11.001 [ Links ]
McQuillan, A., Bar, N., and Yacoüb, T. 2021. On the comparison of 2D and 3D stability analyses of an anisotropic slope. The Evolution of Geotech - 25 Years of Innovation. Taylor & Francis. https://www.taylorfrancis.com/chapters/oa-edit/10.1201/9781003188339-38/comparison-2d-3d-stability-analyses-anisotropic-slope-mcquillan-bar-yacoub [ Links ]
McQuillan, A. and Guy, G. 2022. The evolution and application of 3D limit equilibrium modelling to assessing open cut mine slope stability. Proceedings of the Bowen Basin Symposium 2022, Mackay, Australia. Geological Society of Australia. [ Links ]
Pyke, R. 2017. How great are 3D effects in slope stability analysis? https://www.linkedin.com/pulse/3d-effects-slope-stability-analyses-robert-pyke [ Links ]
Rocscience Inc. 2022. http://www.rocscience.com [ Links ]
Romana, M. 1993. A geomechanical classification for slopes: Slope mass rating. Comprehensive Rock Engineering: Principles, Practice and Projects. Pergamon Press, Oxford. pp. 575-600. [ Links ]
Saeed, M., Maarefvand, P., and Yaaghubi, E. 2015. Two and three-dimensional slope stability analyses of final wall for Miduk mine. International Journal of Geo-Engineering, September. doi: 10.1186/s40703-015-0009-0 [ Links ]
Stark, T. and Eid, H. 1998. Performance of three-dimensional slope stability methods in practice. Journal of the Geotechnical Engineering Division, ASCE, vol. 124, no. 11. pp. 1049-1060. [ Links ]
Telfer, J. and Schumacher, F. 2022. Application of the 3D limit equilibrium method for slope stability analysis at the Bingham Canyon mine, A case study. Proceedings of Slope Stability 2022, Tucson, AZ. Geotechnical Centre of Excellence, University of Arizona. [ Links ]
Ugai, K. and Leshchlnsky, D. 1995. Three-dimensional limit equilibrium and finite element analyses: a comparison of results. Soils and Foundations, vol. 35, no. 4. pp. 1-7. [ Links ]
CRediT author statement
The authors declare that no funds, grants, or other support were received during the preparation of this manuscript.
The authors have no relevant financial or non-financial interests to disclose.
All authors contributed to the development and writing of this paper.
The data-sets generated and/or analysed during the presented case studies are not publicly available due to confidentiality agreements with mining companies providing the source data.
 Correspondence:
A. McQuillan
Email: alison@geckogeotech.com
Received: 26 Oct. 2022
Revised: 8 Jan. 2023
Accepted: 23 Jan. 2023
Published: February 2023

