


Services on Demand
Article
 English (pdf)
 Article in xml format
 Article references
Indicators

Related links
-
 Cited by Google
 -
 Similars in Google
Share

 Permalink
Journal of the Southern African Institute of Mining and Metallurgy
On-line version ISSN 2411-9717
Print version ISSN 2225-6253
J. S. Afr. Inst. Min. Metall. vol.122 n.7 Johannesburg Jul. 2022
http://dx.doi.org/10.17159/2411-9717/982/2022
PROFESSIONAL TECHNICAL AND SCIENTIFIC PAPERS
Costs and benefits of fit-for-purpose sampling solutions
T. BruceI; R.C.A. MinnittII
IFLSmidth, Boksburg East, South Africa
IIVisiting Emeritus Professor, School of Mining Engineering, University of the Witwatersrand, Johannesburg, South Africa
SYNOPSIS
Mining operations are generally reluctant to install high-cost sampling systems at operations that have been functioning for many years. The principal objection to installing appropriate equipment to extract correct and representative samples in process flows is the time and costs involved. The Theory of Sampling (TOS) provides a structured framework for identifying and quantifying the errors and bias associated with any sampling event, but this may be insufficient to initiate substantial investment in correctly designed sampling equipment. Financial losses arising from substandard sampling installations are usually disregarded because the value-add from a good quality sampling solution is invisible, but the cost is quite obvious. Depending on the needs, a less-than-perfect or fit-for-purpose sampling solution may be acceptable, provided the magnitude of sampling errors is understood and the assay results are interpreted accordingly. Categorical levels of acceptable accuracy and precision can be established depending on the sampling position in the mining value chain and the nature of the decisions to be made. The objective benefits of proposed fit-for-purpose sampling solutions should be presented to relevant decision-makers in such a way that adverse subjective decisions are countered so that appropriate solutions are implemented. Practical examples of the benefits from motivating the implementation of fit for purpose sampling solutions at sampling facilities around the world are provided.
Keywords: sampling, representative, costs, value-add, fit-for-purpose.
Introduction
All humans rationalize differently based on their cognitive processes or reasoning (culture, experience, educational background, level of management, etc.). As a result, decision-makers in mining financial departments may rationalize very differently about spending funds on corrective sampling compared to technical sampling experts, thus that well-conceived corrective sampling projects could be rejected. Irrespective of the appropriateness of the technical design, or imperatives of the Theory of Sampling (TOS), approval for implementing a corrective sampling solution is usually declined unless value-add can be quantified and corroborated with basic proof. The fact that the costs of poor sampling never show up as a line item in the annual financial statements means that managers do not see a figure that represents a loss to their earnings. Attitudes towards a meaningful spend on correctly designed and installed sampling equipment therefore remain refractory. The rationale for the implementation of improved sampling solutions must be presented as simply as possible leaving little room for subjective interpretation.
Estimating the value-add from implementing sound TOS-based sampling practices does not require a long or complicated report. A simple 'back to basics' approach, pointing out the critical points and findings with a summary of the financial benefits, provides a much better chance of getting your point across. The 'sampling fraternity' should also acknowledge that implementation of the 'close-to-perfect sampling solutions' are not always feasible. If the benefits of a fit-for-purpose solution compared to the capital cost of implementing a best-practice sampling solution are not immediately obvious, the project should not be rejected. The need to make compromises, knowing that not all solutions are perfect, may still provide some value-add by reducing the sampling error compared to current operations.
This paper presents a back-to-basics approach for demonstrating the benefits of installing corrective sampling protocols, equipment, and fit-for-purpose sampling solutions to reluctant shareholders and those approving budgets. Technical studies of mines and plants around the world, with specific attention to the benefits and value created from improved sampling, are presented.
General concepts
A number of observations have come to light as a result of presenting appeals to the boards of companies for funding to improve sampling facilities.
Distrust of large unsubstantiated numbers
The adage that 'If something sounds too good to be true, then it probably is' is still applicable. Statements such as '...better sampling can produce an additional US$25 000 000 worth of on-grade ore per annum...' sound too good to be true and arouse a certain level of scepticism. Numbers this large appear unrealistic and are probably not trustworthy unless they can be validated by providing realistic examples. It is better to begin by offering small numbers, for example '...correct sampling can deliver an additional US$7500 for a 100 000 t shipment of iron ore...' and allow the decision-makers do the mental arithmetic themselves. Producers who deliver over 340 Mt/a can easily see the potential value of better sampling.
Disinterest in statistics without practical application
A statement such as '...improved sampling equipment and procedures at a port facility, can improve your sampling preparation and measurement (SPM) precision from 0.22% to 0.15%...' could be lost on non-technical managers and executives. What they would prefer to hear is '...let me show you what improving your SPM can do for your profits.'
Executive committees have neither the time for nor the interest in detailed or complex calculations of precision, so that technical jargon alone will seldom motivate budget approval. The insight, interest, and understanding of sampling technicalities is not common amongst such audiences, but simple statements such as '...every 0.01% improvement on the SPM precision could potentially increase the on-grade production by 0.01%...' are more likely to pique their interest long enough for budget approval.
Unfortunately, the best motivations for improved sampling facilities are benefits that appear after the fact. As an example, consider an iron ore mine with an annual production of 300 Mt and a price of US$75 per ton, as is the case with Vale and Rio Tinto. Rio Tinto's Cape Lambert B port facility improved precision from 0.22% to 0.15% after implementing a well-designed automated sampling-to-analysis system (Brunning et al, 2014). This resulted in a 0.07% increase in on-grade ore, equivalent to 210 000 t, with an estimated value of US$15 750 000.
Penalties for out-of-spec products
The cost of underestimating the target analyte content is not reported in financial statements as it is not quantifiable, and in many cases is misunderstood. What should be seen on a company's financials are the costs incurred due to penalties for delivering off-spec grade ore and deleterious elements that exceed allowable limits. Quantifying the amount paid in penalties highlights a 'real' cost that could be reduced by implementing better sampling practices and systems.
Names mean more than numbers
The role and responsibility of financial managers may not allow them time to digest the theoretical aspects of TOS. Collaboration and certification of designs by well-known experts add more confidence to improved sampling solutions than complex formulaes. Specialists who are able to validate or verify decisions about proposed sampling installations are an effective method of convincing shareholders or project owners that money is well spent on improved sampling.
Few are impressed by jargon and equations
Correct sampling nomenclature and application of equations to estimate financial benefits is critical, but shareholders and financial managers are unimpressed by complex procedures and formulaes. Shareholders are much more likely to approve projects provided one can demonstrate that the estimated value-add through improved sampling has been validated by reputable persons or sources.
Project owner responsibilitiesS
Not all suppliers of sampling equipment apply similar standards, but they should aim to achieve complete solutions based on the TOS and good sampling practice. Solutions should include compromises required to accommodate restrictions on available space etc., but at the same time clearly stating the effects of such compromises on the end results. Sampling projects should not be awarded by project owners based purely on lowest cost procurement. The following questions are a guide to points to consider before selecting a sampling solution provider.
> Have current and future maximum and minimum design criteria been effectively communicated to the supplier, i.e., what worst-case scenarios could be faced by the system being requested?
> Does the supplier understand the TOS sufficiently to challenge aspects in the scope of work that could impede good sampling?
> For larger, more critical sampling points, has the supplier allowed a budget for computational modelling of material flow, using well established software and methods such as discrete element method (DEM) simulation (Hidding and Shaw, 2017)?
> To reduce capital costs suppliers should not compromise on:
• The size of the sampler to fit existing infrastructure
• Minimizing cutter aperture to reduce the sample mass for easier downstream processing
• Alternative drive technologies, including pneumatic, electric, or hydraulic
• Materials or manufacturing techniques and designs
• The 'correctness' of the sample and implications for sampling error and bias
• System reliability, ease of maintenance with minimal downtime, and access to inspection ports.
> Has the project owner ensured that the technical claims made by the supplier have been reviewed and validated?
Internal resources or sampling specialists should define the exact scope of work with as little ambiguity as possible before tenders are posted. Specifications should include descriptions of material flow characteristics in the stream to be sampled and details of the required sampler. Items to be defined include the sampler type, aperture size, cutter speed, replaceable cutter blades, easily accessible inspection hatches, no pneumatic or hydraulic drives on cutters, collection bins large enough to hold all sample material at maximum flow rates with no spillage, all contact surfaces to have a minimum angle of 700 from horizontal, and the cutter rest position is completely out of the material flow, etc.
The supplier should have discretion to stipulate what is deemed necessary to get the job done if these factors are not defined, but not necessarily what is best for ongoing long-term operations. Suppliers should suggest the additional features they offer, but project owners must know what is needed as a minimum to achieve the required sampling precision and to meet all the operational requirements. Using internal resources or specialists to define what is needed for sampling installations is more cost-effective than investigating what went wrong after the system has been implemented.
Fit-for-purpose sampling
Providing correct sampling solutions is a costly exercise and the more stringent the correct solutions, the higher will be the capital costs. This paper supports the concept that samples are suspect if the principles of the TOS are not followed. The rational man strives for perfection, but knowing that things in life are rarely perfect, attempts to demonstrate that fit-for-purpose sampling solutions may still offer value. Of course, the value depends on how the resulting analyses and associated confidence intervals will be used. This also assumes that benefits are not outweighed by the cost of taking, transporting, preparing, and assaying the sample - a simple concept, but one that may be overlooked by the sampling fraternity.
For example, dip sampling from slurry or liquid launders is known to be 'incorrect', but frequent dip samples from a material stream having high concentrations of a target element with a relatively even distribution can be used to indicate sudden changes in concentration levels. Although the absolute concentration of the lot cannot be measured with any level of certainty using dip sampling, it can alert the plant superintendent to reduced or elevated levels of target analyte, on which to base further investigation.
As a general rule of thumb, sampling can be used for either process control or product control. Process control, being used for internal operations to optimize a facility, can typically allow for a small level of flexibility, provided that the actions taken are aligned with the confidence in the sample. Product control, material accounting, and quality control for saleable goods typically allow little to no room for error and, in these applications, it is critical to precisely estimate the quality of the product with measurable confidence. In this case all TOS practices should be strictly adhered to.
ISO standards versus Theory of Sampling
'ISO compliant' is a term often used when discussing upgrades to sampling facilities. ISO standards, although critical in establishing standard methods of sampling, preparation, and analysis for various materials, are too often applied out of context. There appears to be a widespread misunderstanding that compliance with the relevant ISO standard will automatically result in the best possible sampling results without due consideration of the carefully constructed requirements for correct and representative sampling established in the TOS. ISO standards provide recommendations for ascertaining a minimum precision and level of confidence in accordance with international standards, but without the constraints implied in the TOS framework, adherence to ISO does not necessarily guarantee a correct sampling solution. However, improving sampling equipment and methods above the minimum requirement recommended by ISO standards can add further value to a producer. As an example, if iron ore producers reduce the precision on a 270 000 t lot below the βSPM1 of 0.34% Fe stipulated by ISO 3082, substantial improvements in on-grade ore production can be achieved.
Compliance is one thing, but before setting a limit on the resources assigned to sampling and analysis, it is critical to establish the monetary value of each sample using a minimum requirement, compared to what it could be worth if additional resources were spent on improving it. Rather than strict compliance with minimum requirements from relevant ISO standards, other aspects, especially efficiency for operational purposes, should be considered when specifying a sampling point. For example, taking more primary increments and analysing more subsamples than required by ISO during the loading of an iron ore vessel can give a better indication of the grade during loading. This can then be used to blend into the vessel more efficiently.
Although some principles may be the same, it is unwise to apply guidelines from a single ISO standard to two different materials. For example, ISO 3082 for iron ores should not be used to estimate sampling compliance for phosphate fertilizers because the material characteristics are so different; in this case the material-specific standard must be applied. Where no specifications are available for a material, TOS practices such as heterogeneity tests and calibration for establishing nomograms should be applied.
Motivating a sampling project
The objective of a sampling study should be to demonstrate how improved sampling practices can improve profitability. Motivating a project to improve sampling equipment and protocols requires an understanding of the complete value chain so that expectations about the outcome of the sampling project are met. This may include defining the levels of reliability and precision to be achieved as a result of improvements to sample extraction, handling/transport, preparation, and measurement. Motivating for added value and increased profit from improved sampling precision must be supported by realistic estimates of the capital cost and required investment. The capital investment needed for taking better samples using better sampling equipment, ensuring the correct sample size and sample frequency, must be calculated accurately. In addition, the costs of ensuring that samples are correctly transported, prepared, analysed, and reported, within an acceptable turn-around time that allows real-time changes to be made, must be established. The total investment required in terms of time, money, and effort must be understood by managers and financial officers if proposals to improve sampling processes are to have credibility and integrity.
Case studies and examples
Rapid turn-around versus high precision
A smelter aimed for less than 5 ppm precious metal in slag which it sells as silica waste for US$3 per ton. Slag analyses over a six-month period indicated the precious metal content to be as high as 18 ppm. The operating cost to recycle slag through the furnace, after it has cooled is approximately US$5 700 per ton, so although sampling error could be reduced by improved sampling methods, the cost benefit would be minimal unless the samples can be collected and analysed before the slag is cast. On average around 10 ts of slag is produced per cycle, meaning that the value of precious metals in a single slag cycle would have to be greater than US$57 000 to make recycling through the furnace viable. If samples can be collected and analysed before the slag is poured, then remedial actions such as increasing the residence time in the furnace can be taken. In this case precision of the result is not as crucial as the sampling-to-analysis turnaround time, so this is where the focus for the project was placed. If the furnace charge is analysed before smelting it is possible to modify the charge and reduce the risk of precious metals reporting to the slag. In this case the precision is more critical to the process as small variations in the charge can affect the smelt efficiency.
Reducing the loss of precious metals in the slag to less than 5 ppm would result in an additional precious metal production of over US$400 000 per annum. This figure, based on historical data gathered from the smelter, compares the actual gold content of processed slag with what it should have been if the Au grade was maintained below 5 ppm. Assuming a 3-year return on investment, a sampling solution costing less than US$1 200 000 would add value. This example illustrates the necessity of understanding the limitations and effect of improved sampling before proposing a sampling-to-analysis solution.
A less-than-perfect sampling solution still adds value
A less than perfect sampling solution was observed at a phosphate fertilizer production plant where phosphate slurry is mixed with H2SO4 in a reactor vessel to produce phosphoric acid. Dip samples are taken between 50 cm - 500 cm below the slurry surface. Concentrations of free sulphate, measured by titration, and phosphoric acid cannot be quantified in the complete vessel with any certainty using this imperfect sample, but some knowledge of the concentrations is critical for controlling processes in the reactors.
In this case time is of the essence. It is critical that the sample be filtered and analysed as soon after extraction as possible because the reaction in the sample container continues as the sample cools, affecting the accuracy of the analytical results significantly. To improve the integrity of the sample, an insulated sample container should be used to collect the sample (Ritchie, 2018, Personal communication). In addition, rapid transport to the laboratory using a pneumatic air tube conveyance was suggested.
Too many compromises invalidate the sampling point
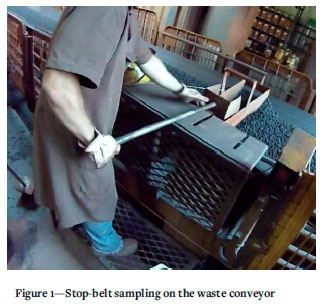
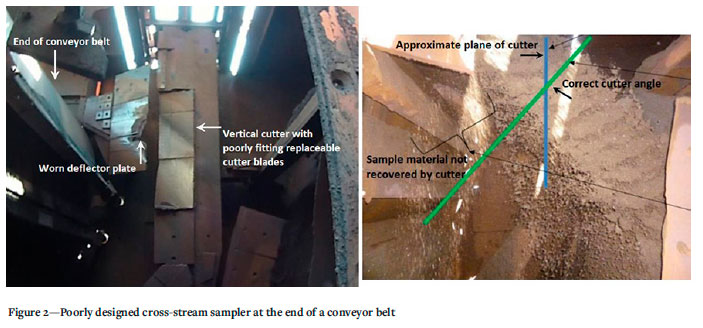
Inspection of a large iron ore producer's port facility revealed that the primary sample cutter could not extract a correct sample as defined by the TOS. The cross-belt sampler on the loading conveyor belt cut a stream of iron ore fines, lump, and pellets, flowing at 23 000 t/h (maximum design capacity). The secondary and tertiary sample cutters had been decommissioned because their design did not comply with requirements for large flow rates and physical characteristics of the material. The primary cut was diverted directly to a waste conveyor which was randomly stopped, once per primary increment, and a stop-belt sample of approximately 20 kg was taken as shown in Figure 1.
However, design constraints faced by the supplier meant that the compromises made to the sampling installation almost completely invalidated the system. As shown in Figure 2, to fit the sample collector into the available head chute area it was made very shallow, allowing material to bounce out of the cutter opening. The cutter was not perpendicular to the material flow and neither was it wide enough to be able to cross the complete stream and belt scraper. In addition, the cutter was driven by an underpowered hydraulic cylinder, unable to move the cutter through the stream at a constant speed.
The system manufactured by the supplier fitted the available space but failed to consider the effect and possible consequences of implementing these compromises. It is also possible that this system was designed for lower flow rates even though the belt capacity could be increased to the maximum loading of 23 000 t/h.
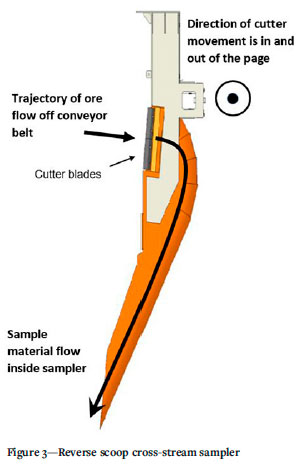
The estimated investment required to replace the sampling equipment for primary, secondary, and tertiary sampling with a properly designed reverse scoop sample cutter, as shown in Figure 3, was US$4 200 000, excluding the removal of the existing system and any other infrastructure modifications. Even though this would be a costly exercise for the end-user, the upgrade would allow a substantial improvement in the precision of the results and could allow production of over 1% more on-grade ore by blending various grades to a tighter tolerance with more confidence. This facility exports over 200 Mt/a of iron ore and with an iron ore price of US$75 per ton (at the time of writting), a 1% increase could be worth US$150 000 000 per annum.
Modifications to the plant will allow the company to exploit the improved βSPM precision of Fe so they can rapidly blend the ore to achieve a tighter tolerance on the required export grade. Samples are stored at the sampling point and transported 500 m to the analytical lab once a shift, but this results in a degree of degradation of the sample (contamination from airborne particulates, moisture loss etc.) which means that the data from these samples is historical rather than real-time. Rapid, safe transport of tertiary sample increments from the sampling tower to the robotic automated preparation and analytical laboratory by an automated transport system can further improve precision and turnaround time.
Good sampling to analytical practices
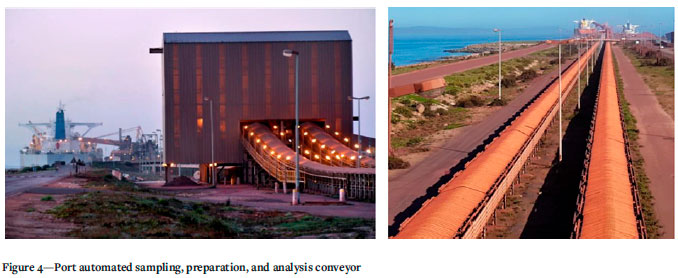
A port iron ore laboratory provides an example of how good sampling and rapid automated sample preparation and measurement can add value. Trains and trucks deliver iron ore from various mines to the port facility where it is stockpiled according to grade. The two feed conveyors, one high-grade and the other low-grade, transport ore from different stockpiles to ships in dock. The sampling and laboratory stations are situated over these belts at the transfer chute to the primary ship-loading conveyors as shown in Figure 4.
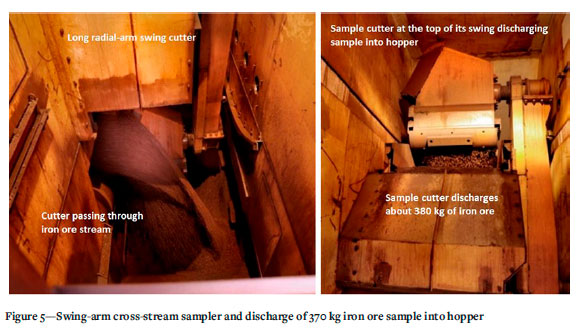
An innovative design by a sampling manufacturer, known as the swing-arm cutter, overcame the constraint that the primary sample cut needed to be lifted in order to allow for secondary sampling in the available space in the sampling building. The cross-stream swing-arm sample cutter is connected to a swivel point on a long-radius swing arm. The arm rotates, moving the sample cutter through the material stream at a constant speed with the sample being collected in the sample collection device behind and below the cutter openings. The arm continues to swing until completely vertical, at which point the sample bin is opened and the sample is dropped onto a feed conveyor which moves it to a weigh hopper and then to the secondary vezin-type cross-stream sampler, as shown in Figure 5.
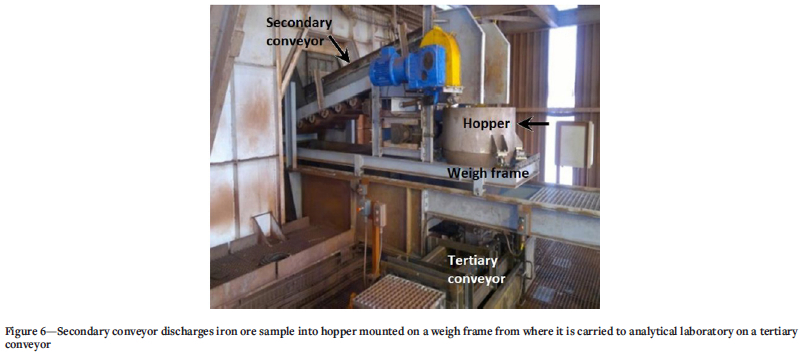
The sample is then transported on a secondary conveyor to a hopper on load-cells where it is weighed and transferred to another conveyor carrying the sample to the analytical laboratory (Figure 6).
This sampling station adheres to the various sampling TOS practices as noted below (Hofmeyr and Pretorius, 2013).
> Systematic sampling is carried out on a mass basis. The loaded conveyor belt passes over the load-cells and this information controls the sampling interval on the belt.
> A complete cross-section of the falling stream is taken by the swing-arm sample cutter.
> The aperture of the sample cutter is more than three times the nominal top size of the ore.
> The speed of the sample cutter is maintained at less than 0.6 m/s.
> The sample cutter travels at a uniform speed and both the leading and trailing edges clear the ore stream at the end of the traverse.
> The lips of the sample cutter are parallel.
> Free-fall drops in the automated transport of samples are kept to a minimum to reduce size degradation of the ore and minimize bias in size distribution. No maximum heights are specified in the ISO manuals, but 1 m is understood to be the maximum height. However, this height is exceeded by a small margin in two places to accommodate automation.
>The minimum increment mass required by ISO for the primary sampling system at the laboratory in terms of tons per hour on the conveyor belt, cutter aperture, and cutter speed is 330 kg. In practice, this sampling facility achieves a primary sample of 350±70 kg.
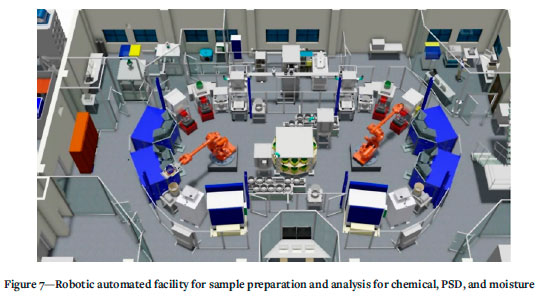
The secondary sample cut is conveyed to the robotically automated sample preparation and analysis facility where each increment is accumulated in a steel bin ready for further preparation and analysis.
As shown in Figure 7, the material is divided into subsamples. One portion is sent for automated ISO moisture and particle size distribution (PSD) analysis and a second is sent for automated chemical preparation and analysis. Using rapid infra-red drying technologies, the laboratory is able to produce verified results within 6 hours of the ship being loaded. Over a six-month period the average precision measured was better than 0.14%. This facility is also ISO 17025- and ISO 3082- compliant and certified.
Every reasonable effort has been made to minimize SPM error in this facility and with the addition of automated preparation and analysis not only makes the system precise, but also offers the value of rapid preparation and analysis. As noted above, even though the sampling building did not have enough headroom to fit a standard traditional cross-stream sampler an innovative alternative was developed. This key contribution required that both the client and supplier have a strong understanding of the sampling requirements and work together to find a feasible solution.
Value of investment
The iron ore producer has not released the actual value of the investment to make this facility perform as it does, but the following information is available:
> The final analysis is available 6 hours after ship loading is complete. This was previously a minimum of 48 hours. The benefit is that the lot can be invoiced nearly two days earlier than before, resulting in an estimated gain of US$5500 per 270 000 t shipment on interest alone.
> For large lots, the laboratory can release data during ship loading with a precision of less than 0.15%. This data is used to adjust the blend between low- and high-grade ore to control the final grade being loaded.
> The iron ore producer can use the high precision as proof of the quality of their product, thereby giving them a commercial advantage over their competition (bragging rights).
> Reduced risk of penalties due to deleterious elements exceeding upper specification limits of the lot, or lower than specified Fe content
> Disputes over the quality of the ore loaded through this terminal are quickly settled due to the overall compliance of the complete facility with the relevant laboratory and material specifications.
This plant has proven that rapid analysis with consistently high precision is possible, so the producer is currently investigating upgrades and expansions of this facility to increase sampling and analytical capacity with the aim of optimizing in-ship grade blending.
Method for the pricing of iron ore
In discussions with iron ore producers, there appear to be a number of methods of calculating the actual price of iron ore. Pricing guides are readily available online for the various grades of iron ore and commodities. Specific grades with upper specification limits on deleterious elements are defined for each commodity, but after ship loading the actual chemical and physical characteristics of the lot can be used to modify the price accordingly. How this is done for a shipment of iron ore, after the ship is loaded with a specific ore grade/type and results obtained while loading the ship have all been processed, is not clearly defined, but it could be by contract negotiation between suppliers and customers. The following is a proposal for determining the price.
The Metal Bulletin publication of August 2018, entitled 'Iron Ore Indices, Pricing Guide: Methodology specification and use', employs an index called 'Value-In-Use' (VIU) to correct the price of specific ore grade/type using the final analyses of samples collected during the loading of the lot. The VIU index is released on the first working day of each month and could be applied as follows:
If a = The required value of Fe in the commodity, say 62% Fe fines index
MBIOI(a) = The index price for iron ore with a% Fe, using the Metal Bulletin Iron Ore Indices (MBIOI)
Pac = The selling price of iron ore (per dry ton) with an Fe concentration calculated during loading,
and
Fe-VIU index = Value in use index for the a grade of ore, then
Pac = MBIOIa + (%Fe difference from a * Fe-VIU index).
Thus, if the reported Fe content after loading is understated, it will directly impact the price of the ore (all other factors being equal). That is ignoring all other penalties or price adjustments for higher content of deleterious elements or less than the set range of Fe. The further away from the actual value that the reported value is, the more the producer will lose if the Fe content is understated.
This information could be used to motivate a sampling, sample preparation, and analysis project as follows. Consider an iron ore producer loading ore of grade/type 62%Fe fines, having a daily index price of US$86.68 per dry ton with a monthly VIU index of US$1.28 on (21 February 2019, Metal Bulletin Iron Ore Index).
If the final combined SPM precision for Fe achieved by a supplier at a port loading is 0.3%, and if the supplier reported a value of 62% Fe, the actual value of Fe could be as much as 62.19%. If the supplier was able to reduce the SPM precision to 0.1% they would potentially be under- or over-reporting by only 0.062% Fe.
Using the VIU correction calculation above, the price difference per dry ton between the first instance and the second is US$0.16. This value multiplied over a shipment mass of 270 000 t will be US$43 200, so the supplier would under-invoice their end client by this amount. This potential loss in profits, multiplied over a year's production for a large company such as Rio Tinto, VALE, BHP etc., producing +300 Mt/a, could amount to well over US$50 000 000.00 per year.
Conclusions
A full understanding of the complete mineral production and sale process before and after the sampling point is essential. Such insights allow one to appreciate the current usage of the sample result, as well as identify other potential uses and value-add, especially if the quality of the sample can be improved. Ascribing a monetary value to a sample in a process or procedure is a new and important concept. An understanding of the levels of precision or sampling correctness of a sample, as well as the turnaround time to analysis, will influence this value. An appreciation of the constraints such as applicable standards or specifications, physical space available, accessibility for inspections, maintenance and sample collection, plant downtime for the installation, distance between sampling point and the laboratory must all be taken into consideration in order to create a fit-for-purpose sampling solution.
In the process control domain, fit-for-purpose sampling has a wider scope as compromises can be made in various aspects of sampling to suit the application, provided the consequences of these compromises are understood. In the product control domain, where the same compromises cannot be made, fit-for-purpose sampling can still be applied when considering how the sampling will affect other aspects of the facility such as material throughput and the value of faster sampling-to-analysis. Using a cross-stream sampler will not affect loading rates, whereas a stop-belt sampler will, therefore the cross-stream sampler is fit-for-purpose in this case.
The feasibility of motivating and actioning an upgrade process required by a facility in order to exploit the expected value-add from the specified sampling solution also requires insight and understanding. Some of the actions can include automated sample collection and transport systems to increase turnaround time from sampling to laboratory. Other actions could include upgrades to the laboratory to accommodate the sampling solution and an upgrade to standard operating procedures. The result of such actions would enable the facility to respond to sample information to achieve the value-add.
It is important that project owners communicate their needs to sampling equipment suppliers in a way that ensures the supplier provides the best solution for their application. Lowest cost procurement should not govern the selection of equipment, as this is likely to turn out to be a costly error of judgement. A policy of lowest cost procurement is short-sighted as it may mean not only inferior equipment selection, but also incorrect sample extraction that introduces costly bias associated with poor sampling.
The greatest deterrent to decisions to install appropriate or improved sampling solutions is that the benefits are invisible, while the costs are obvious. No financial statements tell CEOs what the benefits from sampling are. The only indications might be increases in the costs of reagents and consumables. Sampling materials off the waste dumps and in the tailings launder may also provide the evidence needed to convince the financial managers that improved sampling equipment is essential. When presenting a sampling solution to an executive committee with the hope of getting their approval, the primary motivational factor should be a clear demonstration of the monetary benefits the solution can offer. The basis of the motivation should be a comparison of cost-to-implement against the long-term expected returns on investment. All mathematical and other technical aspects of the proposed solution should be kept as straightforward as possible with only key results presented, which are ideally verified by a well-respected specialist in the field.
References
Brunning, R., Andringa-Bate, C., Graham, M., and Westerngren, S. 2014. Cape Lambert Port B shiploading, sampling and analysis. Proceedings of the Sampling Conference, Perth, W.A. Australasian Institute of Mining and Metallurgy, Melbourne. pp 79 - 90. [ Links ]
Hidding, M. and Shaw, R. 2017. Modelling ore flow in the design of high-capacity sample cutters. Proceedings of WCSB 8, the Eighth World Conference on Sampling and Blending, Perth, Western Australia. Australasian Institute of Mining and Metallurgy. pp 145 - 149. [ Links ]
Hofmeyr, P. and Pretorius, D. 2013. Automated sampling of iron ore for analysis at the Saldanha iron ore terminal in South Africa. Proceedings of Sampling and Analysis 2013. Southern African Institute of Mining and Metallurgy, Johannesburg. [ Links ]
Ritchie, C. 2018. Personal communication sample. [ Links ]
 Correspondence:
T. Bruce
Email: trevor.bruce@flsmidth.com
Received: 25 Oct. 2019
Revised: 1 Mar. 2022
Accepted: 3 Jun. 2022
Published: July 2022
1 Overall precision for sampling preparation and measurement βSPM = 2σSPM.

