


Services on Demand
Article
 English (pdf)
 Article in xml format
 Article references
Indicators

Related links
-
 Cited by Google
 -
 Similars in Google
Share

 Permalink
Journal of the Southern African Institute of Mining and Metallurgy
On-line version ISSN 2411-9717
Print version ISSN 2225-6253
J. S. Afr. Inst. Min. Metall. vol.122 n.7 Johannesburg Jul. 2022
http://dx.doi.org/10.17159/2411-9717/1612/2022
PROFESSIONAL TECHNICAL AND SCIENTIFIC PAPERS
Quality control in tailings resource exploration at Havelock Mine, Eswatini
S. GanI; L. BirrellII; D. RobbertzeII; B. ZhaoI, III; E. van NiekerkI; L. NcubiI
IDepartment of Environmental Sciences, College of Agriculture and Environmental Sciences, University of South Africa. S. Gan: https://orcid.org/0000-0001-6227-6502; B. Zhao: https://orcid.org/0000-0003-4991-1246; H.J. van Niekerk: https://orcid.org/0000-0002-2269-0810; L. Ncubi: https://orcid.org/0000-0003-0208-3471
IISalamander Mining International Limited
IIISchool of Geoscience and Technology, Southwest Petroleum University, China
SYNOPSIS
Quality assurance and quality control (or QAQC) plays a key role in safeguarding the level of confidence of the data generated during mineral exploration and mine development, and is also part of the reporting code requirements for resource estimation and reporting, as well as mining investment. Implementation of good policies and working protocols in quality management will result in the generation of reliable information, which is critical for decision-making on the future of the mining project. The use of certified reference materials, i.e., standard, blank, and duplicate samples, proves effective and efficient for ensuring the level of data confidence in terms of precision, accuracy, and sample contamination. This is well demonstrated by the practice of QC in the exploration programme for the chrysotile tailings storage facilities of Havelock Mine, using 1254 samples from 53 drill-holes. Different statistical tools were applied to analyse the assay results from these samples. The outcome substantiates that the QC practice established during the Havelock exploration project is aligned to best practice guidelines in the industry. The resource delineated indicates that the tailings material at Havelock could potentially become a significant source of supply to the global magnesium market.
Keywords: quality control, QAQC, Resource estimation, exploration, magnesium, Havelock, Eswatini.
Introduction
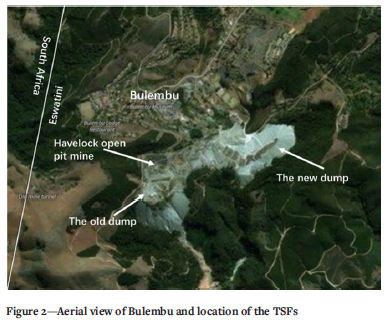
Havelock Mine, situated adjacent to the small town of Bulembu in the northwestern corner of Eswatini (previously Swaziland), used to be the biggest producer of asbestos in Africa. Mining operations were started in 1939 by Turner & Newwall of Manchester (Barton, 1982; Anhaeusser, 2012; Jourdan, 1990). The mine was closed in 2001.
All the residues and waste materials which resulted from the mining operation have been contained in the two tailings storage facilities (TSFs) at Bulembu.
Kobolondo Mining, a company registered in Eswatini, started an initiative to extract the magnesium resource from the chrysotile asbestos tailings at Havelock Mine. As part of this initiative, some of the authors participated in an exploration programme to evaluate the mineral resources of the TSFs. The aim of this programme was to produce a Mineral Resource statement that would meet the requirements of the Joint Ore Reserves Committee (JORC) Code of Australia.
This paper covers the following major aspects: geological setting, mining history, geology of Havelock Mine, conception of quality assurance and quality control, QAQC policy and practice, composition of the tailings materials, and assay results.
Geological setting
Havelock Mine sits in the southern part of the Barberton greenstone belt, a geological heritage area renowned as one of a few sites where some of the oldest rocks on Earth are preserved.
The Barberton greenstone belt, located in the southeastern part of South Africa and including part of northern Eswatini, occupies an area of 120 x 50 km with an estimated depth of less than 8 km. It consists of the Paleoarchean Barberton Supergroup (ages ranging from 3 600 Ma to 3 200Ma) volcanosedimentary rocks, which are entirely engulfed in massive intrusive granitoid rocks (Figure 1).
Rocks of the Barberton greenstone belt have experienced strong structural deformation, resulting in the development of folds and faults trending NE-SW and E-W.
Mining history
Havelock Mine commenced production of chrysotile asbestos in 1939 by open-pit operation, and in 1948 changed to underground extraction.
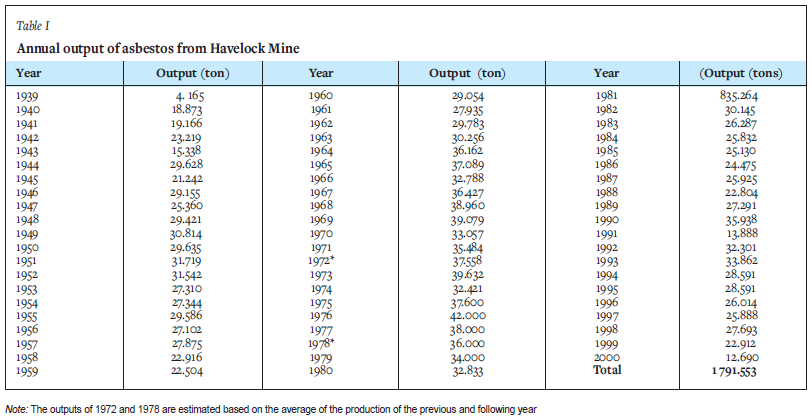
Because of the rich and extensive nature of the deposit, Havelock Mine soon became one of the five largest asbestos mines in the world, producing an average of 30 000 t/a between 1939 and 1998, with the highest annual production of 42 000 t recorded in 1976 (Table I).
In 1940, the mine contributed 70% of the income tax of Eswatini. It maintained its position as an economic mainstay of the country until the 1950s when agricultural products began to play an equally important role. It was the largest earner of foreign currency until 1962, when it was surpassed by sugar.
During its 62 years of life, Havelock Mine produced nearly 1.8 Mt of asbestos fibre and was an important source of commodity exports for Eswatini. It is said that the asbestos product from Havelock Mine was used by the British Army during the Second World War.
At its peak operation, Havelock Mine employed more than 10 000 mineworkers, being one of the largest employers in Eswatini. The town of Bulembu was established in 1936 solely for serving the mining activities.
By the 1990s, with restrictions on asbestos usage in the developed countries and the resulting shrinking market, production at Havelock Mine began to decline. By 2000, output had fallen to just 12 690 t/a. The mine was no longer viable and was permanently closed.
It is estimated that, during the operational period of the mine, about 50 Mt of ore were mined and milled. Most of the milled material has been stockpiled in the TSFs.
Some of the tailings were reprocessed between 2001 and 2004 for recovery of chrysotile fibre. There are currently two tailings dumps in Bulembu (Figure 2). The old or West dump is the original site for the disposal of the processed material. The new or East tailings dump contains the reworked waste material produced during the reprocessing of the original tailings.
Geology
Havelock asbestos mine is hosted in the Havelock Ultramafic Complex, which is the uppermost division of the Paleoarchean Onverwacht Group of the Barberton greenstone belt (Barton, 1982; Anhaeusser, 1974). Serpentinite is the main rock type in the mine area. Other lithologies include banded iron formation, banded cherts, talc, and diabase dykes.
Deformation of the Havelock Ultramafic Complex has resulted in the development of E-W striking thrust faults and folds. Chrysotile asbestos orebodies occur as a stockwork of cross-fibre seams and veins, striking E-W and NE-SW and dipping to the south at an angle of 45-70°.
Concept of quality assurance and quality control
For mineral exploration, data reliability is one of the essential elements to ensure that correct decisions are made regarding the future of the project, namely whether to continue with further work or terminate the effort, whether further investment is warranted, or whether no added value will be generated with additional investigation. The key to the whole process is the reliability of information. Therefore, the quality assurance (QA) and quality control (QC) approach is fundamental to secure such reliability and correctness.
For public companies that are traded on stock exchanges, there are legal requirements related to sampling and QC procedures, such as the well-known JORC Code, and the South African Code for the Reporting of Exploration Results, Mineral Resources and Mineral Reserves (SAMREC Code). Many financial institutions include reviewing and auditing of the QC practice of the target projects or companies as part of their due diligence studies for funding of mining opportunities. Therefore, the development and implementation of an appropriate sampling protocol and QC policy have been incorporated into the basic requirements for mineral exploration and mine development.
Quality assurance and quality control
Quality assurance and quality control (QAQC) are two major components of any quality data-management system. The two have different definitions and functions in general, but at the same time they are closely integrated into the overall practice of quality management.
As defined by the International Organization for Standardization (ISO, 1994), QA is 'the assembly of all planned and systematic actions necessary to provide adequate confidence that a product, process, or service will satisfy given quality requirements'. Alternatively, it can be defined as 'all the planned and systematic activities implemented within the quality system that can be demonstrated to provide confidence that a product or service will fulfil requirements for quality', QC is rather 'the operational techniques and activities that are used to satisfy quality requirements'.
QA aims to assure that the right production process is performed in the right manner, whereas QC assures that the product will match the requisite standard (Surbhi, 2019). On one hand, QA relates to how a process is performed or how a product is made and is about the process, plans, and designs to provide the confidence level satisfactory to the quality requirement. QC, on the other hand, is more associated with the inspection aspect of quality management and is a set of activities and procedures to guarantee the quality of the products against standards and requirements.
In practice, the two terms are often used interchangeably (referred to as QAQC). Both have the same purpose - to safeguard the quality of products or services but with different emphases and approaches. Essentially, the purpose of QA is to prevent problems/errors from happening, being proactive, whereas QC is to detect and assess the problems when they occur, being reactive.
The goal of QAQC is to ensure precise, accurate, representative and reliable results of the information and to enhance the level of confidence of the data presented.
Precision and accuracy
The reliability of and level of confidence in data are often measured against precision and accuracy, which are two important measurements in the information system.
Precision, as defined by the Joint Committee for Guides in Metrology (JCGM, 2008), is the 'closeness of agreement between indications or measured quantity values obtained by replicate measurements on the same or similar objects under specified conditions'. It is usually established by repeated measurements of the same sample or replicate samples under the same conditions. The differences between these results indicate the attribute of precision, such as low precision or high precision. There are statistical tools to quantify precision, such as standard deviation, variance, and coefficient of variation.
Accuracy, on the other hand, is defined as the 'closeness of agreement between a measured quantity value and a true quantity value of a measurand' (JCGM, 2008). It refers to how close the result of the measurement is to the 'true' or predetermined value.
In practice, accuracy is normally assessed through standard reference material in which the value of a specific element or elements is known. The deviation of the test result from the known value is an indication of the accuracy.
Both precision and accuracy are used to describe the level of confidence in, and reliability of, data obtained from the measurement tests.
Assay error and bias
In data science, bias is the deviation from expectation in the data. It basically refers to an error in the data. The true value of the data, either a quantitative or qualitative attribute, is negatively influenced by errors and biases.
In assaying of geological and mining samples, there are three types of error (Abzalov, 2008, 2011). The first type relates to the process of sample collection, including how the samples are collected and stored, and the characteristics of the samples, such as weight, heterogeneity, and impurity content. It also includes the so-called fundamental sampling error, which is brought about by the structure of the sample materials, such as the shape and size of the mineral particles.
The second type of error occurs during laboratory preparation of the samples, involving delineation, crushing, pulverizing, weighing, and contamination.
The third type of error, the instrumental error, occurs during the analytical operations. It is caused by the analytical instruments utilized in the process and is often referred as instrumental bias.
Error and bias occur for various reasons when sample assaying is carried out by technicians in laboratories under various conditions. They have an unfavourable impact on the quality of data but are unavoidable. What we can do is to minimize error and bias and find a way to assess their spread and make judgements about their influence.
The extent of error and bias of data is measured by precision and accuracy.
Reference materials
In order to assess the precision and accuracy of assay results of samples, reference materials with known values of element contents are usually used as a benchmark to validate the quality of the data generated by the analytical process. If the reference material fulfils a number of requirements, such as proven homogeneity and stability, and characterization of the property values using suitable, well-described and validated methods, and is certified by a reputable agency, it is then referred to as a certified reference material (CRM).
The commonly used CRMs include standard samples, in which the contents of a certain number of elements are well determined, and blank samples, which contain no detectable trace of the elements concerned and usually consist of barren quartz.
Standard and blank samples can be purchased from qualified commercial institutions. They are inserted into the normal sample batches and go through the same analytical route. They are not affected by the preparation practice for the normal samples and are intended only to test the error and bias arising from the analytical procedures and instruments used in the laboratory.
In addition, it is also common practice to include duplicate samples of the same material with different identification numbers, which are treated as two separate entities for assay purposes.
Standard samples are used to examine the accuracy of the assay results of the laboratory. Blank samples are used to test the possible contamination that might arise in the analytical process. Duplicate samples are inserted to scrutinize the repeatability and reproducibility (Runje, Novak, and Razumic, 2017; JCGM, 2008) or precision of the outcome of the analytical work.
QAQC policy and practice
During exploration for the rehabilitation of the chrysotile tailings facilities of Havelock Mine, a comprehensive sampling protocol was established and strictly implemented. It covered the whole process of the operation, from topographic survey and drilling to sampling, sample storage and transportation, as well as core logging. This QAQC policy and practice laid a good foundation for the consequent resource estimation, as confirmed by external consultants.
Drilling
Drilling was carried out on the two TSFs of Havelock Mine.
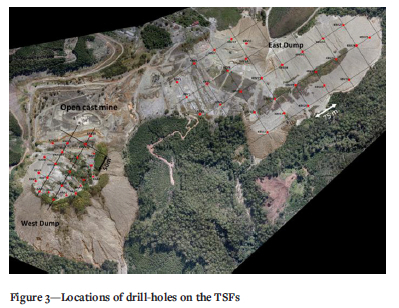
Selection of drill spacing is usually an important decision in any mineral exploration programme. A balance needs to be maintained between the appropriate drill-hole spacing and project costs. At Havelock Mine, the tailings materials contained in the residue dumps went through various production processes historically and were therefore well mixed, resulting in a relatively homogeneous composition. The materials in the new dump have been reprocessed again and thus are more homogeneous. Based on such considerations, as well as inputs from specialist consultants in resource modelling, a 50 m drill-hole grid was selected for the old dump, and a 75 m grid for the new dump (Figure 3).
The main purpose of drilling was to collect samples of the tailings materials for assay and resource estimation, and other parameters such as the depth of the TSFs. One air-core rig, a type of reverse circulation drilling machine (RC rig), was mounted on a truck and deployed at the site (Figure 4).
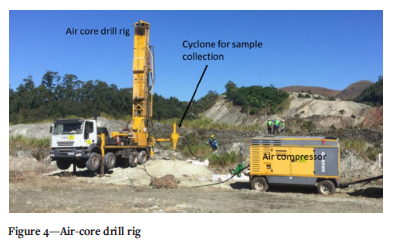
The rig used three tungsten steel blades to cut through the tailings materials, which were blown into the drilling rod by high-pressure air and dropped into a cyclone on the surface. Samples were collected manually from the cyclone (Figure 4).
Prior to commencement of the drilling programme, drill-holes were first plotted on the airborne map (Figure 3) of the dumps produced by Swazi Survey, which also generated the coordinates of the drill-holes.
In the field, a handheld GPS device (GARMIN GPSMAP64S) and a soft measuring tape were used to locate the preliminary position of the drill-holes. A peg with the identification number of the drill-hole was placed to mark each position.
An accurate collar survey was carried out by Swazi Survey using the Trimble R10 dual-frequency Rtk GNSS system, which has an accuracy of 30 mm horizontally and 40 mm vertically. An iron rod (12 mm x 450 mm) was driven into the ground with a hammer to mark the surveyed position of the drill-hole.
After the completion of drilling, 19 out of the 53 holes were resurveyed because their collar positions shifted from the planned locations during the drilling process.
The downhole survey was carried out immediately after completion of each hole using an EZ-GYRO survey instrument from Reflex South Africa with an accuracy of ±1° for azimuth and ±0.3° for dip angle. For shallow holes (<60 m), readings of depth, dip, and azimuth were taken every 5-8 m. For deep holes (>60 m), readings were taken at 10 m intervals.
Sampling method
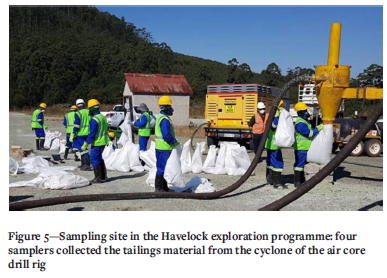
A large woven bag was attached to the cyclone to collect samples. At the end of each metre run, the sample bag was removed manually and a new bag was placed to catch the material. In other words, one sample was collected for each metre run (Figure 5).
Each sample was weighed with a scale on site and the mass recorded in the sample logging sheet.
Sample splitting
After the sample was weighed, the material was placed onto a three-tier riffle splitter to separate the chrysotile tailings for assay and storage. The splitter had 16 slots with a width of 32.2 mm. Almost all the tailings materials could pass through the splitter.
There were two trays at the bottom of the splitter. The material caught in the first tray, equal to 12.5% of the 1 m run sample, was collected for assay purposes. The remaining 87.5%, caught in the second tray, was bagged for every 1 m run and stored for future use (Figure 6).
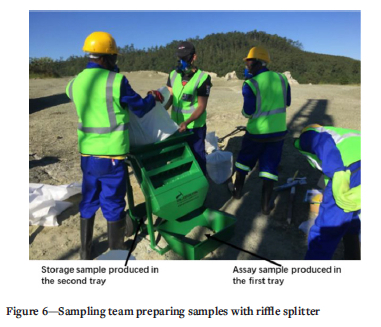
The split material in the first tray was composited over every 3 m interval to produce one assay sample, which was bagged and sealed for dispatch to the test laboratory.
Prevention of contamination
In order to minimize sample cross-contamination, the cyclone was cleaned every 7-8 m run with high-pressure air. Occasionally the rig was stopped and the cyclone was cleaned manually by knocking with a hammer, or opened for cleaning, depending on the flow of material through the system.
The riffle splitter was cleaned by the sampling assistants with dry paintbrushes before and after each sample splitting.
Bags used to catch samples from the cyclone were re-used a few times. After each use, the empty bag was shaken to get rid of the residue material from the previous catch.
The assay samples were contained in new, clean plastic bags after splitting.
Sample storage
All the sampling activities, including splitting, bagging, logging, and sealing, took place at the drilling site. All the bagged samples were loaded onto a light delivery vehicle and transported to the sample storage facility in Bulembu. The distance between the sampling site and the storage was 2-3 km.
The storage facilities were locked at all times and access was controlled by the geologist.
The assay samples were separated from the remaining bulk samples and kept in separate areas in the sample storage facility prior to being dispatched to the laboratory.
Sample transportation
When the assay samples were ready for delivery to Set Point Laboratories in Johannesburg, the following documents were prepared:
> Sample delivery record
> Sample checklist
> Set Point sample submission record.
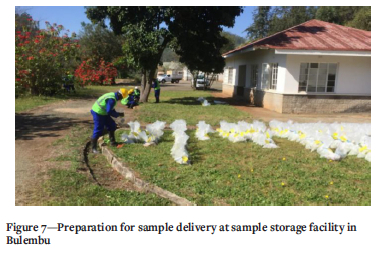
Before the transport truck arrived at the sample storage facility in Bulembu, the assay samples were taken out of the storage room and laid in sequence on the ground outside (Figure 7). The geologist and sampling assistants checked and counted the samples according to the sample checklist to ensure that everything was in good order.
The sample delivery record was signed by the geologist and the truck driver to confirm the record after all the samples were loaded onto the truck.
It took about 6 to 7 hours for the samples to be transported by road from Bulembu in Eswatini to Set Point Laboratories in Isando in South Africa.
After the samples were checked in at Set Point, the representative of the laboratory signed the sample delivery record and issued a sample receipt to confirm the safe and complete arrival of the samples.
Control samples
Control samples, including standard, blank, and duplicate samples, were inserted into the sample batches of tailings material and went through the normal assay procedures in the laboratory.
Both the standard and blank samples were purchased from African Minerals Standards (AMiS) in Johannesburg, which is an internationally certified laboratory providing CRMs to the mining industry.
The CRM used in the project was AMIS0389. It is very fine powder produced from the lumpy waste material of the Kroondal chrome mine in the western limb of the Bushveld Complex near Rustenburg in the North West Province of South Africa.
The blank samples were CRM AMIS0484. This is blank silica power made from silica sand.
The duplicate samples were prepared from the field assay samples by dividing one sample into two portions with two different identification numbers.
There is no uniform standard in the mining industry regarding the frequency of use of control samples. It varies from 15% to 25%, depending on the nature of the samples and the specific situation of the project. An overall insertion rate of 20% is in principle recommended and an acceptable average is 18% (Méndez, 2011).
The tailings materials at Havelock were processed and mixed more than once during the mining operations and were fairly homogeneous. This means that there was a low probability of high variation in the composition of the material, and thus a low probability of extreme abnormal values occurring in the assay results.
In practice, one blank sample was added to the first ten field samples. One standard sample was added to the next ten samples. A duplicate sample was added to the third batch of ten samples.
In the 1 254 assay samples prepared in the field, a total of 125 control samples, including 42 standard samples (AMIS0389), 42 blank samples (AMIS0484), and 41 duplicate samples, were inserted. This represented 10% control samples, which was held to be sufficient considering the homogeneity of the tailings facility of Havelock Mine.
During the assay processes, Set Point inserted 200 control samples into the field samples. In total, for the analysis of the 1 254 field samples, 325 control samples were used for QAQC purposes. This represents a 26% insertion rate, which is in line with best practice guidelines for the industry (Méndez, 2011).
Composition of tailings material
Prior to the exploration programme, a preliminary sampling project was carried out at the TSFs of Havelock Mine. Twenty-seven bulk samples were collected from shallow pits on the two tailings dumps. These samples were sent to Set Point for whole-rock chemical analysis and mineralogical characterization. The results are summarized in Tables II and III. These samples were not part of the exploration programme and are not included in the assessment of QAQC practice.
Chrysotile is the dominant mineral in the tailings, ranging from 36.18% to 53.86% with an average value of 46.66%. Lizardite, another member of the serpentine mineral group, is present between 7.72% and 18.71%, averaging 12.68%. Lizardite and chrysotile together constitute 59.34% of the mineral assemblage of the tailings material. This is in line with the ultramafic lithology of the host rocks of Havelock Mine.
Magnesite is also a major mineral in the tailings with a content of 6.95% to 28.48%, averaging 16.27%.
Minor minerals include talc (5.17% on average), dolomite (4.99%), chlorite (4.15%), diopside (3.86%), forsterite (1.8%), hornblende (0.18%), biotite (0.17%), quartz (1.08%), pyrite (0.20%), and magnetite (0.51%) (Table II).
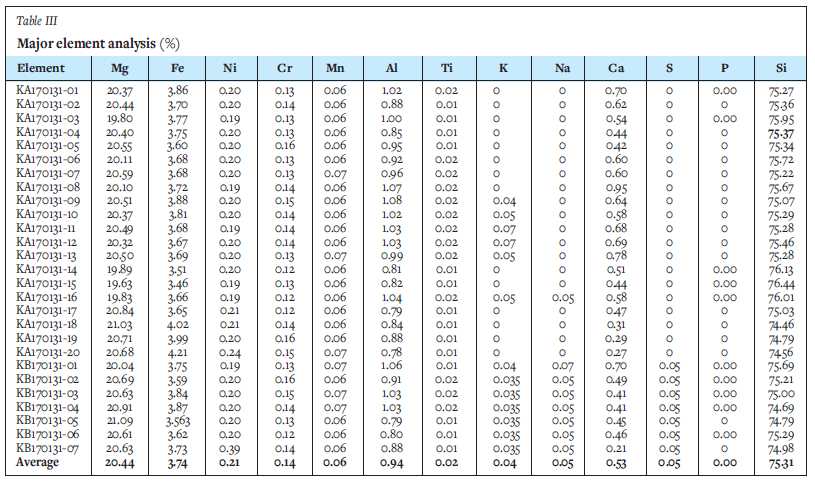
The results of the chemical analysis of the 27 bulk samples collected from the tailings facility are shown in Table III.
The dominant element is silicon (around 75%), followed by magnesium, accounting for over 20%, then iron, ranging from 3.46% to 4.21%.
Other major elements are present at very low levels of contents, such as nickel (average 0.21%), chromium (0.14%), manganese (0.06%), aluminum (0.94%), titanium (0.02%), potassium (0.04%), calcium (0.53%), sodium (0.05%), sulphur (0.05%), and phosphorus (0%).
Chemical analysis was also carried out for other trace elements, precious metals, and toxic elements. All of these elements had very low contents (at the ppm level), with little impact in respect of economic and environmental considerations.
Assay results of exploration programme
The purpose of the exploration programme at Havelock Mine was to assess the economic potential of the mineral resources contained in the TSFs and to produce a Resource estimation report. On the basis of the preliminary sampling project, it is concluded that, under current economic and technical conditions, the commodities that could be utilized economically from the tailings material are magnesium, iron, and nickel. Laboratory assays were carried out on the 1254 field samples for only these three elements.
Accuracy
Accuracy of the assay results was assessed through the use of standard samples which went through the same analysis procedures as the normal samples in the laboratory.
For this project, 42 standard samples (AMIS0389) were inserted into the field samples and submitted to Set Point for assay purposes. The results are shown in Table IV and Figure 8.
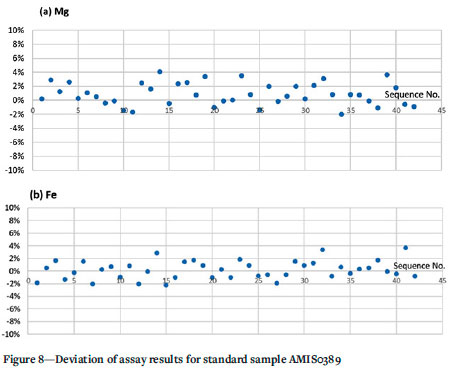
As can be seen, of the 42 assay results for magnesium of the standard samples (AMIS0389), the deviation of 41 results (97.62% of total samples) from the certified reference value (14.1834%) is within the range of ±4%. The highest deviation is 4.1%. The deviation of 31 samples (73.81%) is within the range of ±2%. This is an indication of the high accuracy of the magnesium assay results.
For iron, the deviation of all the results from the reference value (10.3655%) is within ±4%. Of these, 36 assays (85.71% of the total results) are within ±2%. Again, this indicates that the assay results produced by the laboratory are highly accurate.
There was no reference value for nickel in the AMIS0389 standard, and thus no comparison could be made.
Accuracy can be measured with quantitative parameters using statistical tools. According to Abzalov (2011), the following equation is a statistical test of assay accuracy:

where
M - Certified mean of a given standard sample
€L - Certified between laboratory standard deviation of a given standard sample.
m - Arithmetic mean of the replicate analyses of the standard sample
Sw - Estimated within-laboratory standard deviation of the replicate analyses of the standard sample included in assay batch
n - Number of replicate assays of a given certified standard in analytical batch
If the condition of Equation [1] is satisfied, the analytical results are considered acceptable with regard to accuracy (Abzalov, 2011).
The statistical parameters of the assay results for magnesium and iron in the standard sample (AMIS0389) (Table IV) are summarized in Table V.
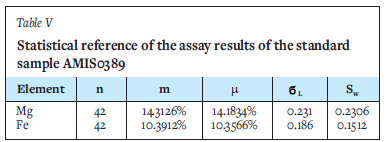
Then, for magnesium, the result is:

For iron, the result is:
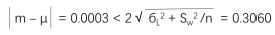
The above statistical tests indicate that the assay results for magnesium and iron in the standard samples (AMIS0389) satisfy the condition of Equation [1] and are acceptable in terms of accuracy.
Precision
Precision refers to the random measurement error. It is a reflection of the repeatability and consistency of the test work in the laboratory. It is assessed through the repeated assay of the same sample.
In the Havelock exploration programme, 41 duplicate samples were provided to the laboratory for analysis. The results are shown in Table VI and Figure 9.
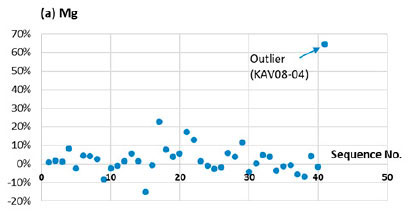


For the assay results of magnesium, 35 of the 41 field samples, (85.37% of the duplicate samples) show a difference between the original and duplicate assay within the range of ±10%. Four samples (9.76%) show a difference between ±10% and ±20%. One sample (2.44%) has a difference of 22.77%, and another a difference of 64.36% (Figure 9a).
The assay results for iron demonstrate a similar pattern. Among the 41 field samples, 36 (87.80% of the total duplicate samples) indicate a difference between the original and duplicate assay within the range of ±10%. Four samples (9.76%) demonstrate a difference between ±10% and ±20%. One sample (2.44%) has a difference of 73.13% (Figure 9b).
The assay results for nickel also have a similar pattern. Of the 41 field duplicate samples, 34 samples (82.93%) show a difference between the original and duplicate assay in the range of ±10%. Five samples (12.20%) indicate a difference between ±10% and ±20%. One sample (2.44%) has a difference of -23.38%, and another a difference of 57.91% (Figure 9c).
The results for the three major elements (magnesium, iron, and nickel) indicate that the original and duplicate assay results have a reasonably good match. Over 80% of the difference between the original and duplicate assays is within the range of ±10%. One sample (KAV08-04) demonstrates an erratic mismatch between the original and duplicate values for magnesium, iron, and nickel and these results are clearly outliers (Abzalov, 2011), indicating a possible error in the test work. This sample was rejected for the QAQC assessment.
Various statistical methods can be used to assess the precision of the assay results of paired samples, such as a scatter plot and a HARD plot, Q-Q plot, and reduced-major-axis (RMA) plot (Stanley and Lawie, 2007; Abzalov, 2011, 2016; Scogings and Coombes, 2014).
Several authors have suggested the use of the average coefficient of variation (CV) as the universal measure of relative precision error in geological applications (Stanley and Lawie, 2007; Abzalov, 2008, 2011). The average CV is considered to be an unbiased estimate of the random measurement error.
The CV is the ratio of the standard deviation to the mean, usually expressed as a percentage:

The CV is a statistical measure of the dispersion or variation of data-points in a data series around the mean. The lower the CV value, the less the variation.
The CV for the pairs of assay results of duplicate samples can be calculated using the following equation (Abzalov, 2008, 2011)

where
ai - Value of the original sample
bi - Value of the duplicate sample
N - Number of the duplicate sample
The average CVs for magnesium, iron, and nickel, based on the assay results of 40 duplicate samples, are shown in Table VII.
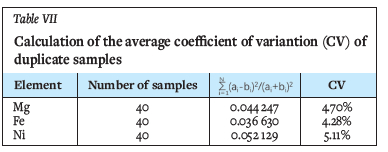
The average CV is 4.70% for magnesium, 4.28% for iron, and 5.11% for nickel.
The acceptable level of precision error (CV%) for sample assays in the mining industry is mostly between 10% and 30%. The best practice is in the range of 5% to 10% (Table VIII; Abzalov, 2011).
In comparison, the precision error of the assay results from the exploration programme at Havelock Mine is among the lowest in the industry.
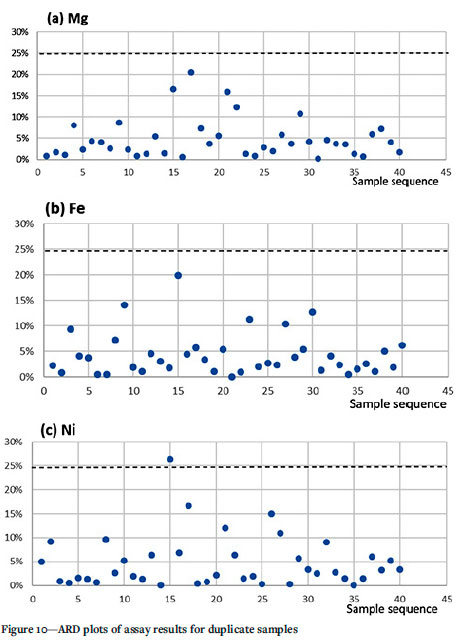
Another simple statistical tool to assess the precision of duplicate assays is the absolute relative difference (ARD) between the original and duplicate values (Rossi and Deutch, 2014)

where
a - Original value
b - Duplicate value
For proper resource estimation, if 90% of the ARD of the field duplicate samples is equal to or less than 25%, the precision error of the assay results is acceptable (Rossi and Deutch, 2014).
In the case of Havelock, all of the ARD values for magnesium and iron are less than the 25% acceptance criterion. For nickel, only one sample's ARD (26.47%) is more than 25%. The other 39 samples (97.5% of the total) have an ARD of less than the 25% criterion. This indicates again that the quality of sample assay results, in terms of precision, is in line with best practice in the mining industry (Table IX, Figure 10).
Contamination
Contamination could occur at any stage of the testing processes in the laboratory, from sample preparation to analysis. Contamination is assessed through blank samples, which are basically barren samples with little or no content of the elements of interest.
Where there is a low content of the relevant element, a slight change in the assay results will exaggerate the deviation of the reported value from the original reference value because of the sensitivity of the low value to any changes. As a general practice in the mining industry, if the assay results for blank samples yield values of the relevant elements less than three times the detection limits or the reference values of the analysed elements, the level of possible contamination is within the acceptable range (Méndez, 2011; Rossi and Deutch, 2014)
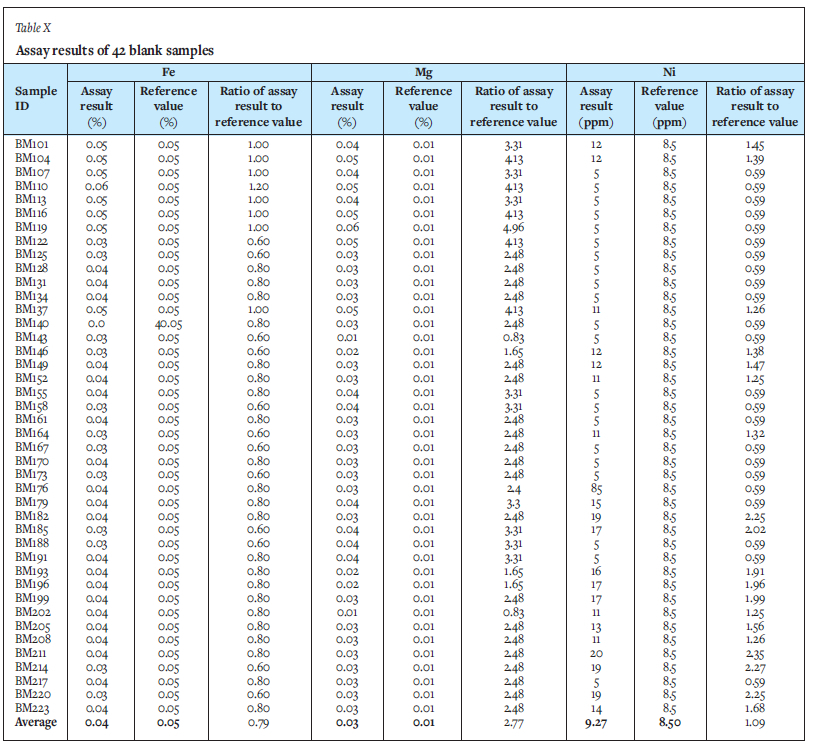
For the Havelock exploration project, 42 blank samples (AMIS0484) were inserted into the sample batches for the assay process. The blank sample consisted of silica power with a composition of 99.15% SiO2, 0.02% MgO (0.01% Mg), 0.03% Fe2O3 (0.02% Fe), and 8.5 ppm nickel. The results are summarized in Table X.
As can be seen, all the assay results for iron in the blank samples are at the same level as the certified reference value. For nickel, all of the 42 blank samples demonstrate an assay result less than three times the reference value.
For magnesium, the results of 27 samples (64.3% of the total) are less than three times the certified reference value, 9 samples (14.5%) yield values of between three and four times the reference value, and 6 samples (14.3%) show values larger than four times the reference value.
Overall, the assay results for the blank samples indicate that the level of possible contamination during the laboratory analytical process for the Havelock exploration project is well within the acceptance criteria.
Homogeneity
The TSFs at Havelock Mine contain the waste materials from past mining operations. These materials underwent various production processes and were disposed of at the final stage. The waste materials are therefore well mixed and relatively homogeneous.
During the exploration programme, 1 254 samples of the tailings material were collected from the drill-holes and submitted for assay.
The statistical features of the sample assay results are summarized in Table XI and Figure 11.
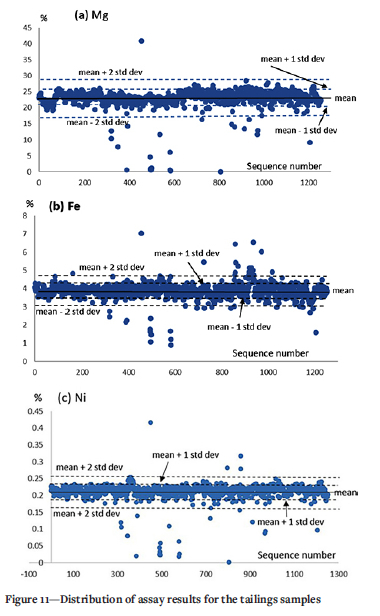
These results indicate that contents of magnesium, nickel, and iron in the samples are all concentrated around the mean values of the respective elements, with relatively low variance and standard deviation. For magnesium and nickel, 92% of the assay values are within the scope of the mean ±1 standard deviation, And 85% of the iron value are also within this range.
To demonstrate the changes in values of the elements in a vertical direction, the sample assay results for magnesium were plotted along the drill-holes (Figure 12). The results indicate that there is no major variation with depth in terms of magnesium content. From the top to the bottom of the drill-holes, with a depth of 50 to 130 m, the content of magnesium is relatively constant.
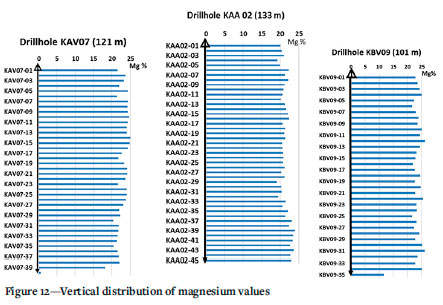
The distributions of iron and nickel contents with depth in the drill-holes show a similar trend.
This again indicates the homogeneity of the tailings material at Havelock Mine.
Resource statement
The aim of the exploration programme, together with the QAQC policy and practice, was to make a proper assessment of the economic potential of the TSFs at Havelock Mine. The assay data provided a good foundation for generating a suitable statement for the project.
A reputable consultancy in the mining industry of South Africa, Minxcon (Pty) Ltd, was contracted to compile an independent Competent Person's report for Kobolondo Mining. Taking into account the relevant factors affecting the reasonable prospects for eventual economic extraction (RPEEE) of the Mineral Resources in the TSFs of Havelock Mine, such as mining costs, market conditions, infrastructure, and technology, it was concluded that the entire tailings materials contained in the two dumps should be included in the Resource estimation with no cutoff grade applied. The result is demonstrated in Table XII.
The TSF Mineral Resource of 5.83 Mt of magnesium metal is predominantly (93%) in the Indicated category, based on the quality and quantity of data. This represents a significant source of magnesium in the western world and could become a meaningful supply to the global magnesium industry when the project is eventually brought into production.
Iron (Fe) and nickel (Ni) were estimated but have not been included in the Mineral Resource at this stage as it is not clear whether both Fe and Ni could be extracted economically. From the estimation, the grades of Fe and Ni are 3.9% and 0.21%, respectively. Potentially, the 1 Mt of iron metal and 53 000 t of nickel metal contained in the TSFs of Havelock Mine could be upgraded to Mineral Resources if the processes to extract the two metals become viable.
Discussion and conclusion
QAQC plays a vital role in mineral exploration and resource estimation, and requires dedicated policies and working protocols to safeguard the whole process of exploration, sampling, and assaying.
The use of standard reference materials, i.e., standard, duplicate, and blank samples, is essential to monitor and assess the performance of QC practice in terms of accuracy, precision, and potential contamination affecting the reported analytical data.
The sampling protocol applied during the exploration of the TSFs of Havelock Mine has proved to be effective and appropriate as far as QC is concerned. The assay results of the tailings samples yielded good-quality values as regards precision and accuracy of the analytical data, which provides a solid basis for resource estimation.
Acknowledgements
The exploration programme on the TSFs at Havelock Mine was initiated and managed by Kobolondo Mining. The relevant governmental authorities of Eswatini provided support in various ways for the project. Bulembu Ministries Eswatini was helpful in offering convenience and logistical support to the exploration work. The authors wish to express gratitude to all the parties involved in the project for their cooperation and assistance extended in the fieldwork.
Our thanks are also due to the language editor of the University of South Africa for improving the quality of the manuscript.
The comments and suggestions from the two anonymous referees have helped to improve the manuscript of the paper.
References
Abzalov, M.Z. 2008. Quality control of assay data: A review of procedures for measuring and monitoring precision and accuracy. Exploration and Mining Geology, vol. 7, no. 3-4. pp. 131-144. [ Links ]
Abzalûv, M.Z. 2011. Sampling errors and control of assay data quality in exploration and mining geology. Applications and Experiences of Quality Control. Ivanov, O. (ed.): InTech. https://www.intechopen.com/books/applications-and-experiences-of-quality-control/sampling-errors-and-control-of-assay-data-quality-in-exploration-and-mining-geology pp. 611-644. [ Links ]
Abzalov, M. 2016, Quality control and assurance (QAQC). Applied Mining Geology. Modern Approaches in Solid Earth Sciences, vol. 12. pp. 135-159.: https://doi.org/10.1007/978-3-319-39264-6_10 [ Links ]
Anhaeusser, C.R. 1974. The nature of chrysotile asbestos occurrences in Southern Africa - A review. Information Circular no .90, Economic Geology Research Unit, University of the Witwatersrand, Johannesburg. [ Links ]
Anhaeusser, C.R. 2012. The history of mining in the Barberton greenstone belt, South Africa, with an emphasis on gold (1868-2012). Proceedings of the 9th International Mining History Congress, Johannesburg, pp. 1-29. [ Links ]
Barton, C.M. 1982. Geology and mineral resources of northwest Swaziland (Barberton greenstone belt). Swaziland Geological Survey and Mine Department. 97 pp. [ Links ]
ISO. 1994. ISO8402. Quality management and quality assurance - Vocabulary. International Organization for Standardization, Geneva, Switzerland. [ Links ]
JCGM. 2008. GCGM200, International vocabulary of metrology - Basic and general concepts and associated terms (VIM).: https://www.bipm.org/utils/common/documents/jcgm/JCGM_200_2008.pdf [ Links ]
Jourdan, P. 1990. The minerals industry of Swaziland. IMR Open Report no. 104. Institute of Mining Research, University of Zimbabwe. 9 pp. [ Links ]
Kohler, I. and Heubeck, C. 2019. Microbial-mat-associated tephra of the Archean Moodies Group, Barberton greenstone belt (BGB), South Africa: Resemblance to potential biostructures and ecological implications. South African Journal of Geology, vol. 122, no. 2. pp. 221-236. [ Links ]
Méndez, A.S. 2011. A discussion on current quality-control practices in mineral exploration. Applications and Experiences of Quality Control. Ivanov, O. (ed.). pp. 595-610. InTech. https://www.intechopen.com/books/applications-and-experiences-of-quality-control/a-discussion-on-current-quality-control-practices-in-mineral-exploration [ Links ]
Rossi, M.E. and Deutch, C.V. 2014. Mineral Resource Estimation. Springer. [ Links ]
Runje, B., Novak, A.H., and Razumic, A. 2017. Measurement system analysis in production process. Proceedings of the XVII International Scientific Conference on Industrial Systems (IS'17). pp. 274-277. https://iim.ftn.uns.ac.rs/is17/papers/49.pdf. [ Links ]
Scogings, A. and Coombes, J. 2014. Quality control and public reporting in industrial minerals. Industrial Mineral, September 2014. pp. 50-54 [ Links ]
Stanley, C.R. and Lawie, D. 2007. Average relative error in geochemical determinations: Clarification, calculation, and a plea for consistency. Exploration and Mining Geology, vol. 16, no. 3-4. pp. 265-274. [ Links ]
Surbhi, S. 2019. Difference between quality assurance and quality control.: https://keydifferences.com/difference-between-quality-assurance-and-quality-control.html [ Links ]
 Correspondence:
S. Gan
Email: shengfeig@outlook.com
Received: 29 Apr. 2021
Revised: 22 Dec. 2021
Accepted: 23 May 2022
Published: July 2022

