


Servicios Personalizados
Articulo
 Inglés (pdf)
 Articulo en XML
 Referencias del artículo
Indicadores

Links relacionados
-
 Citado por Google
 -
 Similares en Google
Compartir

 Permalink
Journal of the Southern African Institute of Mining and Metallurgy
versión On-line ISSN 2411-9717
versión impresa ISSN 2225-6253
J. S. Afr. Inst. Min. Metall. vol.121 no.8 Johannesburg ago. 2021
http://dx.doi.org/10.17159/2411-9717/1387/2021
PROFESSIONAL TECHNICAL AND SCIENTIFIC PAPERS
PlatMine pillar strength formula for the UG2 Reef
B.P. WatsonI; R.A. LamosII; D.P. RobertsIII
IUniversity of Witwatersrand, South Africa. https://orcid.org/0000-0003-0787-8767
IIMine Support Consultants, South Africa
IIISibanyestillwater, South Africa. https://orcid.org/0000-0002-7517-4836
SYNOPSIS
The Upper Group 2 (UG2) chromitite reef is a shallow-dipping stratiform tabular orebody in the South African Bushveld Complex, which strikes for hundreds of kilometres. Mining is extensive, with depths ranging from close-to-surface to 2 500 m. Pillars are widely used to support the open stopes and bords. Little work has been done in the past to determine the strength of pillars on the UG2 Reef and design was done using formulae developed for other hard-rock mines. This has led to oversized pillars with consequent sterilization of ore. In this paper we describe a back-analysis of stable and failed UG2 pillars on the Bushveld platinum mines, and provides a strength formula for UG2 pillars. The formula may be used cautiously on all Bushveld platinum mines with similar geotechnical, geometrical, and geomechanical conditions to the pillars in the database.
Keywords: UG2, pillar strength formula, chromitite, back-analysis.
Introduction
The Bushveld Complex in the northern part of South Africa is a large layered igneous intrusion, which spans about 350 km from east to west (Figure 1). The platinum group metals are concentrated in two planar, shallow-dipping orebodies (reefs):
> The Upper Group 2 (UG2), chromitite seams
> The Merensky Reef, a mineralized pegmatoidal pyroxenite.
The Merensky Reef overlies the UG2 Reef, and the width of both ranges between 0.7 m and 1.5 m.
The strata generally dip at 8° to 15° toward the centre of the Complex, with a horizontal to vertical stress ratio (¿-ratio) ranging from about 0.5 to over 2.5. The depth of mining ranges from outcrop to 2 500 m. Generally, the lower ¿-ratios are a feature of deeper level reefs.
In the depth range from surface to about 1 400 m, the vertical tensile zone often extends high into the hangingwall (roof). If the mining span is sufficiently large, or the stope abuts a geological feature, a large volume of hangingwall rock can become unstable, resulting in a stope collapse, or colloquially, a 'backbreak' (Roberts et al., 1997). In order to prevent these backbreaks, a high-resistance support system is required. This is universally achieved using in-stope pillars. Conventional mining makes use of crush or yielding chain-pillars between 30 m wide panels. These pillars are oriented either on strike for breast mining (Figure 2) or on dip for up- and down-dip mining.
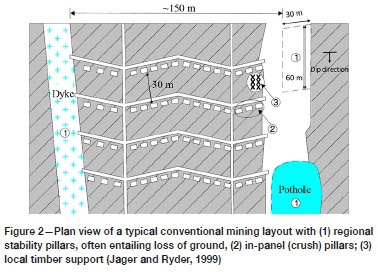
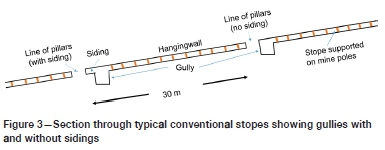
The in-panel pillars shown in Figure 2 are for a breast mining configuration, meaning that the faces are advanced on strike. These in-panel pillars are often located 1.5 m to 2.0 m below a gully (Figure 3) used to assist with ore removal to the boxholes or local orepasses. The zone between the gully and the pillar is termed a siding (Figure 3). Some mines do not make use of sidings (Figure 3), so that the inpanel pillar is higher on the gully side than on the panel side. Gully heights vary between 1.8 m and 2.5 m. Thus, typical pillars under these conditions could have a height of 2.3 m on the up-dip side and 1.5 m on the down-dip side.
Mechanization of the platinum mines has resulted in an increase in bord-and-pillar mining, particularly in the newer, shallow-depth mines on the eastern side of the Bushveld Complex. The Hedley and Grant formula (Hedley and Grant, 1972), developed for Canadian uranium mines, has become the industry accepted method for designing hard-rock pillars in shallow hard-rock mines in South Africa (Malan and Napier, 2011). This equation has been employed to design pillars on the UG2 Reef for many years, using a downrated k-value of 35 MPa, which is about a third of the uniaxial compressive strength (UCS) of the pillar material (Malan and Napier, 2011). However, the formulation of the equation is based on a large number of unproven assumptions, and its application to the design of pillars in the Bushveld Complex is questionable (Malan and Napier, 2011). A potential consequence of using this uncertain methodology is to cut oversized pillars, which lowers the extraction ratio.
In order to remedy the lack of certainty in pillar design on the UG2 Reef, research was carried out to determine a pillar formula particularly suited to the reef. A maximum likelihood (ML) back-analysis study was conducted on failed and stable pillars, and a strength formula was developed for the UG2 Reef on the western side of the Bushveld Complex.
With the exception of pillars affected by thrust structures or weakened due to weathering, no failed pillars were available in the UG2 bord-and-pillar workings for the database. It was therefore necessary to assess pillars mined in the conventional stopes, where much larger spans were mined on either side of the pillars. In many instances, sidings were not left adjacent to the pillars, therefore pillar heights needed to be adjusted in the database to account for these gullies.
The CSIR in South Africa was sponsored by platinum mining companies and the government to conduct research that would improve mining conditions on the platinum mines. The reports that were produced by the PlatMine research collaborative belong to the sponsors, and there was a restriction (now expired) on publications for a period of five years. The back-analyses work described in this report was done under PlatMine 1.2 (Watson et al, 2007) and completed in 2007.
Data collection procedures
Site observations
The in-situ dimensions of the evaluated pillars were measured directly and the presence/absence of sidings adjacent to pillars was evaluated in the same way as described in Watson et al. (2008). Pillar conditions were documented according to the following scale of condition codes (CC):
> 5: Pillar heavily damaged, date/geometry at failure not accurately known
> 4: Pillar presumed failed, date/geometry at failure not accurately known
> 3: Pillar definitely failed (or burst), date/geometry at failure known
> 2: Pillar sidewalls visibly fractured/scaled, date/geometry known
> 1: Pillar sidewall scaling barely visible, date/geometry known
> 0: Pillar with no visible damage, date/geometry known.
Pillars with CC 3 were the most directly relevant for back-analysing strength parameters, but no pillar bursts occurred that could be used to determine the date (and therefore the mining configuration) on which failure took place. Therefore, no CC 3 pillars are in the database. The evaluations relied heavily on visual observations, and therefore CC 0 to CC 2 (unfailed) and CC 4 to CC 5 (failed) pillars were lumped together in the strength analysis, i.e., pillars were either unfailed or failed. The pillars classified as CC 4 and CC 5 had failed at face positions that were different to when the observations were made, hence the face positions used in the numerical models would have resulted in an over-estimation of the stress condition at failure.
Pillar load estimation
Pillar loads were estimated using pseudo-3D, elastic, boundary displacement-discontinuity element modelling software, MinSim (COMRO, 1981) and MINF (Spottiswoode and Milev, 2002). Mine plans were digitized, capturing - in each instance - an area large enough to provide realistic stress conditions. Usually, these conditions were inferred by direct modelling and subsequent elimination of superfluous abutting mining windows. In many cases, it was necessary to estimate a correction factor (CF), based on a comparison of coarse-grid average pillar stress (APS) values on large pillars near the areas of interest, with and without a large flanking area of mining. Such factors were generally less than 1.2 (20% correction), and were, where feasible, checked using Equation [1] (Ryder et al., 2005). This equation may be used if there is a large area of mining with roughly uniform convergence S over a sector bounded by radii R1and R2 (Figure 4).
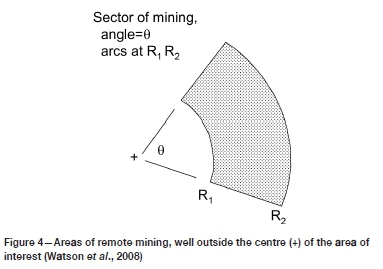
where σzzis the stress resulting from a large area of mining, S = (E*S/q) is the normalized average convergence in this region, where S is the convergence and q is the virgin vertical stress. E = E/4(1-v2) where E is the Young's modulus and v is the Poisson's ratio.
If, for example, the right-hand side of Equation [1] evaluates to 0.2, then the driving stress on the area of interest (and all calculated convergence or APS values) need to be increased by 20%.
A grid size of 0.5 m was used in order to adequately capture true pillar dimensions in the area of interest (Napier and Malan, 2011). The modelling results were validated, where possible, by analytic solutions and by comparing MinSim and MINF results. Discrepancies of less than 10% in APS values were determined from the comparisons. An average rock density of 3000 kg/m3 was assumed in all cases, and pillar stresses were calculated based on depth of cover, extent of mining around the pillar, and the size of the pillar. The effects of adjacent pillars and abutments were also considered in the models.
Generally, a series of modelling runs was carried out. In the first run, all small pillars were modelled as intact structures. In the second run, any pillars carrying more load and being smaller than observed failed pillars in an area of interest were deemed to have failed, assigned a CC of 4 or 5, and allocated a residual stress of 20 MPa as suggested by Watson et al. (2007) and Roberts et al. (2005). This procedure was repeated until no further pillars fulfilled the failure criterion. The limit equilibrium model suggested by Napier and Malan (2012) has a number of parameters to calibrate, but for the purposes of the back-analysis it was more efficient to simply reduce the pillar strengths to 20 MPa, so that the stress could be appropriately redistributed to the intact pillars.
In the analysis, where necessary, an 'effective height' (he) was calculated to allow for the presence of gullies unprotected by sidings (Figure 3) using Equation [2]. The correction is based on numerical modelling by Roberts et al. (2002).

where w and h are the pillar width and mining height respectively, and hgis the gully vertical height. As a typical example: the effective height (in terms of expected strength) of a siding-less pillar with a gully vertical height of 2.3 m increases from 1.5 m to about 1.9 m.
The effective pillar width (we) accounts for rectangular pillars, taking cognisance of pillar length (L), according to the widely used 'perimeter rule', described by Wagner (1974):

Note that this rule leads to considerable increases in pillar we, ranging up to near doubling of effective width for very long rectangular pillars.
Strength parameter estimation
The strength of a pillar may be assumed to be a function of its known physical characteristics (including width, height, length), and certain unknown parameters (e.g., Salamon and Munro, 1967: K, a, ß values). An ML analysis was used to estimate a best fit for these parameters. This type of statistical back-analysis accounts for the many variables that contribute to pillar strength without necessarily needing to understand the failure mechanisms. The process involved the evaluation of a database of APS values calculated by MinSim (COMRO, 1981) where the 'condition', i.e., 'intact' or 'failed', was known.
Following the approach of Salamon and Munro (1967), the SF of each pillar was defined by:

A probabilistic distribution of SFs governs the condition of pillars, in the sense that a pillar with SF>1 is likely to be intact, while one with SF<1 is likely to have failed. A lognormal distribution was assumed for the SFs, having a log-mean of zero and standard deviation of S. With this formulation, physically meaningless negative SFs are disbarred, and reciprocal symmetry pertains, e.g., a pillar having SF = 0.5 is about as likely to have failed as one with SF = 2 is to have not failed. The logarithmic standard deviation was assumed to account for all uncertainties in the system of pillars, e.g., mismeasurement of widths, misestimating of pillar APS values, real geotechnical variations in pillar properties, etc. For historical reasons, logarithms to base 10
are used in the lognormal distribution of SFs, and to interpret S, 10+sneeds to be evaluated in relation to unity. The value of S is a parameter that the ML analysis must estimate along with the unknown parameters governing the strength of the pillars in a given data-set.
A 'likelihood function' (Li) of the probability of the pillars exhibiting their stipulated condition ('intact' or 'failed') was set up. The logarithm (base e) of Li was used so that the function F was defined as:
The probability of an intact case (condition codes CC = 0, 1, or 2 in this study) was given by f (log SF) where f is the cumulative normal distribution of SFs. Such cases biased the derived best parameter fits so that their SFs were as large as possible.
The probability of a failed case in which the APS value was the estimated load at which failure occurred (the situation in Salamon and Munro's (1967) back-analysis, and CC=3 in the present study) was not used as there were no pillars where the actual stress at failure could be determined. The function f(log SF)/SF, where f is the normal probability density function of SFs, would have been used in these instances.
The probability of a failed case where the APS was merely an upper bound and failure probably took place earlier at some lower APS value (the situation in many of the back-analysis scenarios where CC = 4 or 5) was expressed by the function 1 - f (log SF). This is analogous to the treatment of intact cases and biased the best-fit parameters so that the SFs were as small as possible. Thus, the ML analyses included the presence of stable cases having low SFs and the failed cases. Equation [5] could thus be rewritten as follows:
Validation of the numerical models used to estimate pillar loads (APS)
A system of regularly spaced, stable, Merensky Reef rib pillars at a mine on the western side of the Bushveld (western limb) provided an unusual quasi-2D situation where the numerical models could be validated against an analytic solution. Figure 5 depicts the geometry of this control site.
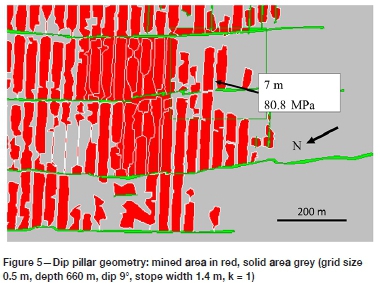
A 7 m wide by 1.4 m high dip pillar, with 28 m mined-out panels on either side, was observed in situ to be just beginning to scale (CC=1). The APS provided by the MinSim model was 80.8 MPa. This result compared favourably with an analytic estimate of 82 MPa using tributary area theory.
Data collection sites
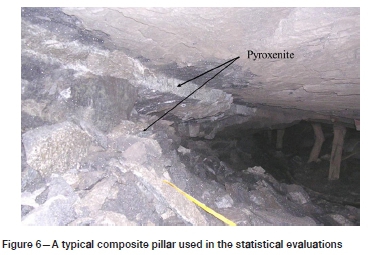
Data on failed and unfailed pillars was collected from a total of four sites at three separate mines near the town of Thabazimbi (see Figure 1) for ML regression analyses. The pillars were composite, consisting mainly of chromitite with one or two narrow pyroxenite bands of variable width above the pillar centre (Figure 6). The immediate hangingwall and footwall (floor) materials were pyroxenite and anorthosite, respectively.
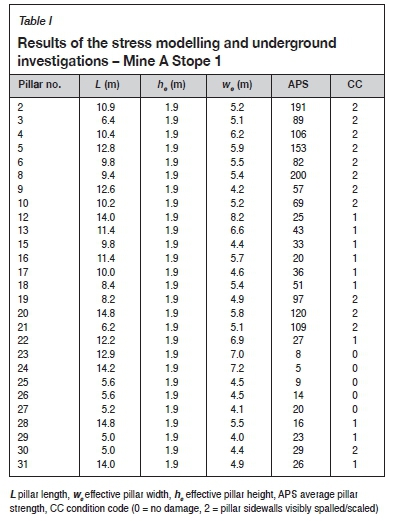
Mine A - Stope 1
Except for the mining of one panel at the bottom of the stope on the south-west side (Figure 7), all mining activities in this area were completed some years prior to the investigation. Time-dependent rock mass deformation may have resulted in pillar failures occurring at loads lower than the original strength of the pillars. Substantial remnants were left on the previously mined Merensky horizon above the UG2 workings, both to the southwestern and northern limits of the investigation site (middling 20 m), and these remnants are shown as dashed lines in Figure 7. The dip of the orebody is 18°.
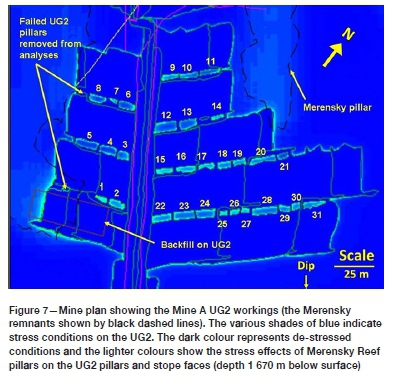
During the investigations, it was apparent that seismic events had caused minor damage to the south-west side of the stope. The events may have resulted in premature pillar failure and excessive slabbing on the sides of pillars. Two pillars had obviously failed, and were therefore included in the model with a residual strength of 20 MPa.
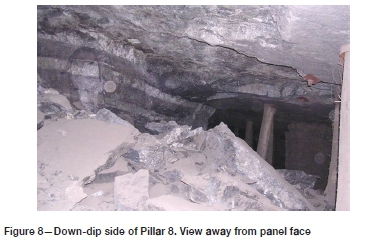
Pillar 1 (Figure 7) was wedge-shaped, and the south-west side of the pillar was crushed. However, the wider end had caused hangingwall damage, and was obviously carrying a significant load. In addition, Pillar 2 caused hangingwall damage from about its mid-point towards the south-west (Figure 7). Pillar 8, on the west side of the stope and close to the overlying Merensky abutment (Figure 7), suffered a strain-burst after mining and ore removal had been completed in the stope (Figure 8). It was assumed that the peak strength of this pillar was almost reached when the stope reached its mining limits.
Blast-hole sockets in the access excavations suggested a k-ratio of 0.5 (Watson et al., 2006). The depth of the workings was 1 670 m below surface, and the standard average rock density of 3000 kg/m3 was assumed in the model. The results of the modelling and underground investigations are shown in Table I. Note that corrections for gullies and pillar length were applied to the width and height calculations. The low stresses on some pillars shown in Table I were due to the de-stressing effects of the pre-mined Merensky Reef.
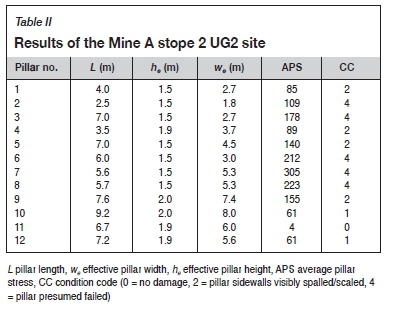
Mine A - Stope 2
The stope shown in Figure 9 had been mined out several years before the investigation and no mining was being done in the area at the time of the evaluation. Both the 4E and 5E panels were backfilled and sidings were left adjacent to most of the pillars. A large remnant on the previously mined Merensky horizon was situated over the area of interest (dashed line in Figure 9). Pillars on the UG2 horizon were in various stages of failure and poor hangingwall conditions persisted above the 5E advanced strike gully (ASG), immediately below the Merensky remnant. A large UG2 pillar was left below the Merensky remnant, because of poor mining conditions experienced in the 4E panel (Figure 9). The middling between the two reefs was 20 m.
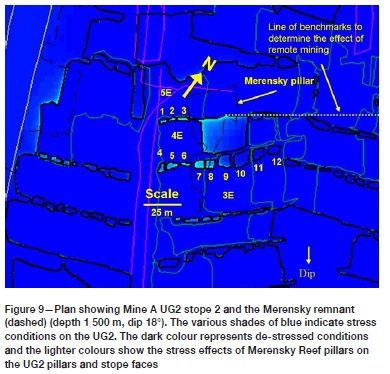
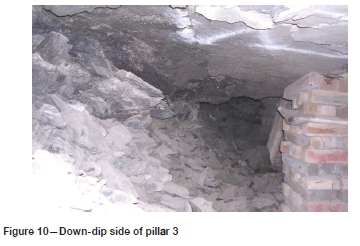
Pillars 2, 3, 6, 7, and 8 (Figure 9) were highly fractured (Figure 10) and between 70 mm and 200 mm of closure was estimated from adjacent mine poles. These pillars were obviously in an advanced stage of crushing. Pillar 1 and 4 (Figure 9) were also heavily fractured but fracturing in the hangingwall adjacent to the pillars suggested that the cores were still intact.
The effects of Merensky Reef remote mining could not be directly established in a single model with a grid size of 0.5 m.
The final model was corrected for external mining (outside the model window) by means of a factor, which was determined from secondary MinSim modelling using a larger grid size. The correction factor was established on the assumption of no mining having occurred on the UG2 horizon. Two 1 m grid models were run, covering the whole mine and the area of interest, respectively. A line of benchmarks located on the UG2 horizon in the area of interest (Figure 9) was used to interrogate the effects of the Merensky abutment in both models. The results from the benchmark points showed that the remote Merensky mining provided an additional 20% load to the area of interest (CF = 1.20). The contribution of the limited UG2 mining outside the area of interest was not included in the analyses, but the effects are expected to be less than 5%, due to the de-stressing effects of the extensive mining on the Merensky Reef above. The results of the investigation are provided in Table II. None of the pillars had burst subsequent to sweeping operations. The date at which these pillars failed is therefore unknown and no CC3 pillars are recorded.
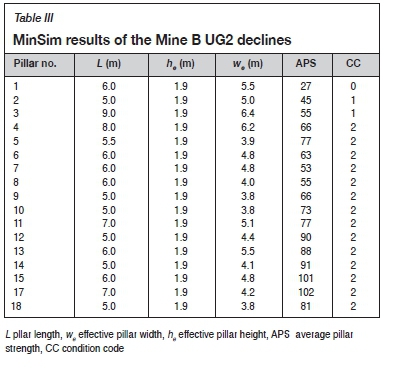
Mine B declines
The stope shown in Figure 11 was mined out several years before the investigation. The overlying Merensky Reef was mined out prior to the UG2 workings. A collapse occurred on the UG2 horizon in the two panels, shown in the figure (green outline), when the up-dip panel reached a position about halfway under the Merensky pillar (grey outline). In the down-dip panel, the collapse was bounded by a shear plane (black line). The middling between the two reefs was 34 m. The direction of mining in the lower panel is shown by the arrow.
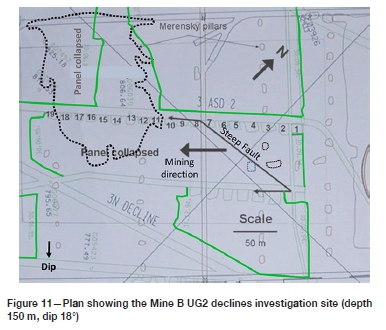
Referring to Figure 11, a progression of pillar failure was observed:
> No fracturing on pillar 1
> Minor fracturing on the corners of pillars 2 and 3
> Significant fracturing to a depth of about 100 mm, from the original sidewall, on Pillar 4
> Large-scale slabbing and minor hangingwall damage on pillar 5
> A high degree of damage on pillars 6 and 7.
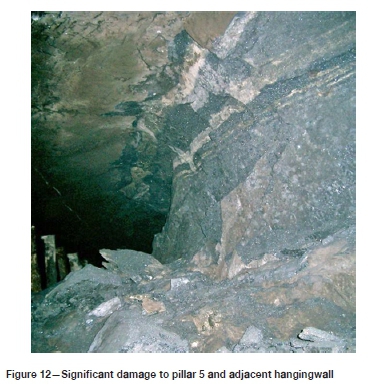
Figure 12 shows the condition of pillar 5, suggesting that the pillar was highly stressed.
The results of the numerical modelling and underground investigations are shown in Table III. No sidings were left, so corrections to the height and width were made to account for the additional height on the one side of the pillar and the pillar length, respectively.
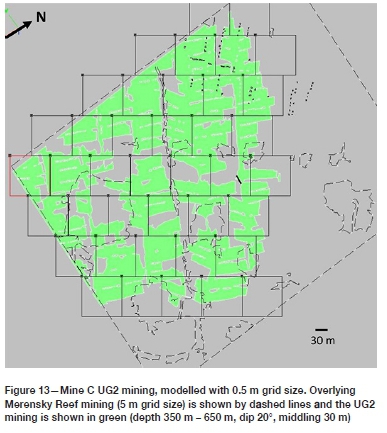
Mine C
The Merensky Reef was mined many years before the UG2, and some remnant pillars were left on the Merensky horizon. The middling between the two reefs is about 30 m. Subsequent mining of the UG2 Reef occurred under some of these remnants, providing, in some cases, both solid and crush pillars in a single panel. The condition of the recorded UG2 pillars was determined from visual observations. Thirty of these pillars were very heavily damaged and presumed failed. Modelled elastic stresses on the UG2 pillars ranged up to several hundred MPa due to the presence of extensive Merensky over-mining and scattered stress-concentrating remnants. The modelled geometry is shown in Figure 13. Each square represents a separate model.
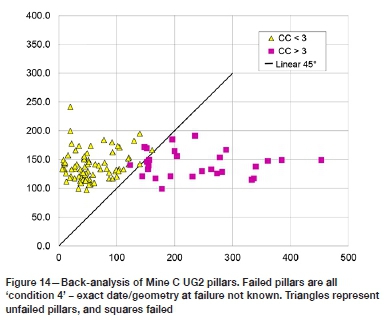
Pillar size measurements were not made underground at this site. Scaled measurements were determined from plans. Some degree of uncertainty regarding the accuracy of the pillar dimensions on the plans necessitated a preliminary ML back-analysis to determine the value of the data. The analysis provided a good separation between failed and stable pillars (Figure 14), and the data was considered useful with only a few outliers. Although the effective pillar height was limited to about 1.9 m there was a significant range in width and length, providing a variety in (w/h)econtribution of between 1.2 and 4.7. The database of pillars from Mine C is provided in Appendix A.
The site was re-modelled using larger (and therefore fewer) MinSim windows, and a larger Merensky area (to account for remote mining), and the failed pillars on the UG2 elevation were replaced with a 20 MPa material. 111 pillars were added to the investigations.
Maximum likelihood evaluation
Database description
The total database consisted of 167 pillars, 134 of which represented modelled stresses at some value below the best-fit strengths, and 33 provided stresses somewhat higher than the strengths. Most of the pillar (w/h)eratios ranged between 1.5 and 4, with the largest proportion being between 2.0 and 3.0 (Figure 15). No data was available below 1.1 or greater than 4.7.
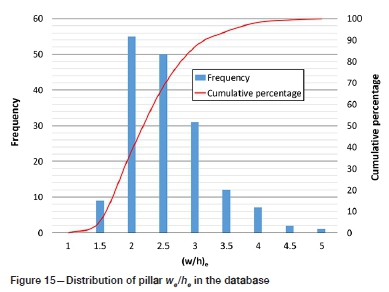
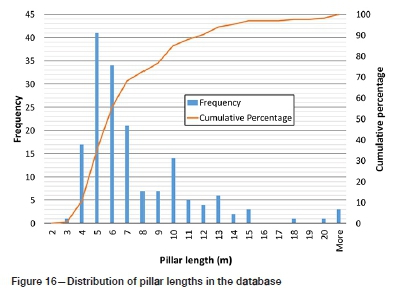
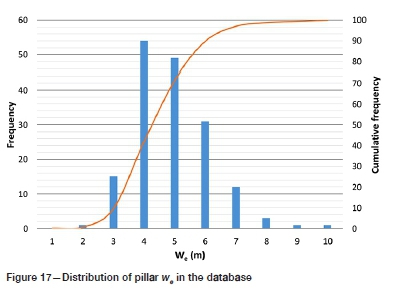
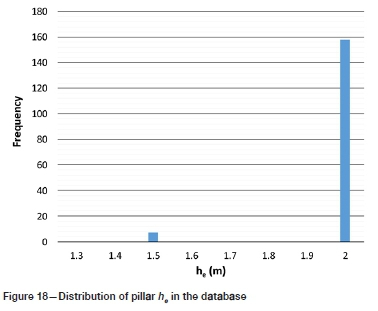
The data-set included a wide range of pillar lengths (Figure 16) and we(Figure 17), but hefell into the limited range between 1.5 m and 2 m (Figure 18).
The value of K (the in-situ strength of a pillar of unit width and height) and exponents for the power formula were backfitted, using an ML evaluation.
Pillar peak strength formula
Table IV shows the results of the standard power formula backfit (Equation 7). The length-strengthening effects are implicit in the use of the perimeter-rule (Equation 3), i.e., effective width, we.
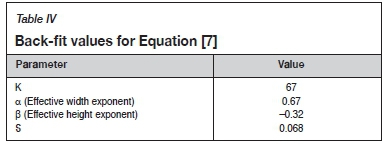
These a and ß values differ significantly from the values back-fitted for the Hedley and Grant (1972) formula (a = 0.50, ß = -0.75) for quartzite. However, they are much closer to the Merensky formula (Watson et al., 2008) where a = 0.76 and ß = -0.36. Jager and Ryder (1999) suggest that chromitite has a slightly higher average angle of internal friction than quartzite, which could explain the greater strengthening effects of the a value. In addition, the material brittleness (rate of cohesion softening) has a major influence on the pillar strength (Watson et al., 2008). The results of the three hard-rock formulae are compared in Figure 19. Note that the commonly used K = 35 MPa (Fernandes, 2020) was assumed in the Hedley and Grant formula (1972). For completeness, the Hedley and Grant formula with k = 133 MPa (Martin and Maybee, 2000) is included in the figure.
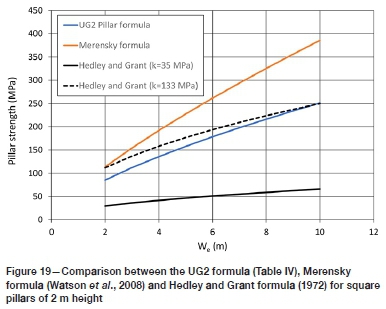
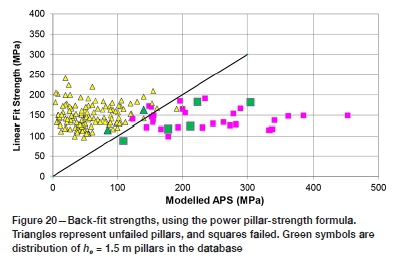
Figure 20 compares the modelled and calculated APS values. The investigations suggest a good correlation between calculated and actual strengths. The small standard deviation (S in Table IV) also confirms that the formula provides a reliable relationship between strength and (w/h)eratio for the range of pillar we and he in the database. The green coloured triangles and squares in Figure 20 show the distribution of 1.5 m high pillars in the database.
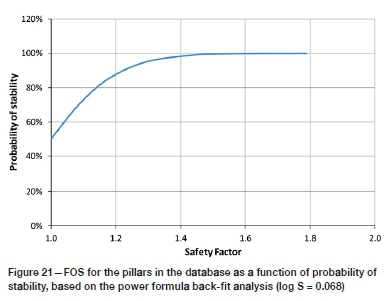
The value of S (Table IV) was used to determine a range of safety factors, which are plotted as a function of probability of stability in Figure 21. The analyses include the presence of stable cases (low SFs) and the failed cases. This graph may be used when designing stable UG2 pillars with dimensions within the range of the database. The analysis suggests that a SF of 1.62 will provide a probability of stability of 99.9%, based on the limited data in the database.
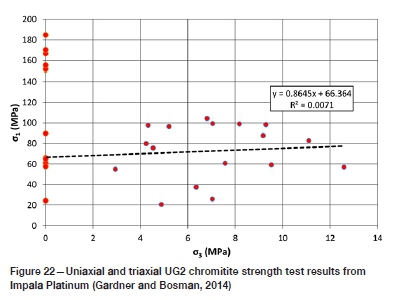
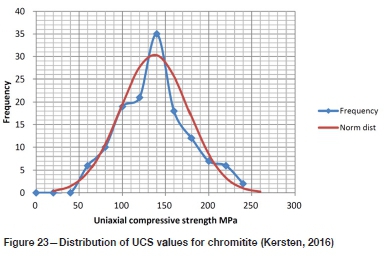
The ß value in Table IV was determined from a relatively small range of heights (Figure 18) and may therefore not be applicable outside of the range of the database. The K-value in the power formula represents the rock mass strength (van der Merwe, 2003). The Impala database (Gardner and Bosman, 2014) shows a significant variation in strength (Figure 22), with a mean UCS of 71 MPa and a standard deviation of 14.2 MPa. Kersten (2016) also observed a significant variation in chromitite strength (Figure 23), with a much higher mean value than that provided in Figure 22. Observations indicate that such a variation in strength could exist within a single pillar. If the mean strength of 138 MPa in Figure 23 (Kersten, 2016) is representative of the pillar materials in the pillar strength database (as described in this paper), then the K-value in Table IV (67 MPa) is about 50% of the UCS. York and Canbulat (1998) suggested a critical rock mass strength for Merensky Reef at about 64% of a typical 50 mm diameter cylindrical sample.
Discussion
The very small standard deviation in pillar strength estimated by the statistical back-analysis (S in Table IV) is evidence of a good-quality database. However, the database consisted of a mixture of pillars with and without sidings, and the siding depths and the heights of gullies also varied. The effect of these parameters on pillar strength was determined using unproven theory and needs to be investigated further. It was therefore considered necessary to conduct an experiment in a UG2 bord-and-pillar working, where no gullies were cut. Such an experiment was carried out at Booysendal Platinum Mine, and is discussed in a separate paper (Watson et al., 2021)
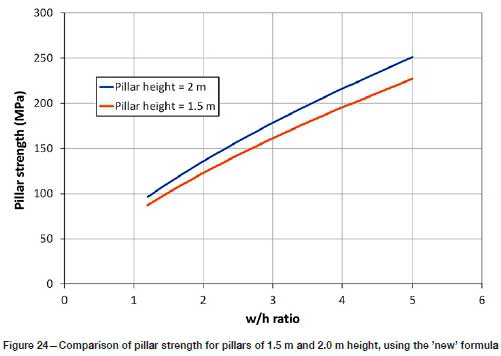
The variation of height in the database was limited due to the thickness of the UG2 Reef in the area where the data was collected. It is therefore recommended that a sensitivity analysis be done on the effects of height using a suitable nonlinear modelling code such as FLAC3D (Itasca Consulting Group, 2018). Input parameters could be determined from laboratory tests with post-failure behaviour, and the model calibrated against the underground measurements. Note that the 1.5 m high pillar results generally clustered around the line dividing failed and unfailed pillars in Figure 20, hence the estimated strengths in the database were generally highly weighted in the ML analyses. Thus the 1.5 m high pillars (though less numerous) played a significant role in the formulation of the final strength equation. A comparison between the strengths of 1.5 m and 2.0 m high pillars with the same w/h ratio, was computed using the PlatMine formula (Figure 24). The results show a slight drop in the strength of the 1.5 m high pillars compared to the 2 m high pillars at the same w/h ratio. The formula therefore yields a possible underestimation of pillar strength at lower pillar heights if the 2 m high pillars are assumed to be the dominating pillar height in the database.
The effects of gullies adjacent to pillars and the horizontal width of sidings (see Figure 3) have not been properly investigated, and better w/h ratio estimates may be possible if the equations to account for these factors are validated. The suggested pillar strength formula should not be used in areas where the strength of pillars is compromised by an adversely oriented thrust structure, or where pillars have been weakened due to weathering.
Previous numerical modelling performed on Merensky pillars (Watson et al., 2008) suggests that the (w/h)e strength relationship is affected by foundation strength. Since the contribution of the foundations to UG2 pillar behaviour is unknown, it is recommended that the formula be used for pillars with conditions similar to those in the database (Esterhuizen, 2014). These conditions are:
> The immediate foundation materials are pyroxenite and anorthosite
> The pillars should not be weakened by thrust structures or weathering
> The height should be restricted to between 1.5 m and about 2 m
> The w/h ratio should be between 1.2 and 4.7.
The PlatMine formula for pillar strength calculation will allow for significantly greater extraction ratios on the UG2 than the currently accepted Hedley and Grant (1972) formula, which assumes a very low k-value of 35 MPa. A comparison of extraction percentages with depth below surface is shown in Figure 25. The analysis of both formulae assumed standard bord widths of 8 m and a SF of 1.6.
Conclusions
The database used in the paper to back-analyse underground pillar strengths is shown to be of high quality. It included a wide range of widths (2-9 m) and lengths (4-49 m), but a small range of he(1.5-2 m). The analyses suggest that Equation [7] together with the exponents in Table IV provides reasonable strength results for the range of pillar sizes in the database. Caution should, however, be exercised when applying this formula to w/h ratios and pillar heights outside the range of the database and in areas with different geotechnical and geomechanical characteristics.
Recommendations
The database was restricted in height variation due to the uniform thickness of the UG2 Reef in the area where the data was collected. It is recommended that sensitivity analyses be done on the effects of height using a suitable nonlinear modelling code such as FLAC3D (Itasca Consulting Group, 2018). Input parameters could be obtained from suitably conducted laboratory tests, and calibrated from underground measurements.
Acknowledgements
PlatMine and the CSIR are acknowledged for facilitating the success of the project. Dr John Ryder is thanked for his assistance in developing statistical software to evaluate the database.
References
COMRO. 1981. MINSIM-D User's Manual. Chamber of Mines of South Africa (Minerals Council South Africa), Johannesburg. [ Links ]
EsterHuizen, G.S. 2014. Extending empirical evidence through numerical modelling in rock engineering design. Proceedings of the 6th South African Rock Engineering Symposium. Southern African Institute of Mining and Metallurgy, Johannesburg. pp 251-267. [ Links ]
Fernandes, N. 2020. Personal communication. Johannesburg. [ Links ]
Gardner, L.J. and Busman I.D. 2014. Correlation of point load index with uniaxial compressive strength for Bushveld Complex rocks. South African National Institute of Rock Engineering, Johannesburg, [ Links ]
Hedley, D.G.F. and Grant, F. 1972. Stope pillar design for the Elliot Lake uranium mines. Bulletin of the Canadian Institute of Mining and Metallurgy, vol. 65. pp. 37-44. [ Links ]
Itasca Consulting Group, Inc. 2018. Fast Lagrangian Analysis of Continua (FLAC), v. 5.0. Minneapolis, MN. [ Links ]
Jager, A.J. and Ryder, J.A. 1999. A Handbook on Rock Engineering Practice for Tabular Hard Rock Mines. Safety in Mines Research Advisory Committee, Johannesburg. [ Links ]
Kersten, R.W.O. 2016. A probabilistic structural design process for bord and pillar workings in chrome and platinum mines in South Africa, i, School of Mining Engineering, University of the Witwatersrand, Johannesburg. [ Links ]
Malan, D.F. and Napier, J.A.L. 2011. The design of stable pillars in the Bushveld Complex mines: A problem solved? Journal of the South African Institute of Mining and Metallurgy, vol. 111. pp. 821-836. [ Links ]
Martin, CD. and Maybee, W.G. 2000. The strength of hard rock pillars. International Journal of Rock Mechanics and Mining Sciences, vol. 37. pp. 1239-1246. [ Links ]
Napier, J.A.L. and Malan, D.F. 2011. Numerical computation of average pillar stress and implications for pillar design. Journal of the South African Institute of Mining and Metallurgy, vol. 111. pp. 837-846. [ Links ]
Napier, J.A.L. and Malan, D.F. 2012. Simulation of time-dependent crush pillar behaviour in tabular platinum mines. Journal of the South African Institute of Mining and Metallurgy, vol. 112. pp. 711-719. [ Links ]
Northam Platinum Limited. 2018. Annual Integrated Report 2018. https://www.northam.co.za/procurement/127-investors-and-media/publications/719-annual-report [accessed: 7 February 2020]. [ Links ]
Roberts, D.P., Canbulat, I., and Ryder, J.A. 2002. Design parameters for mine pillars: strength of pillars adjacent to gullies; design of stable pillars with w/h ratio greater than 6; optimum depth for crush pillars. SIMRAC GAP617 Final Report. Safety in Mines Research Advisory Committee. Johannesburg. [ Links ]
Roberts, D.P., Roberts, M.K.C., Jager, A.J., and Coetzer, s. 2005. The determination of the residual strength of hard rock crush pillars with a width to height ratio of 2:1. Journal of the South African Institute of Mining and Metallurgy, vol 105. pp. 401-408. [ Links ]
Roberts, M.K.C., Grave, D.M.H., Jager, A.J., and Klokow, J. 1997. Rock mass behaviour of the Merensky Reef at Northam Platinum Mine. Safety in Mines Research Advisory Committee, Johannesburg, [ Links ]
Ryder, J.A., Watson, B.P. and Kataka, M.O. 2005. Pillar strength back-analyses. PlatMine 1.2, Johannesburg. [ Links ]
Salamon, M.D.G. and Munro, A.H. 1967. A study of the strength of coal pillars. Journal of the South African Institute of Mining and Metallurgy, vol.68. no. 2. pp. 55-67. [ Links ]
Spottiswoode, S.M. and Milev, A.M. 2002. A methodology and computer program for applying improved, inelastic ERR for the design of mine layouts on planar reefs. SIMRAC GAP722 Final Report. Safety in Mines Research Advisory Committee, Johannesburg. 85 pp [ Links ]
Van der Merwe, J.N. 2003. New pillar strength formula for South African coal. Journal of the South African Institute of Mining and Metallurgy, vol. 97. pp. 281-291. [ Links ]
Wagner, H. 1974. Determination of the complete load-deformation characteristics of coal pillars. Proceedings of the 3rd International Congress on Rock Mechanics, Denver, CO. Vol. 2B. ISRM, Lisbon. pp 1076-1082. [ Links ]
Watson, B.P., Kataka, M.O., Leteane, F.P., and Kuijpers, J.s. 2007. Merensky and UG2 pillar strength back analyses. PlatMine 1.2, Johannesburg. [ Links ]
Watson, B.P., Ryder, J.A., Kataka, M.O., Kuijpers, J.s. and Leteane, F.P. 2008. Merensky pillar strength formulae based on back-analysis of pillar failures at Impala Platinum. Journal of the South African Institute of Mining and Metallurgy, vol. 108. pp. 449-461. [ Links ]
Watson, B.P., sellers, E.J., Kuijpers, J.s., Grave, D.M.H., Roberts, M.K.C., and Coetzer, s.J. 2006. Alternative cost-effective ways of determining the state of stress in mines. PlatMine 3.8, Johannesburg. [ Links ]
Watson, B.P., Theron W., Fernandes, N., Kekana, W.O. Mahlangu, M.P., Betz, G., and Carpedea, A. 2021. UG2 pillar strength: Verification of the PlatMine formula. Journal of the Southern Africn Institute of Mining and Metallurgy, vol. 121, no. 8. pp. 449-456. [ Links ]
York G. and Canbulat I. 1998. The scale effect, critical rock mass strength and pillar system design. Journal of the South African Institute of Mining and Metallurgy, vol.98, no.1. pp. 27-37. [ Links ]
 Correspondence:
B.P. Watson
Email: Bryan.Watson@wits.ac.za
Received: 22 Sep. 2020
Revised: 17 Mar. 2021
Accepted: 6 Jun. 2021
Published: August 2021
Appendix A
The results of the investigations at Mine C are provided in Table A I. The full database consists of all the pillars at each site recorded in the report


