


Servicios Personalizados
Articulo
 Inglés (pdf)
 Articulo en XML
 Referencias del artículo
Indicadores

Links relacionados
-
 Citado por Google
 -
 Similares en Google
Compartir

 Permalink
Journal of the Southern African Institute of Mining and Metallurgy
versión On-line ISSN 2411-9717
versión impresa ISSN 2225-6253
J. S. Afr. Inst. Min. Metall. vol.121 no.1 Johannesburg ene. 2021
http://dx.doi.org/10.17159/2411-9717/1243/2021
PROFESSIONAL TECHNICAL AND SCIENTIFIC PAPERS
A continuous quality improvement framework for electrowinning current efficiency
T.E. MoongoI, II; S. MichaelI
IDepartment of Mechanical and Marine Engineering, Namibia University of Science and Technology, Namibia
IIDepartment of Mining and Process Engineering, Namibia University of Science and Technology, Namibia
SYNOPSIS
Electrowinning consumes a substantial amount of electrical energy, and owing to the ever-increasing unit cost of electrical power there is a need to improve current efficiency in the process. This research was carried out to design a continuous quality improvement framework for improving electrowinning current efficiency by applying statistical process control (SPC) on an online industrial copper electrowinning operation. A sequential mixed research methodology was applied and a statistical software package utilized for analysing data. It was concluded that metallurgical short-circuits (hotspots) had the most significant effect on current efficiency. Bringing hotspots under statistical control resulted in a 5.40% improvement in current efficiency, which is equivalent to approximately 74 t of 99.999% pure grade A copper cathode production over a period of 1.5 months.
Keywords: quality, continuous improvement, continuous quality improvement, statistical process control, and current efficiency.
Introduction
The mining industry is a significant contributor to the Namibian economy, accounting for 9.3% of the GDP in 2019 (Chamber of Mines, 2019). The Namibian mining sector is the world leader in deep-sea mining/marine mining, and is currently the fourth-largest producer of uranium oxide worldwide (World Nuclear Association, 2020; Debmarine Namibia, 2020). In Namibia, the mining industry produces a wide range of commodities such as special high-grade zinc, gold bullion, blister copper, grade A copper cathodes, uranium oxide, gem-quality diamonds, cement, dimension stone, semi-precious stones, salt, chemicals, tin concentrate, zinc, and lead concentrates.
One of the state-of-the-art technologies used in the Namibian mining industry is the electrowinning (EW) process. This power-intensive electrical process is utilized for the production of refined copper cathodes (Parada and Asselin, 2009). Regrettably, the unit cost of electrical energy is ever-increasing (Nampower, 2019; Eskom, 2019). In Namibia, the EW process is applied in mine-to-metal operations which are producing gold bullions, special high-grade zinc, and grade A copper cathodes. This research was conducted in Namibia's only copper solvent extraction and electrowinning (SX-EW) plant that applies electrowinning technology to produce copper cathodes of 99.999% purity.
The use of quality control techniques such as statistical process control (SPC) has become essential for any business to thrive in modern industry. Statistical quality control is one of the reasons why the Japanese had a significant advantage over their competitors in the manufacturing industry. This experience may be transferred to the EW process by applying SPC to control current efficiency variables, and hence maintaining an improved current efficiency. However, many organizations are still not applying this powerful quality control technique (Ben and Jiju, 2000; Helm, 2018).
The electrical energy utilized in the electrowinning process can be applied more efficiently and cost-effectively by improving current efficiency (Wang et al., 2016). A typical electrowinning process consumes approximately 60% to 80% of the total electrical energy for a metallurgical plant applying heap leaching (Gonzalez-Dominguez and Dreisinger, 1997). Consequently, there is an opportunity for substantial electrical energy saving and for increasing copper cathode production if electrowinning current efficiency is improved.
Statistical process control
Continuous quality improvement via the application of statistical process control (SPC) has long been recognized in the metallurgical industry. SPC assists with monitoring process variability and maintaining process stability, thereby ensuring that the plant is under operational control (Godina et al., 2018). The process can get out of statistical control due to process variations, such as controlled process variation and uncontrolled process variation (SCME, 2017).
Occasionally, there are special or assignable causes of process variability that are temporary or not inherently in the process, unlike common (also called random or chance) causes of process variability (Pavol, 2015; Montgomery, 2009). Normally, all the special causes of process variability should be addressed by developing and implementing an Out of Control Action Plan (OCAP) (Amitava, 2016; Helm, 2018; SCME, 2017).
According to the literature, the following tools are utilized in SPC: histograms, scatter diagrams, check sheets, defect-concentration diagrams, cause-and-effect diagrams, process control charts, and Pareto charts (Helm, 2018). In this research, process control charts, Pareto charts, and the Ishikawa diagram were applied.
Process control charts
Process control charts are used to maintain the production process under statistical control. They are frequently employed as diagnostic tools because they can indicate when adjustments should be made in the process. Process control charts monitor process variability and provide information about the stability of the process (Helm, 2018; Montgomery, 2009; SCME, 2017; Wild and Seber, 2017; Leavengood and Reeb, 2015).
Process control charts are constructed by assuming that the quality characteristic data follows a normal/Gaussian distribution. The bell-shaped curve should be reflected on the histogram. This is because the central limit theorem holds if the population distribution of the sample is unimodal and close to symmetric. In general, a process control chart contains three horizontal lines: the upper control limit (UCL), lower control limit (LCL), and the centre line (process average) (Montgomery, 2009; Baradaran and Dashtbani, 2014, Amitava, 2016; SCME, 2017).
It is worth noting that process control charts work with rules for deciding when the process is within or out of SPC. Walter Shewhart developed the eight Shewhart Rules for process control charts. The first four rules are also referred to as the Western Electric Rules. The first rule states that if a point is plotted outside the control limits it is deemed to be out of control. Due to the complexity of the electrowinning process, this is the only Shewhart Rule applied. Typical SPC charts include Xbar (mean) and range (X - R) control charts, Individual moving range (I-MR) control charts, proportion-control charts (p-charts), Xbar (mean) and standard deviation (X- S), and many others (SCME, 2017).
Current efficiency
Current efficiency may be defined as the ratio of direct current utilized for electroplating the metal of interest to the total direct current that is applied to the electrolytic cells (Kafumbila, 2017). From the practical viewpoint, current efficiency refers to the actual quantity of the electroplated metal divided by the theoretical quantity calculated by applying Faraday's equation (Beukes and Badenhorst, 2009; Anderson, 2017).
In industrial copper electrowinning the current efficiency can range from 90% to 95% (Robinson, 2011). Other authors have reported that current efficiency in copper electrowinning should be greater than 92%. Nevertheless, lower current efficiencies may also be experienced depending on the influencing factors. The inefficiently used direct current or low current efficiency represents the direct current that was utilized for any unintentional purpose other than electroplating the metal of interest onto the cathode blank sheet (Moats and Free, 2007; Ntengwe, Mazana, and Samadi, 2010).
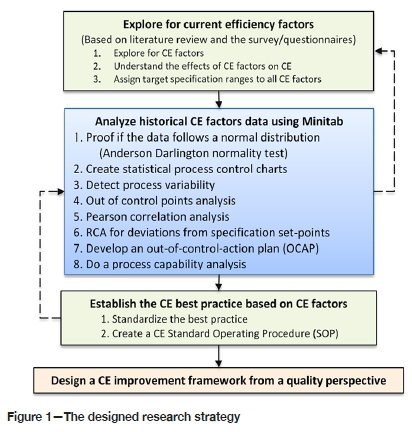
Methodology
A sequential mixed research methodology was applied. A total of 1629 L of electrolyte solution samples comprised of 6516 samples of 250 mL each was analysed by an independent laboratory. The instrument data from the electrowinning process was retrieved every 2 hours during the study period. The data studied was for 6 months from January 2019 to the end of June 2019. Questionnaires were completed by operators, process engineers, academics, and consultants who understand the EW process. The data was analysed using the Minitab statistical software package by applying the Anderson Darlington normality test, Pearson correlation analysis, Box-Cox transformation, Johnson transformation, Shewhart control charts, and process capability analysis (Moongo, 2020). A detailed roadmap of the research strategy is depicted in Figure 1.
Results and discussion
Creating process control charts for current efficiency factors
Before control charts were created, an Anderson Darlington normality test was carried out using Minitab (Minitab, 2019). Thereafter, non-normal data was transformed using Box-Cox transformation and/or Johnson transformation (Minitab, 2020). An Anderson Darlington normality test was repeated by using the transformed data. A statistical summary report was generated for all the factors to confirm that the data indeed followed a normal distribution and formed a bell-shaped curve. The transformed data and/or normally distributed data was then used to create control charts similar to that shown in Figure 2 (Moongo, 2020).
Analysis of process control charts for continuous data
The process control charts were analysed for continuous data by undertaking an out-of-control points alignment analysis and Pearson correlation analysis. The out-of-control points alignment in Figure 3 shows that for rectifier current and current density, 87.5% of the out-of-control points were aligned to current efficiency. However, the correlation coefficients for these factors are only 0.053 and 0.179, indicating that they do not have the most significant effect on current efficiency compared to other factors. The difference in the correlation coefficient is most likely to be due to unstable EW operation (Moongo, 2020).
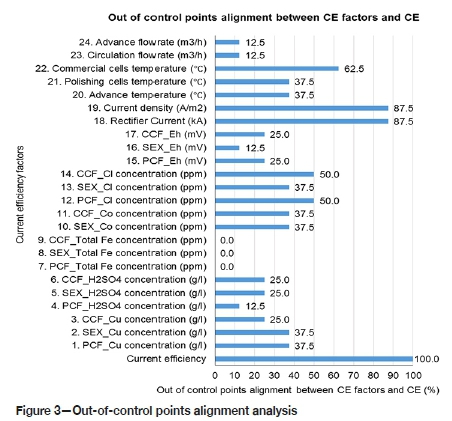
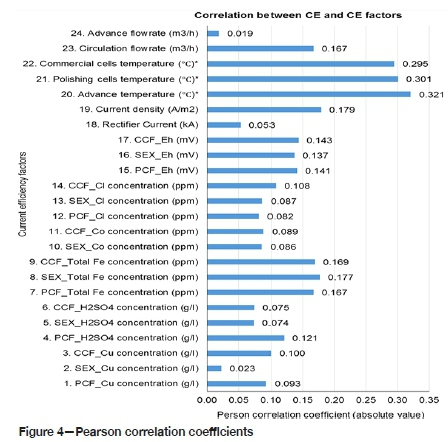
This indicates that the factor that has the most significant effect on current efficiency cannot be found by only using one method of analysis. All the points should be considered in the analysis. From Figure 4, it can be seen that the exit temperatures from the commercial cells and polishing cells, and the advance electrolyte exit temperature from the polishing cells to the commercial cells, have the highest Pearson correlation coefficients with respect to current efficiency, at 0.295, 0.301, and 0.321 respectively. These factors will have the most significant effect on current efficiency provided no other factor has a higher correlation coefficient. This is because of the large number of factors affecting current efficiency, and the process may not have been stable during the study (Moongo, 2020).
Analysis of process control charts for attribute data
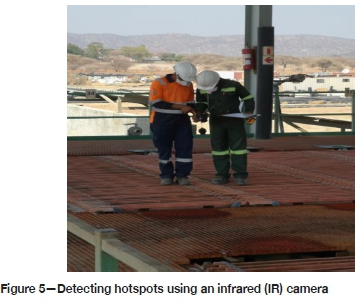
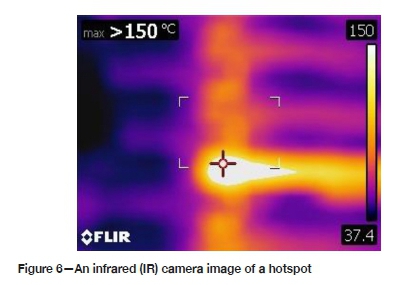
Attribute data for some current efficiency factors was collected manually in the plant, as opposed to data collected by analysing samples in the laboratory and retrieved from the supervisory control and data acquisition (SCADA) server database. The main attribute for which data was collected manually was metallurgical short-circuits (hotspots). The hotspots were detected by using an infrared (IR) camera (Figure 5). The temperature of the electrode contacts is normally maintained < 55°C. However, a lot hotspots with temperatures as high as > 150°C were detected, as shown in Figure 6 (Moongo, 2020).
Implementing an out-of-control action plan
The presence of hotspots was addressed by understanding the root causes shown in Figure 7, followed by developing and implementing an OCAP. The procedure involved (Moongo, 2020):
➤ An exhaustive hotspot detection and rectification, troubleshooting exercise
➤ Knocking off cathode nodules
➤ Reviewing current efficiency calculations
➤ Monitoring and controlling electrolyte impurities such as manganese and iron
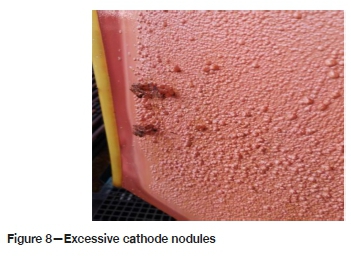
➤ Monitoring and controlling the addition of cathode smoothing agent, which prevents the formation of nodules (see Figure 8)
➤ Improving electrode maintenance, including anode cleaning and cell cleaning
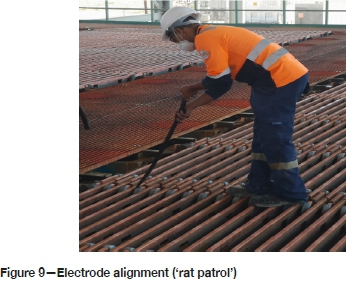
➤ Carrying out proper electrode alignment ('rat patrol') as shown in Figure 9
➤ Straightening bent electrodes (Figure 10)
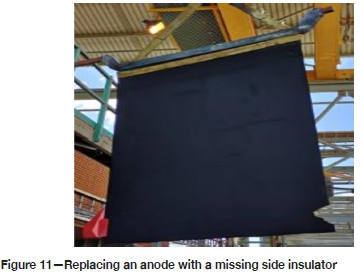
➤ Replacement of damaged electrodes without side insulators (Figure 11)
➤Replacing insulators
➤ Cleaning anode contacts (Figure 12).


Improvement in current efficiency
The individual moving range (I-MR) control chart for current efficiency (see Figure 13) shows that current efficiency improved as metallurgical short-circuits (hotspots) were brought under statistical control by applying the OCAP. The decrease in the number of hotspots can be seen on the proportion (P) control chart and units (U) control chart shown in Figures 14 and 15. Although hotspots have a 45.45% out-of-control points alignment, the percentage misalignment for the number of hotspots per cell and percent of cells with hotspots are 54.55% and 50.00% respectively (Moongo, 2020). These figures are the lowest compared to all other factors.
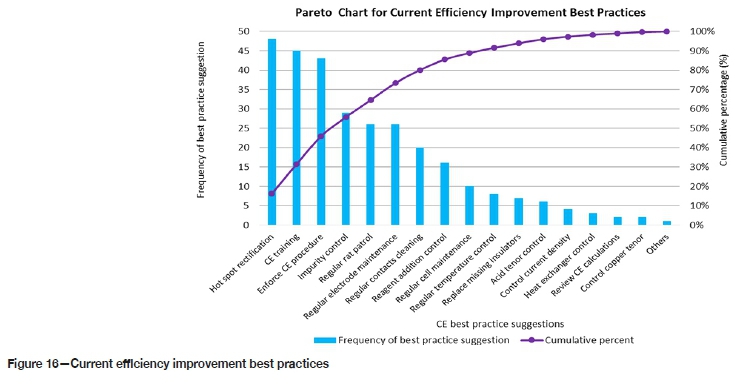
Furthermore, hotspots were found to have a higher Pearson correlation coefficient than all the other factors, at -0.361 for the number of hotspots per cell and -0.878 for the percentage of cells with hotspots. The negative sign signifies an inversely proportional relationship between metallurgical short-circuits and current efficiency (Moongo, 2020). Moreover, the questionnaire results regarding best practices for improving current efficiency also indicate that rectifying metallurgical short-circuits will most likely result in improved current efficiency (see Figure 16).
After implementing the developed OCAP, the current efficiency improved from 89.64% to 95.04%, an improvement of 5.40% (see Figure 17). This confirms that metallurgical short-circuits had the most significant effect on current efficiency. Metallurgical short-circuits (hotspots) result in the conversion of direct current into heat energy, making less current available for electroplating copper onto the cathode blank sheets. The 5.40% improvement in current efficiency translates to approximately 74 t of 99.999% pure grade A copper cathode production over a period of 1.5 months (Moongo, 2020).
Designing a continuous quality improvement framework
The following factors were considered when designing a detailed continuous quality improvement framework for electrowinning current efficiency:
➤ Current efficiency factors
➤ Anderson Darlington normality test
➤ Transforming non-normal data (using Box-Cox and Johnson transformation)
➤ Classifying data types
➤ Selecting suitable process control charts
➤ Pearson correlation analysis
➤ Out-of-control point alignment analysis
➤ Process capability analysis
➤ Root cause analysis
➤ Developing and implementing an OCAP
➤Current efficiency training
➤ Developing a current efficiency improvement standard operating procedure (SOP).
A simplified version of the designed continuous quality improvement framework is depicted in Figure 18. The framework serves as a guide for improving current efficiency indirectly by applying statistical process control to current efficiency factors (Moongo, 2020).
Conclusions
The principal objective of the research was accomplished. It was found that metallurgical short-circuits (hotspots) contributed significantly to the reduction in electrowinning current efficiency. The root causes of hotspots were poor anode maintenance in terms of missing insulator replacement, old corroded anodes, poor spent electrolyte copper concentration control, and poor cathode smoothing agent (Magnafloc) control. These root causes were addressed by developing and implementing an out-of-control action plan (OCAP) which resulted in the improvement of current efficiency from 89.64% to 95.04%, an improvement of 5.40%. This translates to approximately 74 t of 99.999 % pure grade A copper cathode production over a period of 1.5 months.
A continuous quality improvement framework for improving electrowinning current efficiency from a quality perspective of the associated variables was designed by applying statistical process control. This was done by considering factors such as the Anderson Darlington normality test, non-normal data transformation (using Johnson and Box-Cox transformation), constructing process control charts, and analysing the process control charts in detail, which included Pearson correlation analysis, out-of-control points alignment analysis, root cause analysis, process capability analysis, and implementing an OCAP.
The main limitation of this research stems from the fact that the study was done in an industrial copper electrowinning plant while it was online, producing copper cathodes. The electrowinning process may not have been stable during the study. Future research is recommended to focus on improving current efficiency via the application of statistical process control by carrying out laboratory experiments, application of design of experiments (DOE), studying the effect of the interactions between current efficiency factors, application of other types of control charts such as multivariate control charts, cumulative sum (CUSUM) control charts, and exponentially weighted moving average (EWMA) control charts.
Acknowledgements
The authors would like to thank Mr Jomo Appolus (Processing Manager) for authorizing the study. The contributions by the copper refinery technical team, operations team, Mr Nobert Paradza, and Mr John Moody are highly appreciated.
References
Adcöck, P. 2017. Zinc electrowinning in the presence of iron (II). PhD thesis, University of Western Sydney, NSW. [ Links ]
Amitava, M. 2016. Fundamentals of Quality Control and Improvement. 4th edn. Wiley, Hoboken, NJ. [ Links ]
Baradaran, V. and Dashtbani, H. 2014. A decision support system for monitoring traffic by statistical control charts. https://www.researchgate.net/ publication/307671037_A_decision_support_system_for_monitoring_traffic_by_ statistical_control_charts/download [ Links ]
Ben, M. and Jiju, A. 2000. Statistical process control: an essential ingredient for improving service and manufacturing quality. Managing Service Quality, vol. 10, no. 4. pp. 233-238. [ Links ]
Beukes, N. and Badenhorst, J. 2009. Copper electrowinning: theoretical and practical design. Journal of the Southern African Institute of Mining and Metallurgy, vol. 109. pp. 343-356. [ Links ]
Corby Anderson, C. 2017. Optimization of industrial copper electro winning solutions. Journal of Advanced Chemical Engineering, vol. II, no. 2. p. 156. [ Links ]
Debmarine Namibia. 2020. Debmarine Namibia. https://debmarinenamibia.com/main/whoweare [accessed 22 September 2020]. [ Links ]
Ehsani, Α., Yazici, E.Y., and Deveci, H. 2016. The effect of temperature on the electrowinning of copper. Proceedings of the 18th International Metallurgy and Materials Congress, Istanbul. http://www1.metalur'i.org.tr/immc2016/654.pdf [ Links ]
Eskom. 2019. Tariffs and charges. http://www.eskom.co.za/CustomerCare/TariffsAndCharges/Pages/Tariffs_And_Charges.aspx [ Links ]
Fereshteh, S., Naison, M., and Felix, W. 2010. The dependence of current efficiency on factors affecting the recovery of copper from solutions. Journal of Applied Sciences Research, vol. 6, no. 11. pp. 1862-1870. [ Links ]
Godina, R., pimentel, C., Silver, F., and Joao, M. 2018. Improvement of the statistical process control certainty in an automotive manufacturing unit. Procedia Manufacturing, vol. 7. pp. 729-736. [ Links ]
Gonzalez-Dominguez, J. and Dreisinger, D. 1997. Identifying research opportunities in zinc electrowinning. Review of Extraction & Processing. p. 38. [ Links ]
Helm. 2018. Quality Control. Unspecified, pp. 1-18. Note: Please add publication details as required by SAIMM reference style. If not available, reference should be removed. I cannot trace this on the internet. [ Links ]
Kafumbila, K. 2017. Design of copper electrowinning circuit using conventional cells. https://www.scribd.com/document/339612505/Design-of-Copper-Electrowinning-Circuit-using-Conventional-cells# [ Links ]
Leavengood, S. and Reeb, J.E. 2015. Variables control charts. Statistical Process Control. Oregon State University Extension Services. https://catalog.extension.oregonstate.edu/sites/catalog/files/project/pdf/em9109.pdf [ Links ]
Moats, M. and Free, M. 2007. A bright future for copper electrowinning. JOM, vol. 59. pp. 34-36. [ Links ]
Chamber of Mines of Namibia. 2018. Annual Review. Windhoek. [ Links ]
Minitab. 2019. The Anderson-Darling statistic. https://support.minitab.com/en-us/minitab/18/help-and-how-to/statistics/basic-statistics/supporting-topics/ normality/the-anderson-darling-statistic/ [accessed 1 May 2020]. [ Links ]
Minitab. 2020. Box-Cox-transformation. https://support.minitab.com/en-us/minitab/19/help-and-how-to/quality-and-process-improvement/control-charts/how-to/box-cox-transformation/before-you-start/overview/[accessed 1 May 2020]. [ Links ]
Minitab. 2020. Johnson transformation. https://support.minitab.com/en-us/minitab/19/help-and-how-to/quality-and-process-improvement/quality-tools/how-to/'ohnson-transformation/before-you-start/overview/[accessed 1 May 2020]. [ Links ]
Montgomery, D. 2009. Introduction to Statistical Quality Control. 6th edn. Arizona State University. [ Links ]
Moongo, T. 2020. Designing a continuous quality improvement framework for improving electrowinning current efficiency. Namibia University of Science and Technology, Windhoek. [ Links ]
Nampower. 2019. Schedule of approved distribution tariffs for the financial year 2019/20. httyp://wwwnampower.com.na/Page.aspx?p=172 [ Links ]
Natarajan, S. 1985. Current efficiency and electrochemical equivalent in an electrolytic process. Bulletin of Electrochemistry, Mar-Apr, vol. 1, no. 2. pp. 215-216. [ Links ]
Ntengwe, F., Mazana, Ν., and Samadi, F. 2010. The dependence of current efficiency on factors affecting the recovery of copper from solutions. Journal of Applied Sciences Research. pp. 1862-1870. [ Links ]
Ozdag, H., Bozkurt, K., Ipek, H., and Bilir, K. 2012. The influence of impurity ions on the electrowinning of copper from waste PBCs leaching solutions. Journal of the Southern African Institute of Mining and Metallurgy, vol. 112. pp. 112-121. [ Links ]
Parada, T. and Asselin, E. 2009. Reducing power consumption in zinc electrowinning. JOM, vol. 51. https://doi.org/10.1007/s11837-009-0152-1. [ Links ]
Pavol, G. 2015. Continuous Quality Improvement by Statistical Process Control. Elsevier. pp. 565-572. [ Links ]
Robinson, T. 2011. Electrowinning. Extractive metallurgy of copper. Schlesinger, M.E., King, M.J., Sole, K.C., and Daveport, W.G. (eds). Elsevier. pp. 349-371. [ Links ]
SCME. 2017. Control chart basics: Primary knowledge unit participant guide. National Science Foundation's Advanced Technological Education, New York. [ Links ]
Tuaweri, T., Adigio, e., and Jombo, P. 2013. A study of process parameters for zinc electrodeposition from a sulphate bath. International Journal of Engineering Science Invention, vol. 2, no. 8. pp. 17-24. [ Links ]
Vay, L. 2011. Studies of micromorphology and current efficiency of zinc electrodeposited from flowing chloride electrolytes. Lawrence Berkeley National Laboratory. 139 pp. [ Links ]
Wang, H., Xia, W., Yang, W., and Ren, B. 2016. Improving current efficiency through optimizing electrolyte flow in zinc electrowinning cell. Proceedings of CFD Modeling and Simulation in Materials Processing2016. Wiley. https://doi.org/10.1002/9781119274681.ch29 [ Links ]
Wild, C. J. and Seber, GA.F. 2017. Control charts. Chance Encounters: A First Course in Data Analysis and Inference. Elsevier, New York. Chapter 13. [ Links ]
World Nuclear Association. 2020. World uranium mining production. https:// www.world-nuclear.org/information-library/nuclear-fuel-cycle/mining-of-uranium/world-uranium-mining-production.aspx#:~:text=Kazakhstan%20produces%20the%20largest% 20share,%25)%20and%20Australia%20 (12%25).&text=Uzbekistan%20(est.)[accessed 22 September 2020]. [ Links ] ♦
 Correspondence:
T.E. Moongo
Email: tmoongo@gmail.com
Received: 8 Jun. 2020
Revised: 13 Nov. 2020
Accepted: 26 Nov. 2020
Published: January 2021
ORCID
T.E. Moongo https://orcid.org/0000-0002-2465-0409
S. Michael https://orcid.org/0000-0002-8003-5216

