


Services on Demand
Article
 English (pdf)
 Article in xml format
 Article references
Indicators

Related links
-
 Cited by Google
 -
 Similars in Google
Share

 Permalink
Journal of the Southern African Institute of Mining and Metallurgy
On-line version ISSN 2411-9717
Print version ISSN 2225-6253
J. S. Afr. Inst. Min. Metall. vol.120 n.12 Johannesburg Dec. 2020
http://dx.doi.org/10.17159/2411-9717/1119/2020
PROFESSIONAL TECHNICAL AND SCIENTIFIC PAPERS
A nonlinear prediction model, incorporating mass transfer theory and expert rules, for refining low-carbon ferrochrome
C -J. GuanII; W. YouI, II
ISchool of Electrical and Electronic Engineering, Changchun University of Technology, Changchun, 130012, China. C -J. Guan: https://orcid.org/0000-0002-7606-6546
IISchool of Mechatronic Engineering, Changchun University of Technology, Changchun, 130012, China. W. You: https://orcid.org/0000-0003-3800-3963
SYNOPSIS
We present an optimal oxygen-blowing system with expert rules to improve the efficiency of refining low-carbon ferrochrome. A nonlinear model based on mass transfer theory, the principles of heat transfer, and the principles of high-temperature chemical reactions for refining low-carbon ferrochrome are established. The model is mainly used to control the oxygen supply rate during argon-oxygen top-bottom double-blown refining, thereby controlling the refining temperature and reducing the carbon content. Twenty production tests using a 5 t argon-oxygen refining furnace demonstrate the effectiveness of the system and reliability of the nonlinear model. A comparison of the model data with the experimental data shows that although the model fails to predict the silicon content in the final refined product, it can predict the contents of the main components at the refining end-point and the refining temperature accurately.
Keywords: prediction model, end-point control, mass transfer theory, expert rules.
Introduction
Low-carbon ferrochrome (LCFeCr) is used for trimming additions in stainless steel production as well as other specialist applications. LCFeCr can be produced by various processes, such as the low-basicity furnace process, Perrin process, electric-silicothermic process, bottom-blown converter process, argon-oxygen decarburization (AOD) process, and vacuum furnace reactor process. (Weitz and Garbers-Craig, 2016; Heikkinen and Fabritius, 2012; Booysen et al., 1998; Bhonde, Ghodgaonkar, and Angal, 2007).
The AOD process has been extensively researched and numerous models have been developed. Noting the change in the partial pressure of carbon monoxide with the bath height, Roy and Robertson (1978a, 1978b) introduced the heat balance to take into account the non-isothermal nature of the bath and proposed a mathematical model for stainless steelmaking. On the basis of the mass and heat balances, Reichel and Szekely (1995) developed a mathematical model of the AOD process for stainless steel. Görnerup and Sjöberg (1999) mathematically modelled the AOD/Creusot-Loire Uddeholm process. Wei and Zhu (2002a, 2002b) modelled the whole AOD process, including the top, side, and combined blowing operations in the decarburization phase and the reduction practice.
In these models, the main product is generally stainless steel. In recent years, many experts have studied the production of LCFeCr by the AOD process (Ville-Valtteri et al., 2013a, 2013b; Qiu et al., 2013; Deo and Srivastava, 2003). In the refining process, the oxygen supply rate, refining duration, refining temperature, and other factors will have a great impact on the composition of the products.
The existing models for stainless steel are not suitable for LCFeCr refining of due to the differences in composition and technology (Heikkinen and Fabritius, 2012). Industry experts and researchers have attached importance to the establishment of mathematical models of LCFeCr production technology, and have conducted research on various aspects of the process. Some scholars have established corresponding mathematical models. Booysen et al. (1998) developed a bottom-blown AOD model based on phenomenological heat and kinetic mass transfer. Bhonde, Ghodgaonkar, and Angal (2007) developed a mathematical model according to the metallothermic reduction, triplex process, and vacuum technique. Akimov et al. (2013) developed a mathematical model based on the results of industrial smelts and thermodynamic analysis. Although some models describing ferrochrome production have been developed, most of the models focus on individual phenomena rather than the total process. Some important parameters, such as refining temperature, carbon oxidation rate, and mass transfer rate (Wei and Zhu, 2002a; Ville-Valtteri et al., 2017), have not been reliably determined to date. There is still no accurate mathematical model for LCFeCr production by the top-bottom double-blown AOD process. Many producers still rely on the experience of workers in the refining of LCFeCr. There is therefore an urgent need to establish an accurate model to describe this process.
Mathematical model for low-carbon ferrochrome
Modelling conditions
An AOD furnace with a capacity of 5 t was selected for the experimental work. Oxygen is blown into the furnace through a top lance, and is mixed with the ferrochrome melt. The main lance and the secondary lance are installed at the bottom of the furnace. The main lance blows oxygen and argon. The secondary lance blows argon only.
The solid raw materials are melted in the electric arc furnace, then the molten ferrochrome is poured into the argon-oxygen top-bottom double-blown refining furnace for refining. The initial temperature in the refining furnace is about 1600K. The electric arc furnace provides feed material of fixed composition for the refining furnace. The carbon content is 6.5-8.5%, the silicon content 1.5-2.0%, the chromium content 57-65%, the iron content 25-35%, and the other elements are less than 0.1%.
The following assumptions are made in order to simplify the modeling of the refining process with a small refining capacity:
(1) During the refining process, elements such as Fe, Cr, C, and Si in the high-temperature melt are oxidized. The oxidation reactions and the reduction reactions take place continuously.
(2) It is assumed that the redox reaction in the furnace is uniform during the refining process.
(3) Others trace elements in the melt are ignored.
(4) The refining temperature is controlled between 1800 and 2100K. The temperature inside the furnace is assumed to be uniform.
Chemical reactions in the refining process
The reactions during argon-oxygen refining of LCFeCr occur at normal pressure, in the presence of sufficient oxygen, and at high temperature. The chemical reactions are complex. The main chemical reactions that occur during the stabilization period can be described by Equations [1]-[8] (Bi, 1975; Cai, 1995; Wei et al., 2011).
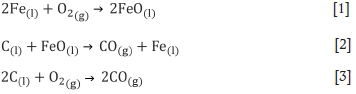
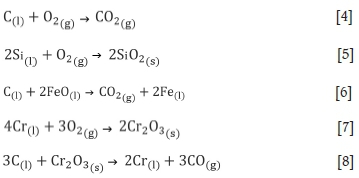
where (l) indicates a component of the melt, (s) a component of the slag, and (g) a component of the gaseous phase.
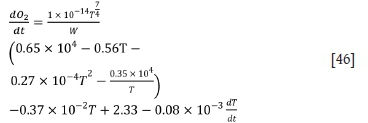
The refining process entails the dynamic equilibrium of high-temperature chemical reactions. The gas produced by the chemical reaction is discharged as flue gas. The molten oxide matter produce by the chemical reactions become the slag. Based on the above reactions, a mathematical model is established to predict the melt content during the refining process and the reaction rates, which can be used to guide production.
Mathematical model of the refining process
Mathematical model based on heat balance
The ultimate goal of refining LCFeCr is to remove carbon and other impurities. Elemental oxidation occurs at the gas-liquid interface (Manuela, Sergey, and Masamichi, 1997), and the elements at the interface are transported by mass transfer (Olga, Genii, and Pavel, 2014). Therefore, the oxidation rate of an element can be calculated from its mass transfer rate (Ville-Valtteri et al., 2017). In this way, the elemental composition of the ferrochrome melt can be predicted.
Heat balance calculation
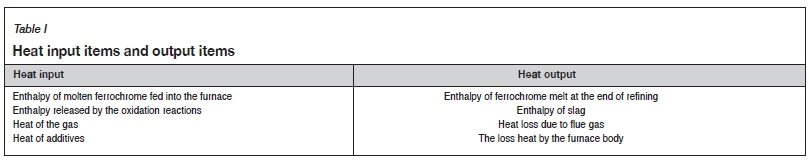
The heat generated and heat lost during the refining process, are made up of several components (Table I).
According to the law of energy conservation and heat analysis, the heat balance equation is obtained as:
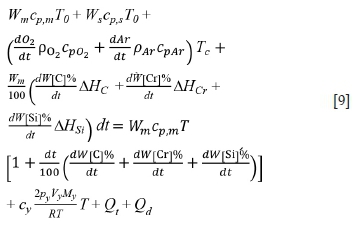
The symbols used in this and subsequent equations are defined at the end of the paper.
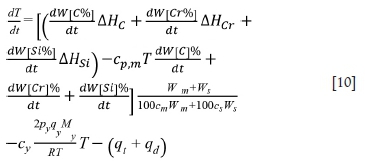
The heating rate of the furnace is given by Equation [10]. It can be seen that the rate of temperature increase is mainly affected by the oxidation reactions and the heat loss.
Oxidation rate calculation
Diffusion of carbon through the gas-liquid boundary layer has been shown to be the rate-controlling mechanism (He et al., 1994). According to mass transfer theory, the mass transfer rate of carbon across the gas-liquid interface can be calculated as (Guo, 2006):
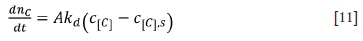
where A = 4nr2is the bubble surface area; kdis mass transfer coefficient of oxygen; c[C]is the concentration of carbon in molten ferrochrome, and c[C]sis the concentration of carbon at the bubble interface of molten ferrochrome.

where c[O] is the concentration of oxygen in molten ferrochrome in mol/m3; c[O]s is the concentration of oxygen at the bubble interface in mol/m3; and Δc[O] is the equilibrium concentration of oxygen (Guo, 2006).
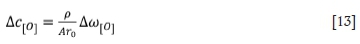
where r0is the initial radius of the bubble (6 χ 10-3 m) (Guo, (2006), and Δω[0] is the degree of supersaturation. The reported values for the parameter Δω[0] range from 0.015% to 0.025% (Guo, 2006). In this work, Δω[0] = 0.02%.
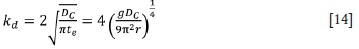
where DCis the diffusion coefficient of carbon in molten ferrochrome (5 χ 10-9 m2/s) (Li, 2004); teis element contact time; g is acceleration due to gravity (9.81 m/s2); and r is the bubble radius.
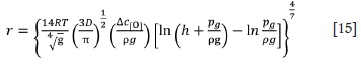
where R is the gas constant (-8.314 J/(mol-K)); ρ is the density of molten ferrochrome (7 χ 103 kg/m3), pgis standard atmosphere, and h is the depth of the furnace.
Substituting R, ρ, pg, h and Equation [13], the bubble radius is calculated as follows:

Substituting Equations [13], [14], and [16] into Equation [11] yields:
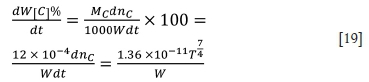
dW[Cj°/o is the rate of decline in carbon content in the molten ferrochrome, which is a function of the rate of ascent of bubbles through the melt. The relationship between dnCand dW[C]% is as follows (Guo, (2006):

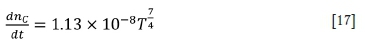
The rate of change in carbon content in molten ferrochrome can be expressed as follows:
From the temperature, refining time, and the weight of molten ferrochrome, the oxidation rate of carbon in the furnace can be predicted. Thereby the carbon content in the melt can be also calculated.
The oxidation rate of chromium at the gas-liquid interface is positively correlated with the mass transfer rate of chromium while the temperature is higher than 1873K. The mass transfer rate can be described as follows:
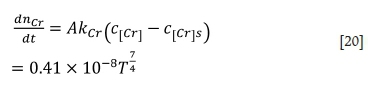
where  is the mass transfer coefficient of chromium, and DCr= 1.8 χ 10-9 m2/s is the diffusion coefficient of chromium in molten ferrochrome.
The oxidation rate of chromium, which can be used to predict the chromium content in the alloy, is given as follows:
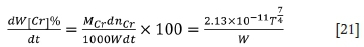
From the temperature, refining time, and the weight of molten ferrochrome, the oxidation rate of chromium in the furnace can be predicted. Thereby the chromium content in the melt can be also calculated.
The oxidation of silicon is similar to that of carbon. The mass transfer rate of silicon can be described as follows:
where  is the mass transfer coefficient of silicon, and DCris the diffusion coefficient of silicon in molten ferrochrome (0.44 χ 10-9) m2/s).
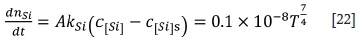
The oxidation rate of silicon is given by Equation [23].
The oxidation rate of silicon in the furnace can be predicted from the temperature, refining time, and the weight of molten ferrochrome. Thereby the silicon content in the bath can be calculated.
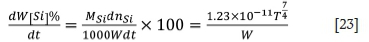
The standard enthalpies of formation of the respective oxides (at 298K) involved in the following equations and the relevant heat capacities at constant pressure with the enthalpies of solution formation were all taken from Wei and Zhu (2002a) and Turkdogan (1980).
Heat dissipation
Heat dissipation calculation for furnace body
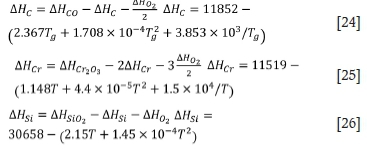
An elevation diagram of the argon-oxygen refining furnace is shown in Figure 1. The furnace is composed of two parts: a furnace body and a furnace cap. The middle part of the furnace body is cylindrical; the upper and lower parts are truncated cones. The ratio between the depth of the molten bath and the height of the furnace chamber is 1:3. The ratio between the molten bath depth and the diameter of the molten pool surface is 1:2. The furnace body is regarded as a cylinder for convenience of calculation. The refractory lining of the shaft has two layers. The inner (working) layer consists of chrome-magnesia refractory brick with a thickness of 350 mm. The outer layer is insulated and reinforced with refractory clay bricks. Its thickness is 115 mm.
In the LCFeCr production process in an AOD furnace, the temperature in the furnace is about 1873-2073K, the outer wall temperature is about 623K, and the ambient temperature is 293-303K. In the refining process, the heat losses consist of the conduction heat and radiant heat from the furnace body, the conduction heat and radiant heat at the bottom of the furnace, and the heat loss in the flue gas (Farrera-Buenrostro et al., 2019). According to the equation for the heat transfer rate, the heat loss from the furnace body can be calculated.
The exothermic reactions occur within a few minutes, and no heat is transferred to the lining during this time. It is assumed that each part of the furnace lining has the same heat transfer characteristics, which is convenient for theoretical analysis and modelling. Therefore, the heat transfer state is assumed to be stable. The heat transfer rate of a three-layer lining furnace body (Liao, et al. 2017) can be described as follows:
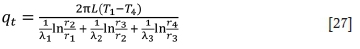
where T1is the temperature in the furnace, T4 is the outer wall temperature, λ1 is the thermal conductivity of magnesia brick, λ2 is the thermal conductivity of magnesia-chrome brick, λ, is the thermal conductivity of the shell, and η is the radius. In this work, λ1 = 3.49, λ2 = 1.42, λ, = 60, r1= 0.7 m, r2 = 1.0 m, r3 = 1.06 m, and r4 = 1.15 m. Therefore, the heat loss from the body of the furnace, q,, is 41.87ΔT.
The heat transfer rate at the bottom of the furnace (Liao, et al. 2017) can be described as follows:
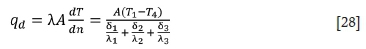
where δ1 = 0.6 m is the thickness of the magnesia brick, δ2 = 0.12 m is the thickness of magnesia-chrome brick, and δ3 = 0.1 m is the thickness of shell. Therefore, the heat loss from the bottom of the furnace, qd, is 3.12ΔT.
Flue gas heat loss calculation with expert rules
The flue gas is composed mainly of carbon monoxide, oxygen, argon, and some dust. Dust, which consists of solid particles, can be collected by the dust collector and the heat loss calculated together with that of the slag. Therefore, the flue gas is considered to be composed of carbon monoxide, carbon dioxide, oxygen, and argon only.
The flue gas heat can be calculated as follows:

where Cyis the specific heat capacity, m is the material quality, and Tgis the temperature of the flue gas.
The gas quality can be calculated as follows, assuming it follows the Ideal Gas Law:

where p is the gas pressure, V is the volume of gas, M is the molar mass of gas, and T is the gas temperature.
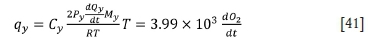
If the flue gas flow is substituted for the gas volume, the heat loss rates via the flue gas can be obtained as follows:
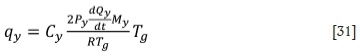
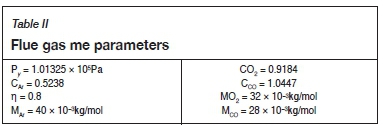
where Cyis the specific heat capacity of the flue gas, Pyis the flue gas pressure,  is the flue gas flow, Mvis the molar mass of flue gas, and R is the gas constant. From the oxygen utilization efficiency, the oxygen partial ratio, and the specific heat capacity of the gas, the specific heat capacity of the flue gas can be calculated. The pressure of the flue gas is equal to atmospheric pressure. From the oxygen utilization efficiency, the oxygen partial ratio, and the molar mass of the gas, the molar mass of the flue gas can be calculated. The flue gas temperature is about half of the furnace temperature (He, 2016). The values of some flue gas parameters (Chen, 1984; Gorges, Pulvemacher, and Rubens, 1978) are shown in Table II:
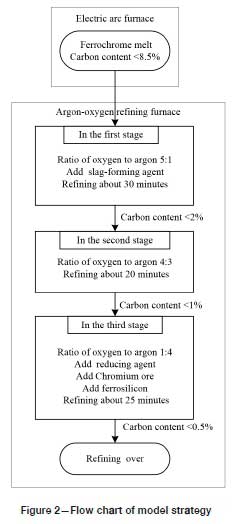
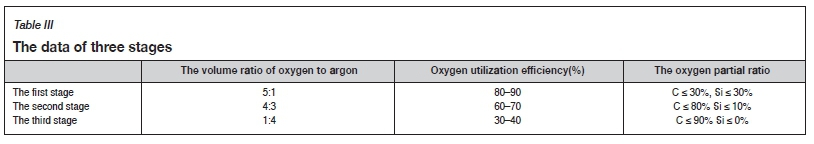
In order to lessen the oxidation of chromium and avoid excessive temperatures, the ratio of oxygen to argon needs to be adjusted with the carbon content and refining temperature of the furnace (Andersson et al., 2012). The physical and chemical reactions in the high-temperature refining process are very complex. The rate of reaction will be affected by factors such as the flow rate of oxygen, the amount of feed, and the rate of diffusion of elements in the bath (Odenthal, 2010). Therefore, the amounts of argon and oxygen should be adjusted according to expert rules. In the early stage of refining, slag-forming agent should be added to prevent chromium volatilization. In the later stage of refining, deoxidizer should be added to remove oxygen in the bath. Chromium ore should be added to increase the chromium content of the end product. Figure 2 shows the flow chart of the model strategy. The whole process is divided into three stages based on expert rules. The corresponding information is listed in Table III.
From the ratio of the gases and the oxygen utilization efficiency, the flow rate of flue gas for the three stages can be calculated separately.
For the first stage:
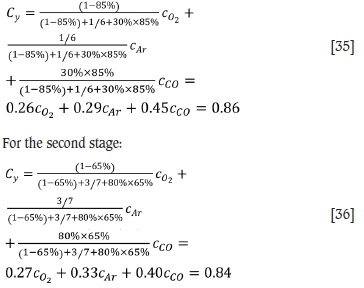
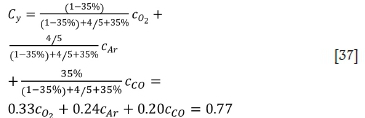
The specific heat capacity of the flue gas can be calculated based on the ratio of carbon monoxide, oxygen, and argon as follows:
For the first stage:
For the third stage:
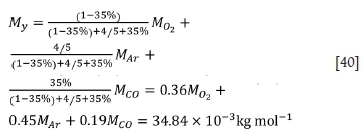
The molar mass of the flue gas can be calculated based on the carbon monoxide, oxygen, and argon contents as follows:
For the first stage:
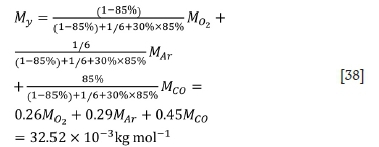
For the second stage:
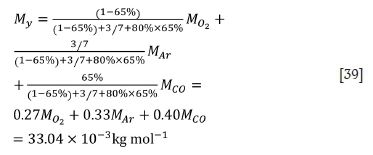
For the third stage:
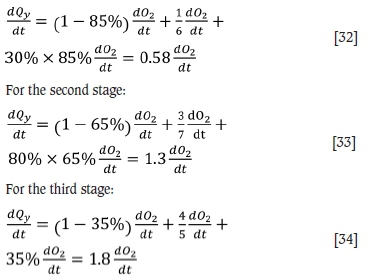
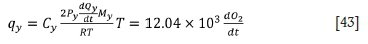
The heat loss rates via flue gas in the three stages are calculated as follows:
For the first stage:
For the second stage:
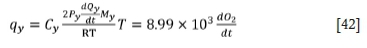
For the third stage:
It can be shown from the model that the bath temperature is related to the oxygen blowing rate, the oxygen blowing time, and the weight of the ferrochrome. Hence the bath temperature can be predicted as follows.
For the first stage:
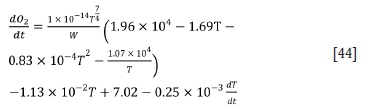
For the second stage:
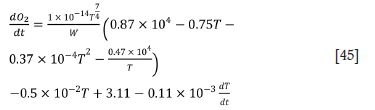
For the third stage:
Experimental results and analysis
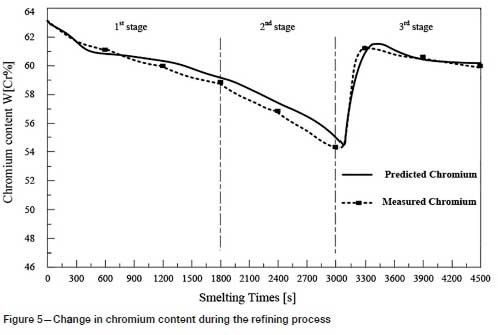
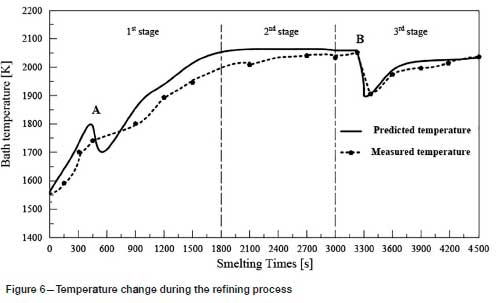
Twenty production tests were carried out in a 5 t argon-oxygen refining furnace, and the results compared with the predicted values. As shown in Figures 3-6, the changes in carbon, silicon, and chromium content and temperature during the refining process can be clearly seen.
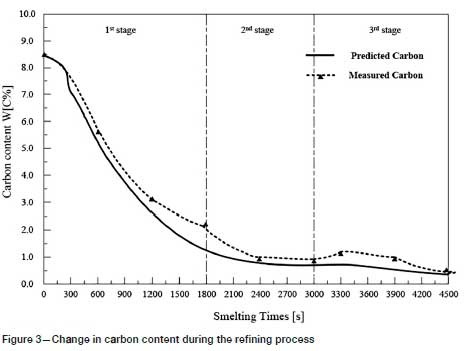
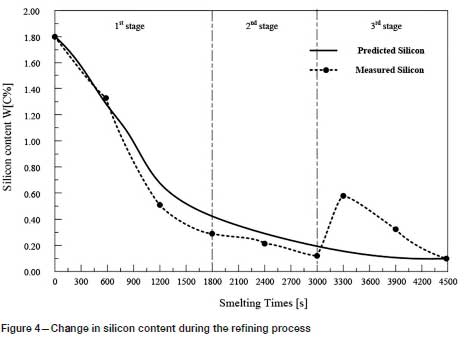
The reducing agent is fed into the refining process in the third stage and affects the contents of C and Si in the reaction. Therefore, the actual contents of C and Si in the third stage show a large deviation from the predicted values.
Temperature is the most important parameter in the whole argon-oxygen refining process. The control of C, Si, and Cr contents and temperature are closely related. The changes in C, Si, and Cr content are shown in Figures 3-5, and the corresponding temperature change trend is shown in Figure 6.
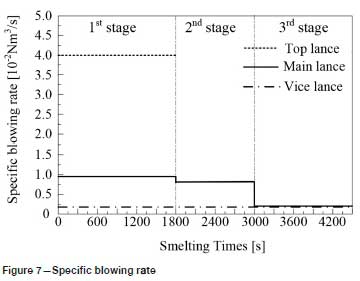
In the first reaction stage, the top lance supplies oxygen from the top of the furnace, the main lance supplies the oxygen- argon mixture from the bottom of the furnace, and the secondary lance supplies argon from the bottom of the furnace. The ratio of oxygen to argon is 5:1. Elements such as carbon, chromium, and silicon in the ferrochrome melt are oxidized rapidly, and the refining temperature increases rapidly due to the exothermic oxidation reactions. In order to reduce the volatilization of chromium, 150 kg of slag-forming agent is added, and the refining temperature drops slightly.
At the end of the first reaction stage, the temperature reaches 2047K, the carbon content falls to 1.24%, and the silicon content is 0.49%. This takes about 30 minutes, and the total amount of oxygen blown is about 105 Nm3. The oxidation rate of chromium slows down. In the second reaction stage, the top lance stops supplying oxygen, the main lance supplies the oxygen- argon mixture, and the secondary lance supplies argon. The ratio of oxygen to argon is 4:3. The total supply of oxygen is reduced, the supply of argon is increased, and the temperature of the molten pool is allowed to rise in a controlled fashion. The oxidation of carbon and oxygen takes place mainly in the molten pool, the carbon content is further reduced, the oxidative heat release and heat dissipation are balanced, and the temperature of the bath tends to be stable. After 20 minutes of refining, the total amount of oxygen blown is about 55 m3, the carbon content is 0.96%, and the temperature is 2053K. Entering the third reaction stage, the ratio of oxygen to argon blown is 1:4. 100 kg of reducing agent is added to reduce the chromium from the slag. In order to increase the chromium content at the end of the refining process, 200 kg of chromium ore is added, and 150 kg of ferrosilicon is added to remove oxygen. After 25 minutes, refining is stopped. The total oxygen supply is about 30 m3, the final carbon content is 0.43%, the chromium content is 60.1%, and the temperature is 2036K.
The specific blowing rate is shown in Figure 7.
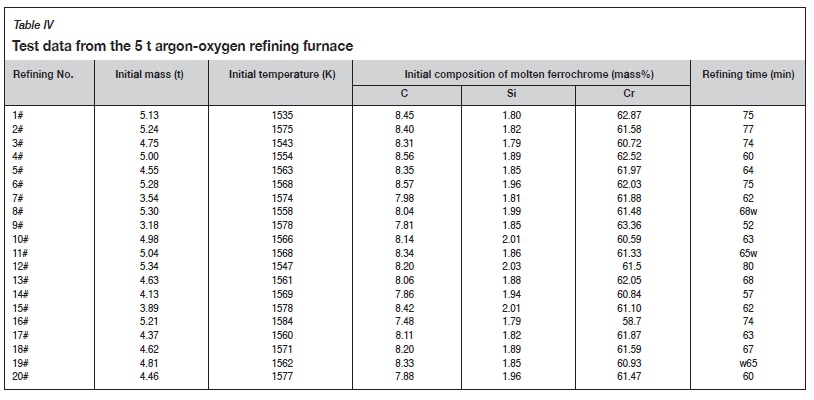
The test data is shown in Table IV, which lists the liquid phase mass, initial temperature, composition, and refining time.
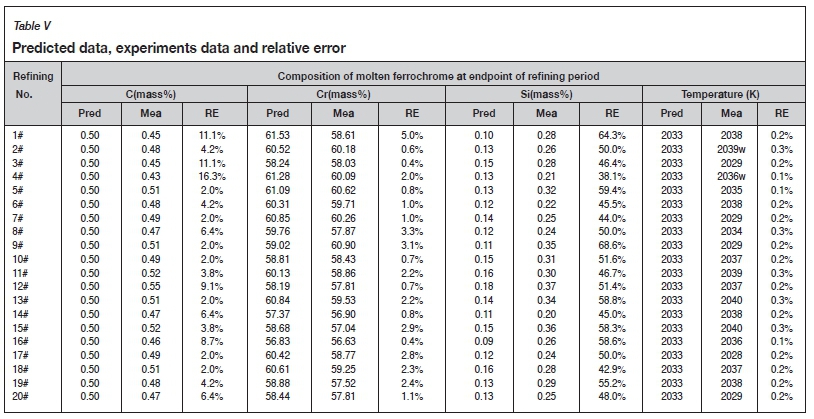
The predicted and experiments data for the 20 production tests are listed in Table V. The maximum absolute errors between the model predictions and the measured values of carbon content, chromium content, and temperature are 0.07 mass%, 2.92 mass%, and 6K, respectively. The average relative errors between the predicted and the measured values of carbon content, chromium content, and temperature are 5.49%, 1.79%, and 0.21%, respectively. The results show that the model can accurately predict the contents of the main components at the refining end point and the refining temperature, which proves that the model is reliable. However, the predicted value of the silicon content deviates considerably from the measured value. The reason for this is that deoxidizers were been added in the later stages of refining.
Conclusion
A mathematical model has been established for refining low-carbon ferrochrome based on high-temperature oxidation reactions, mass transfer theory, and expert rules. The effectiveness of the model was verified by comparing the predicted compositions of the metal phase with the measured values from 20 test runs in a 5 t argon-oxygen refining furnace. Statistical analysis of the results showed that the prediction accuracy is high in terms of final carbon content, chromium content, and metal bath temperature. The model can accurately estimate the refining end point composition and the temperature, and can be used to guide the production of low-carbon ferrochrome by the AOD process. The experimental data, such as furnace capacity, geometry, and additives, can be adjusted to the actual production requirements.
List of symbols
Wm Mass of liquid ferrochrome (kg)
Ws Mass of slag (kg)
Tg Temperature of flue gas (K)
T0 Initial temperature (K)
Tc Room temperature (K)
dW[i]%/dt Change rate of element i in metal bath (mol/(kg-s))
dOßt Oxygen blowing rate (Nm3/s)
dAr/dt Argon blowing rate (Nm3/s)
Mit Reaction enthalpy of element i (J/mol)
Mi Molar mass of element i (kg/mol)
Qt Heat transfer through furnace body (J)
I Heat transfer through the bottom of the furnace (J)
Cm Specific heat capacity of the ferrochrome melt at constant pressure (J/(kg-K))
Ci Specific heat capacity of element i at constant pressure (J/(kg-K))
Cs Specific heat capacity at constant pressure of the slag (J/(kg-K))
A Surface area (m2)
R Gas constant (J/(mol-K))
m Mass (kg)
dn/dt Mass transfer rate of element i (V/s)
∆C[O] Equilibrium concentration of oxygen (mol/m3)
Ipg Ambient pressure (Pa)
te Contact time (s)
g Standard gravity (m/s2)
ΔωΜ Degree of supersaturation (mol/m3)
Cy Specific heat capacity of the flue gas at constant pressure (J/(kg-K))
Vy Flue gas volume (m3)
py Flue gas pressure (Pa)
qy Heat loss rate via flue gas (J/s)
k Mass transfer coefficient of element i (m/s)
Dt Diffusion coefficient (m2/s)
r Radius (m)
h Depth of the furnace (m)
qt Heat transfer rate through furnace body (J/s)
qd Heat transfer rate through the bottom of the furnace (J/s)
λ Heat conductivity (W/(m-K))
δi Thickness of the diffusion boundary layer (m)
ρι Density of element i (kg/m3)
π Mathematical constant (m)
Acknowledgement
The authors gratefully acknowledge the support of the National Natural Science Foundation of China (51374040).
References
Akimov, E.N., VoRöNov, Y.I., Senin, A.V., and Roshchin, V.E. 2013. Production low-carbon ferrochrome with low content of phosphorus using the complex reducer. INFACONXIII. Proceedings of the Thirteenth International Ferroalloys Congress: Efficient Technologies in Ferroalloy Industry, Almaty, Kazakhstan. pp. 49-56. https://www.pyrometallurgy.co.za/InfaconXIII/0049-Akimov.pdf [ Links ]
Andersson, J-A. 1988. A thermodynamic evaluation of the Fe-Cr-C system. Metallurgical Transactions A, vol. 19A. pp. 627-636. [ Links ]
Andersson, N.Á.I., Anders, T., Jonsson, L.T.I., and Jönsson. PG. 2012. An in-depth model-based analysis of decarburization in the AOD process. Steel Research International, vol. 83, no. 11. pp. 1039-1052. [ Links ]
Bhonde, P.J., Ghodgaonkar, A.m., and Angal, R.D. 2007. Various techniques to produce low carbon ferrochrome. INFACON XI: Proceedings of the 11th International Conference on Innovations in the Ferro Alloy Industry. Indian Ferro Alloy Producers Association, New Delhi. pp. 85-90. https://www.pyrometallurgy.co.za/InfaconXI/085-Bhonde.pdf [ Links ]
Bi, M. 1975. Equilibrium relationship of oxygen decarburization for ferrochrome. Iron and Steel, no. 2. pp. 86-88. [ Links ]
Booysen, L.M., Nelson, L.R., Narayana, S.K., and Visser, M. 1998. Development of an operator guidance system for intermediate carbon charge chromium production. Proceedings of INFACON 8, Beijing, China, 7-10 June 1998. pp. 343-349. https://www.pyrometallurgy.co.za/InfaconVIII/343-Booysen.pdf [ Links ]
Cai, H.D. 1995. Thermodynamics and kinetics of stainless steel refining. Metallurgy of Sichuan, no. 3. pp. 19, 25-29. [ Links ]
Chen, J. 1984. Handbook of Common Using, Graphs and Tables in Steelmaking. Metallurgical Industry Press. Beijing. [ Links ]
Debroy, T. and Robertson, D.G.C. 1978a. A mathematical model for stainless steelmaking. Part I. Argon oxygen steam mixtures. Ironmaking and Steelmaking, vol. 5. pp. 198-206. [ Links ]
Debroy, T. and Robertson, D.G.C. 1978b. A mathematical model for stainless steelmaking. Part II. Application to AOD heats. Ironmaking and Steelmaking, vol. 5. pp. 206-210. [ Links ]
Deo. B. and Srivastava, V. 2003. Process control and optimization of the AOD process using genetic algorithm. Materials and Manufacturing Processes, vol. 18. pp. 401-408. [ Links ]
Farrera-Buenrostro, J.E., Hernández-Bocanegra, CA., Ramos-Banderas, J.A., Torres-Alonso, E., López-Granados, N.M., and RamIrez-Argáez M.A. 2019. Analysis of temperature losses of the liquid steel in a ladle furnace during desulfurization stage. Transactions of the Indian Institute of Metals, vol. 72, no. 4. pp. 899-909. [ Links ]
Gorges. H., Pulvemacher. W., and Rubens. W. 1978. Development and advantages of top blowing in combination with the AOD process at Fried. Iron & Steelmaker, vol. 5, no. 7. pp. 40-33. [ Links ]
Görnerup, M. and Sjöberg, P. 1999. AOD/CLU process modelling: optimum mixed reductants addition. Ironmaking and Steelmaking, vol. 26, no. 1. pp. 58-63. [ Links ]
Guo. H. 2006. Physical and Chemical Principles of Metallurgical Industry. Metallurgical Industry Press. Beijing. [ Links ]
He, G. 2016. Temperature control of the evaporative cooler outlet at converter steelmaking. Metallurgical Industry Automation, vol. 40, no. 5. pp. 26-30. [ Links ]
He, P., Xing, K.W., and Zhang R.S. 1994. Study on mass transfer behaviour of refining reduction of prereduced pellets in Fe-C melt. Engineering Chemistry & Metallurgy, vol. 15, no. 1. pp. 15-22. [ Links ]
Heikkinen, E-P. and Fabritius, T. 2012. Modelling of the refining processes in the production of ferrochrome and stainless steel. Recent Researches in Metallurgical Engineering - From Extraction to Forming. IntechOpen, London. https://cdn.intechopen.com/pdfs/32751/InTech-Modelling_of_the_refining_processes_in_the_production_of_ferrochrome_and_stainless_steel.pdf [ Links ]
Hockaday, S.A.C. and Bisaka, K. 2010. Some aspects of the production of ferrochrome alloys in pilot DC arc furnaces at Mintek. Proceedings of the Twelfth International Ferroalloys Congress: Sustainable Future, Helsinki, Finland. Outotec Oyj, Helsinki. pp. 367-376. http://www.mintek.co.za/Pyromet/Files/2010Hockaday.pdf [ Links ]
Li, W. 2001. Physical Chemistry of Metallurgy and Materials. Metallurgical Industry Publishing, Beijing. pp. 535. [ Links ]
Liao, C., Li, H., and You, J. 2017. Heat transfer technology, equipment and industrial applications. Chemical Industry Publishing, Beijing. pp. 14-17. [ Links ]
Manuela, CD., Komarov, S., and Sano, M. 1997. Bubble behaviour and absorption rate in gas injection through rotary lances. ISIJInternational, vol. 37, no. 1. pp. 1-8. [ Links ]
Odenthal, H-J. 2010. Simulation of fluid flow and oscillation of the argon oxygen decarburization (AOD) process. Metallurgical and Materials Transactions B, vol. 41B. pp. 396-413. [ Links ]
Qiu, D., Fu, Y-Y, Zhang, N., and Zhao, C.-X. 2013. Research on relationship model of dephosphorization efficiency and slag basicity based on support vector machine. Proceedings of the International Conference on Mechanical and Automation Engineering, Jiujang, China, 21-23 July 2013. pp. 184-187. https://www.computer.org/csdl/proceedings-article/maee/2013/4975a184/12OmNBPtJCi [ Links ]
Reichel, J. and Szekely, J. 1995. Mathematical models and experimental verification in the decarburization of industrial scale stainless steel melts. Iron and Steelmaker, vol. 5. pp. 41-48. [ Links ]
Turkdogan, E.T. 1980. Physical Chemistry of High Temperature Technology. Academic Publishing. New York. pp. 112-114. [ Links ]
Visuri, V-V., Järvinen, M., Sulasalmi, P., Heikkinen, E-P., Savolainen, J., and Fabritius, T. 2017. A mathematical model for reactions during top-blowing in the AOD process: Validation and results. Metallurgical and Materials Transactions B, vol. 48B. pp. 1868-1884. [ Links ]
Visuri, V-V., Järvinen, M., Sulasalmi, P., Heikkinen, E-P., Savolainen, J., and Fabritius. T. 2013a. A mathematical model for the reduction stage of the AOD process. Part I: Derivation of the model. ISIJ International, vol. 53, no. 4. pp. 603-612. [ Links ]
Visuri, V-V., Järvinen, M., Sulasalmi, P., Heikkinen, E-P., Savolainen, J., and Fabritius. T. 2013b. A mathematical model for the reduction stage of the AOD process. Part II: Model validation and results. ISIJ International, vol. 53, no. 4. pp. 613-621. [ Links ]
Vysokomornaya, O.V., Kuznetsov, G.V., and Strizhak, P.A. 2014. Mathematical simulation of heat and mass transfer processes at the ignition of liquid fuel by concentrated flux of radiation. Mathematical Problems in Engineering, vol. 2014. pp. 1-7. [ Links ]
Wei, J-H., Cao, Y., Zhu, H-L., and Chi, H-B. 2011. Mathematical modeling study on combined side and top blowing AOD refining process of stainless steel. ISIJ International, vol. 51, no. 3. pp. 365-374. [ Links ]
Wei, J-H. and Zhu, D-P. 2002a. Mathematical modeling of the argon-oxygen decarburization refining process of stainless steel: Part I. Mathematical model of the process. Metallurgical and Materials Transactions B, vol. 33B. pp. 111-119. [ Links ]
Wei, J-H. and Zhu, D-P. 2002b. Mathematical modeling of the argon-oxygen decarburization refining process of stainless steel: Part II. application of the model to industrial practice. Metallurgical and Materials Transactions B, vol. 33B. pp. 121-127. [ Links ]
Weitz, H. and Garbers-Craig A.M. 2016. Evaluation of the furnace method for the production of low carbon ferrochrome. Mineral Processing nd Extractive Metallurgy Review, vol. 37, no. 3, pp. 168-178. [ Links ]
 Correspondence:
W. You
Email: youwen@ccut.edu.cn
Received: 11 Feb. 2020
Revised: 8 Nov. 2020
Accepted: 10 Nov. 2020
Published: December 2020

