


Services on Demand
Article
 English (pdf)
 Article in xml format
 Article references
Indicators

Related links
-
 Cited by Google
 -
 Similars in Google
Share

 Permalink
Journal of the Southern African Institute of Mining and Metallurgy
On-line version ISSN 2411-9717
Print version ISSN 2225-6253
J. S. Afr. Inst. Min. Metall. vol.119 n.12 Johannesburg Dec. 2019
http://dx.doi.org/10.17159/2411-9717/113/324/19/2019
GENERAL PAPERS
Effect of discontinuity roughness and orientation on the parameters of the rock failure criterion under triaxial compressive stress
F. Aminpure; H. Moomivand
Mining Engineering Department Urmia University, Iran
SYNOPSIS
Discontinuity roughness is one of the most important parameters for understanding the mechanical characteristics of jointed rock under triaxial compressive stress. Discontinuity roughness can vary in a wide range and can play an important role in the failure mechanism of rock under triaxial stress, particularly with varying joint orientation angles and confining pressure. In this work, the effects of discontinuity roughness on rock strength under triaxial compressive stress were investigated. Different methods were applied to create cylindrical specimens with a wide range of discontinuity roughness and orientation angles. Fifteen groups of specimens with three different types of discontinuities roughness: tooth-shaped asperity (TSA), rough undulating (RU), and smooth and planar (SP) and five orientation angles (0,30,45 60, and 90 degrees) were tested, and in total 255 triaxial compression tests were carried out on jointed specimens. For specimens having different roughness and orientation angles of 45 and 60 degrees, failure took place in the direction of the discontinuity. Tooth-shaped asperities were interlocked and broken along the discontinuities, particularly under high confining pressures. For specimens having TSA discontinuity and an orientation angle of 60 degree, sliding occurred at one side of the teeth planes under uniaxial loading. Greater discontinuity interlocking and axial strength (σl)were observed with increasing roughness and confining pressure. The results show that the roughness and orientation angle of discontinuities have a major effect on the parameters of jointed rock failure criteria. New relationships between the failure criteria parameters, roughness, orientation angle, and uniaxial compressive strength of jointed specimens have been derived.
Keywords: jointing discontinuity, roughness, orientation, failure criterion.
Introduction
Discontinuities constitute planes of weakness that control the strength and mechanical behaviour of rock under triaxial stress. Roughness is one of the important parameters of discontinuities. Previous investigations on the effect of roughness have focused on the shear strength in direct shear tests (Jiang and Tanabashia, 2006; Saneie et al, 2013; Amanloo and Hosseinitoudeshki, 2013; Zhang et al, 2014; Hencher and Richards, 2015; Sivanathan Thirukumaran, and Indraratn, 2016). Direct shear tests have been conducted.under two boundary conditions: constant normal load/stress (CNL) and constant normal stiffness (CNS). Under CNL boundary conditions, the normal stress remains constant and the surface of the joint dilates freely during shearing. However, in a CNS condition, dilation of the joint is constrained by the confined environment formed across the interface. The CNS condition shows higher values of peak shear strength, friction angle, and cohesive strength than the CNL condition, thus CNL test results lead to underestimated shear strengths. The CNS condition shows the effect of rock joint roughness more than the CNL condition, whereas there cannot be the complexity of CNL and CNS conditions for testing the strength of a jointed specimen.under triaxial compressive stress. Furthermore, direct shear test results cannot represent the effect of discontinuity orientation angles on the failure mechanism and strength of jointed rock.
Sinha and Singh (2000) tested cylindrical specimens made of plastics, with undulating and planar discontinuity surfaces with orientation angles from 5 to 50 degrees with respect to the minimum principal stress. They used infill material (gouge) inside the discontinuities and, due to the 5 to 30 mm gouge thickness, the two sides of the discontinuities were not in contact under loading. Hence, the strength and mechanical behaviour of the specimens were not influenced by the discontinuity roughness, but were mainly controlled by the infill material. More attention has also been paid to the effect of discontinuity orientation on jointed rock strength (Verma and Singh, 2010; Asadi and Bagheripour, 2014; Moomivand, 2014). However, the effect of roughness of discontinuities with different orientations on the failure criterion of jointed rock under triaxial stress is not clear. The preparation of cylindrical specimens having different discontinuity roughnesses and orientation angles is a difficult task. A wide range of discontinuity surface roughness is also necessary to investigate the effect of discontinuity roughness on the failure criterion of rock (Ramamurthy, 2001; Hoek, Carranza-Torres, and Corkum, 2002) under triaxial compressive stress. This is important to show how the discontinuity roughness and orientation angle affect the failure mechanism and the parameters of jointed rock failure criterion.
The purpose of this research is to identify the effect of discontinuity roughness on the parameters of jointed rock failure criterion under triaxial compressive stress. Discontinuities can have orientation angles from zero to 90 degrees with respect to the minimum principal stress. Three types of discontinuity roughness: tooth-shaped asperity (TSA), rough undulating (RU), and smooth plane (SP), covering a wide range of discontinuity roughness, were tested. However, TSA discontinuity is not exactly the same as rock discontinuity. TSA discontinuity has been used by many researchers for physical and numerical modelling of rock discontinuities to indicate the effect of discontinuity roughness on the strength and failure mechanism of jointed rock (Patten, 1966; Bock, 1978; Tatone, 2014; Wei et ah, 2018; Wua et at, 2018). Specimens having TSA discontinuity could not be made from actual rock samples because two sides of the discontinuity could not be coupled to contact each other. In this research, this type of discontinuity roughness was prepared from a rock-like material using physical modelling. Physical modelling is a useful tool for investigating the mechanical behaviour of rock as a heterogeneous material for various purposes. Its advantages include technical feasibility, and reduced cost and time. Just as each rock type has its typical mechanical properties, a rock-like material has its own typical behaviour.
A number of researchers have investigated the applicability of various model materials to simulate rock (Stimpson, 1970; Hobbs, 1966; Saucier, 1967; Rosenblad, 1968; Johnston and Choi, 1986; Indraratna, 1990; Gu and Mostyn, 1992; Gu, Jafari and Mostyn, 1993; Vutukuri and Moomivand, 1996). Many materials and combinations of materials have been used for various types of modelling works. A good classification of model materials was given by Stimpson (1970) based on differences in the components and applications for different purposes. The materials used include Portland cement mortar, plaster, concrete, pumice, and cork. The materials used most frequently are either plaster or cement with various filler materials (Hobbs, 1966; Saucier, 1967; Rosenblad, 1968; Johnston and Choi, 1986; Indraratna, 1990; Gu and Mostyn, 1992; Gu, Jafari and Mostyn, 1993). Plaster and filler materials were found to be the most practical and feasible materials for modelling brittle rocks (Saucier, 1967). The constituents of materials greatly affect the technique of modelling and the mechanical properties of the specimens (Moomivand, 1996; Vutukuri and Moomivand, 1996).
In this investigation, TSA discontinuities were made using a rock-like material consisting of plaster and sand filler. The specimens with RU and SP discontinuities were prepared successfully using Naghdeh limestone. Naqadeh is located in 23 km south of Lake Urmia in the West Azerbaijan Province of Iran. Limestone has a uniform texture and is suitable for cutting to create proper jointed specimens.
Because of the complexity of rock mass discontinuities, a very limited number of rock mass failure criteria have been developed. In practice, the failure criteria of Hoek, Carranza-Torres, and Corkum (2002) and Ramamurthy (2001) represent better the strength of rock with discontinuities, particularly under triaxial compressive stress. The failure criteria of Ramamurthy (2001) and Hoek, Carranza-Torres, and Corkum (2002) were applied to analyse the test results in this investigation.
Specimen preparation
Three techniques were used to prepare cylindrical specimens with TSA, RU, and SP discontinuities. The TSA discontinuities were made in a brittle rocklike material consisting of plaster and sand filling material, borax, and water. Specimens with RU and SP discontinuity surfaces were prepared using Naghdeh limestone, which has a uniform texture and it is suitable for cutting to create proper jointed specimens.
The constituents of materials greatly affect the modelling technique and the mechanical properties of the specimens. Sand with a grain size between 0.09 mm and 1.2 mm was used as filler in the model material, based on previous experience (Moomivand, 1996; Vutukuri and Moomivand, 1996). The proportions by weight of the constituents were plaster to plaster plus sand equal to 50%, water to plaster plus sand equal to 24%, and borax to water equal to 5%. (Table I), based on previous experience (Moomivand, 1996; Vutukuri and Moomivand, 1996) and the experimental design. The selected water content depends on the weight of plaster in the mixture, workability of the mixture, and mechanical properties of specimens required to simulate rock (Moomivand, 1996; Vutukuri and Moomivand, 1996). Borax was used as a retarder to slow down the rate of setting of the plaster.
Ten hollow cylindrical moulds of PVC pipe with an internal diameter of 54.5 mm (equal to the internal diameter of the Hoek and Franklin (1968) triaxial cell), length of 15 cm, and wrapped with hose clamps were designed. Homogeneous cylindrical specimens without discontinuities 54.5 mm in diameter and approximately 109 mm in length (length-to-diameter ratio about 2) were made as suggested in the standard (ASTM, 1997). For creating TSA discontinuity surfaces using the model material, the surface was first moulded by polystyrene foam. Cylindrical polystyrene foam cores 54.5 mm in diameter were prepared by core drilling. The orientation angles of 0, 30, 45, 60, and 90 degrees were made by the core cutter machine, using cylindrical foam moulds, in the rock mechanics laboratory. The TSA was created on each side of foam moulds with a particular plane orientation angle. The cylindrical foam mould and the process of preparing a specimen with a TSA discontinuity with orientation angle of 30 degree is shown in Figure 1.
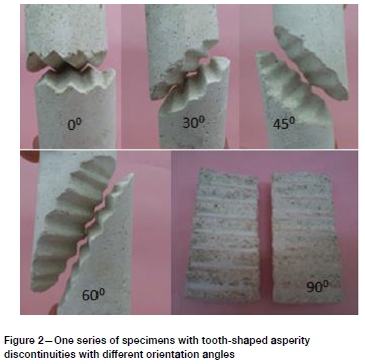
The cylindrical foam moulds were put inside the PVC pipe moulds for casting one side (first side) of the TSA discontinuities using the model material. After the model material had set, the TSA foam moulds were removed from the PVC pipe moulds. A very thin layer of plaster powder was spread over the first side of TSA discontinuity to prevent the second part from sticking onto the first part. The second part of the specimens was completed by casting the model material in the second side of the TSA discontinuity in place of the foam mould. After the second part of the model material had set, the jointed cylindrical specimen was easily removed from PVC pipe mould by opening the clamps. Five groups of specimens with TSA discontinuities oriented at 0, 30, 45, 60, and 90 degrees were dried in the open air at room temperature for two weeks. One series of specimens is shown in Figure 2.
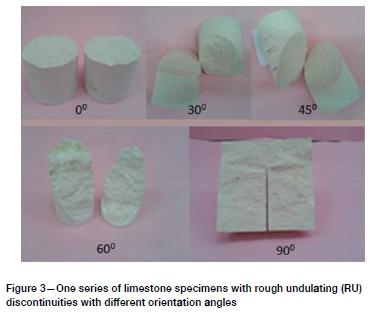
Specimens with RU and SP discontinuity surfaces were prepared from limestone. Several methods were used to create RU discontinuities with different orientation angles. For these specimens, first a fracture was created in a limestone block. The block was then put in a box and fixed by plaster, with respect to the discontinuity orientation angle relative to the horizontal direction. Finally, the cylindrical specimen having RU discontinuity surface with the desired orientation angle was created by a drilling a core. This method of creating RU discontinuities was difficult and time-consuming. Nevertheless, five groups of specimens with discontinuities at 0, 30, 45, 60, and 90 degrees were prepared successfully. A series of such specimens is shown in Figure 3.
Specimens with smooth and planar (SP) discontinuities were prepared by cutting cylindrical limestone specimens at angles of 0, 30, 45, and 60 degrees using a core cutter machine. Preparation of these specimens was much easier in comparison to the specimens with TSA and RU discontinuity surfaces.
Test work
Uniaxial compressive strength (σci) and tensile strength (σt) using the Brazilian test were measured for model material and Naghadeh limestone according to ASTM (1994a, 1994b) standards. All specimens were tested in an ELE testing machine at a loading rate of 0.5 to 1 MPa/s. The average uniaxial compressive strength (σclav) of the model material was found to be 19.7 ±2.38 MPa, and the average tensile strength (σlav) 1.64 ±0.32 MPa. For Naghadeh limestone, the average uniaxial compressive strength (σclav) was 28.81 ±1.38 MPa and the average tensile strength (σtav) 2.30 ±0.40 MPa. Uniaxial and triaxial compressive strength tests on fifteen groups of cylindrical specimens with the three types of discontinuity roughness (TSA, RU, and SP) and five orientation angles (0, 30, 45, 60, and 90 degrees) were performed by the testing machine and Hoek and Franklin (1968) triaxial cell according to standard (ASTM, 1997). The ELE testing machine, confining pressure system, and triaxial cell are shown in Figure 4. In the triaxial test, an initial confining pressure (0.1 MPa) was applied for setting the specimen inside the cell and between the two platens of the testing machine. The confining pressure, as well as the axial stress, were then applied slowly until the predetermined value of confining pressure was reached. The axial load was subsequently increased continuously at a constant rate of 0.5 MPa/s until the specimen failed under triaxial compressive stress. After reaching the peak strength, the axial stress was reduced and the testing machine automatically saved the peak strength value. Discontinuity sliding inside the cell could not be observed during the triaxial tests. The Hoek cell sleeves were ruptured several times or the specimens became stuck inside the cell, especially those with discontinuities orientated at 45 and 60 degrees.
The specimens with TSA discontinuities were tested under confining pressures of 2.5, 5, 7, and 10 MPa, as the model material behaved in a brittle fashion at confining pressures less than about 10 MPa. The limestone specimens with RU and SP discontinuities were tested at confining pressures of 5, 7, 10, 14, and 20 MPa. These specimens were brittle up to a confining pressure of about 20 MPa or less because, under this confining pressure, after peak strength the axial stress decreased, but not for a greater confining pressure under high axial loading.
In specimens with SP discontinuities, sliding occurred freely during shearing along the discontinuity. Sliding also occurred freely for TSA and RU discontinuities under uniaxial compressive stress. Effectively, for specimens with a TSA discontinuity and orientation angle of 60 degrees, sliding freely took place at one side of the teeth planes under uniaxial compressive stress. However, this could not occur with increases of confining pressure, as the asperities were interlocked until they broke along the discontinuities.
Nevertheless, the discontinuity interlocking was greater with increasing roughness and confining pressure, especially for TSA and RU discontinuities. For all specimens (TSA, RU, and SP discontinuities) with orientation angles of zero and 90 degrees, failure occurred in the body of the specimens under all confining pressures. However, specimens with discontinuities orientated at 90 degrees underwent lateral expansion, during which the discontinuity's aperture was further opened under increasing uniaxial compressive stress. As an example, the mode of failure of the specimens with TSA discontinuities orientated at 0, 30, 45, 60, and 90 degrees is shown in Figure 5. For some SP discontinuities with an orientation angle of 30 degrees, failure took place along the direction of the discontinuity but for RU and TSA discontinuities, failure occurred in the body of the specimens (Figures 5 and 6). For all specimens with TS, RU, and SP discontinuities at orientation angles of 45 and 60 degrees, failure took place along the discontinuities under uniaxial and triaxial loading, except for some TSA discontinuities orientated at 45 degrees under a confining pressure of 7 MPa, in which failure occurred in the body of the specimens. For specimens with a TSA discontinuity and orientation angle of 60 degrees, sliding took place on one side of the teeth planes under uniaxial compressive stress (Figure 5), as the axial compressive strength had the lowest value (1.76 MPa). The TSA discontinuity orientated at 60 degrees was interlocked as the teeth were broken along the discontinuity at confining pressures of 2.5 MPa and above.
Effect of discontinuity roughness and orientation on the strength and failure criteria
The presence of discontinuities increases the complexity of defining a rock mass failure criterion that adequately captures the rock mass behaviour. The results of this investigation are analysed using two criteria that represent comprehensively the strength of discontinuous rock under triaxial stresses: the Ramamurthy (2001) and Hoek-Brown (Hoek, Carranza-Torres, and Corkum, 2002) rock mass failure criteria.
Ramamurthy rock mass failure criterion
Ramamurthy, Rao, and Rao (1985) proposed the initial version of the intact rock failure criterion, which was later revised
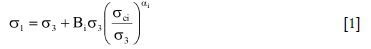
•Ramamurthy, 1993, 2001; Ramamurthy and Aurora, 1994). Ramamurthy's revised intact rock failure criterion (Ramamurthy, 2001) is as follows:
where
σ1 = maximum principal stress (MPa)
σ3 = minimum principal stress (MPa)
σci = uniaxial compressive strength of intact rock (MPa)
ai = constant for intact rock
Bi = triaxial compressive strength factor.
Ramamurthy, Rao, and Rao (1985) and Ramamurthy (2001) proposed Bi values for some intact rocks. The failure criterion of Ramamurthy (2001, 2008) for jointed rock mass under triaxial stress is as follows:
where
σ3= minimum principal stress (MPa)
σ1= maximum principal stress (or axial strength) (MPa)
σcj = uniaxial compressive strength of jointed rock (MPa)
Bj= triaxial strength factor of jointed rock
aj = constant power for jointed rock
Jn = frequency of joints, i.e. number of joints per metre
n = joint inclination coefficien
r = parameter of joint resistance (joint friction)
Jr, = joint factor
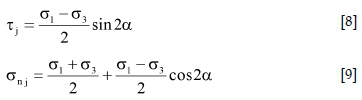
tj= shear strength along the joint
σnj= normal stress on the joint
фi = friction angle of the joint
i subscript represents intact rock
j subscript represents jointed rock.
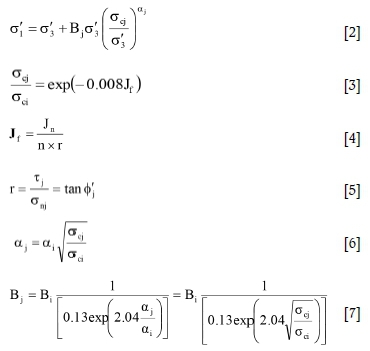
Ramamurthy's joint factor (J,) incorporates the effect of a combination of three factors: orientation of the joints (n), the frequency of joints (J„), and joint resistance (r). The parameter n is determined from a table given by Ramamurthy (2008). The joint resistance parameter (r) is determined using the ratio of shear strength along a joint to the normal stress on the joint (Equation [5]). The joint factor (Jt) is zero for intact rock and can be more than 500 per metre for a heavily jointed rock mass. A larger value of J, indicates a weaker rock mass.
To analyse the relationship between σcj/σciand Jf Jf was first determined from the test results, as a function of the joint orientation coefficient (n) and the frequency of joints (Jn), using the method given by Ramamurthy (2008). The joint resistance coefficient (r) was determined by carrying out direct shear tests on smooth and planar joints. The joint resistance coefficient (r) for the TSA and RU discontinuities could not be assessed using direct shear tests. That is because the normal stress on the joint increases with increasing shear stress in the direct shear test system for rough discontinuity surfaces. In order to determine the joint resistance coefficient (r) for TSA and RU discontinuities, indirect shear and normal stresses from the maximum principal stress (σ1) and minimum principal stress (σ3) in triaxial strength test results for an orientation angle of 60 degrees were used. That is because under all confining pressures, failure occurred along TSA and RU discontinuities at 60 degrees. A series of paired data of the shear strength along the joint and normal stress on the joint was first determined by stress transformation equations using σ1 and σ3 from the test results for an orientation angle (transformation angle) of 60 degrees as follows:
Then, the joint resistance parameter (r) was determined by Equation [5] using the obtained pair results of the indirect values of shear strength (tj) and normal stress (σnj). Joint resistance coefficients (r) of 0.818, 0.730, and 0.631 were obtained for TSA, RU, and SP discontinuities respectively.
The joint factor (jr) was determined using the results for three parameters: the joint inclination coefficient (n), the frequency of joints (Jn), and the joint resistance coefficient (r). As an example, for the RU4 group at an orientation angle of 60 degrees, jris as follows:
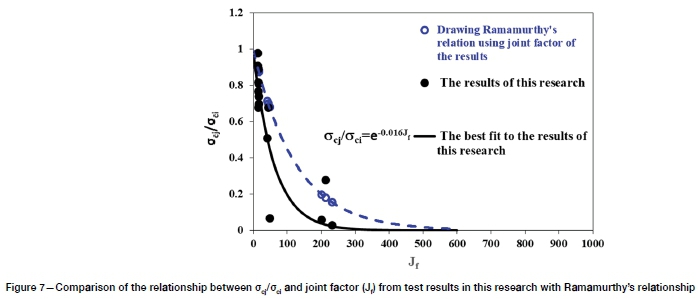
The calculated ratio of the uniaxial compressive strength of jointed rock to that of intact rock (σcj/σci) obtained using Equation [3] is equal to 0.66, whereas the ratio evaluated from the results for this group is 0.06. The ratio of σcj/σci was determined for fifteen groups of test results. The obtained relationship between the σcj/σciratio and Jf for the test results is as follows:
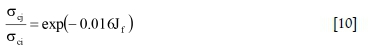
The ratio of σcj/σciwas also assessed using jrbased on Equation [3] proposed by Ramamurthy (2008). The relationship between σcj/σci and the joint factor (jf) from the test results was compared with the relationship estimated by Ramamurthy's equation (Figure 7).
The coefficient of Jr is -0.008 in Ramamurthy's equation (Equation [3], whereas this coefficient is -0.016 for the results of this research (Equation [10]). Coefficients of Jr.between-0.00123 and -0.025 were also obtained from extensive experimentation on different patterns of jointed blocks under uniaxial compression (Singh, Rao, and Ramamurthy, 2002). The σcj/σci ratio has the greatest value for the lowest joint factor, rapidly decreases with increasing joint factor (jr), and approaches zero at higher joint factor values. However, when using jrfor the assessment of σcj/ σci,and Bj, not only are the uniaxial and triaxial test results not used, but also different relationships between the σcj/σciratio and Jf have been reported. Hence, the values for the σcj/σciratio, aj, and Bj may not be reliable.
To analyse the results by Ramamurthy's failure criterion, two procedures were used.
>• Determine aj using the σcj/σciratio and aifrom the results with Equation [6], and then assess Bj by analysing the triaxial test results with the DataFit computer program (Datafit, 1992). In this case, the obtained failure criterion can be a more reliable representation of the uniaxial and triaxial test results.
> Determine oij using the σcj/σciratio and from the results with Equation [6], and then calculate B, with the σcj/σciratio from the test results using Equation [7]. In this case, the triaxial test results are not used to determine Bj
First, the value of the triaxial compressive strength factor (B,) in Ramamurthy's failure criterion was obtained from the triaxial compressive strength test results for intact model material and limestone using DataFit. Values of 2.94 and 2.35 were obtained for model material and intact limestone respectively. Then, fifteen groups of test results conducted on specimens with different discontinuity roughness and orientations were analysed using Ramamurthy's failure criterion for jointed rock (Equation [2]). The power constant for jointed rock (aj) was determined by the a, and σcj/σc1 ratio of the test results.
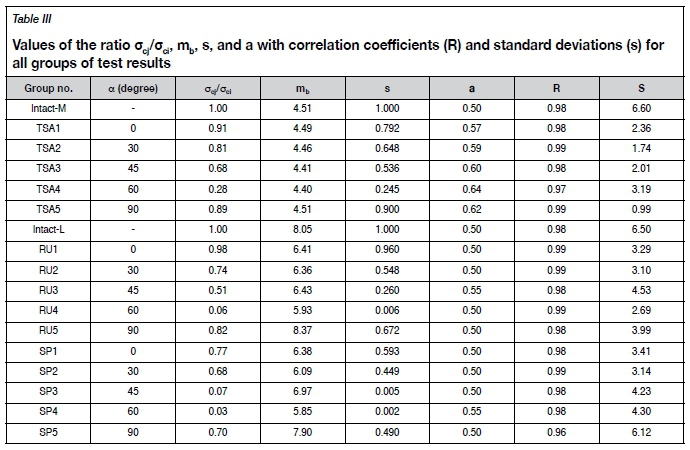
The triaxial compressive strength factor of jointed rock (B,) was determined using aj, and σciin Ramamurthy's failure criterion (Equation [2]) by fitting the test results using DataFit (Datafit, 1992). The values of σcj, and the assessed parameters of Bj and ai, with the correlation coefficient (R) and standard deviation (S) of the best fit failure criterion, are shown in Table II. The relationship between axial strength (σ1) and confining pressure (σ3) for test results from the intact model material (Intact-M) and from specimens with TSA discontinuities oriented at 0, 30, 45, 60, and 90 degrees is shown in Figure 8. The axial strength (σ1) of the intact model material is higher than for specimens with TSA discontinuities. The axial strength of the TSA specimens decreased with increasing orientation angle, with the minimum strength occurring at 60 degrees. The axial strengths (σ1) for the specimens with discontinuity orientation angles of zero and 90 degrees are approximately equal. The effect of roughness and orientation on the axial strength decreases with increasing confining pressure and becomes negligible at higher confining pressure. Effectively, the axial strength of specimens with a TSA discontinuity angled at 60 degree is closer to the axial strength of the intact model material under high confining pressure. TSA discontinuities are interlocked better than SP discontinuities under loading, particularly under high confining pressure.
The relationships between a1and o3for the test results for intact limestone (Intact-L) and for specimens with RU and SP discontinuities are shown in Figures 9 and 10 respectively. Limestone specimens with SP discontinuities have lower axial strength than specimens with RU discontinuities. The RU discontinuities are locked better than the SP discontinuities under loading. The axial strength of limestone specimens with RU and SP discontinuities decreases with increasing orientation angle, reaching a minimum at 60 degrees and then increase.
The differences between the axial strength of the limestone specimens with RU and SP discontinuities oriented at 0, 90, 30, and 45 degrees and the axial strength of the specimens with discontinuities oriented at 60 degrees decreases with increasing confining pressure. As shown in Figures 8, 9 and 10, the axial strength of the specimens with a discontinuity orientation angle of 60 degrees approaches that of intact limestone under high confining pressure. For all groups of test results, the axial strength and discontinuity interlocking was greater with higher roughness and confining pressure.
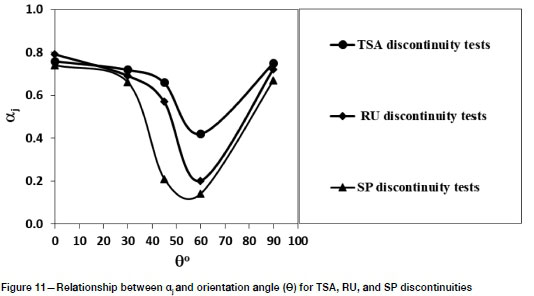
The parameter ajwas determined from the test results using Equation [6]. Figure 11 shows that ajdecreases with increasing roughness of discontinuities at all orientation angles. The parameter ajis highest for an orientation angle of zero degrees. It decreases slightly as the angle increases from zero to 30 degrees, then more sharply, reaching a minimum at 60 degrees, then increase again to 90 degrees, to a value just less than that at zero degrees (Figure 11). Figure 12 shows that the discontinuity orientation has the opposite effect on the parameter Bj in comparison with aj
The parameter Bj in Ramamurthy's failure criterion was calculated using Equation [7] and the σcj/σriratio from test results, without considering triaxial test results. These values for Bj were compared with the test results using DataFit. Figure 12 shows that the B, parameters obtained with DataFit have higher values than those from the test results.
The relationship between the triaxial strength factor (Bj) and the σcj/σciratio from the test results was analysed. A better correlation between Bj and σcj/σciwas obtained for each individual discontinuity type (TSA, RU, and SP) than for the combination of all results. Therefore, the relationships between Bj and σcj/ σciratio from test results for specimens with TSA, RU, and SP discontinuities at different orientations are obtained from Equations [11] and [12].
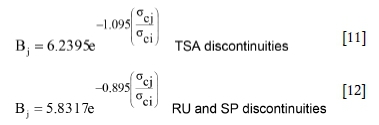
For all groups of test results, the triaxial strength factor (Bj) decreases exponentially with increasing σcj/σciratio, becoming equal to B¡ for a σcj/σc¡ ratio of unity. The relationship between B and σCJ/σciobtained from the test results is significantly different from that using the B, value estimated by Ramamurthy's method. Many other factors, such as infill material, discontinuity spacing, and number of discontinuity sets, can affect the parameters of the jointed rock failure criterion. Therefore, more results are necessary to better justify the relationships (Equations [11] and [12]).
Generalized Hoek-Brown.criterion
Parameters of the Hoek, Carranza-Torres, and Corkum (2002) rock mass failure criterion (the generalized Hoek-Brown criterion) were also analysed according to the roughness and orientation of discontinuities. The generalized Hoek-Brown rock mass failure criterion is as follows:
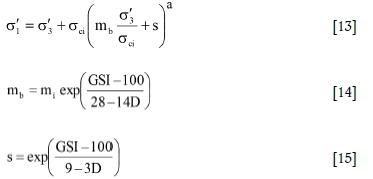
where
σci= unconfined compressive strength of intact rock (MPa)
mb = triaxial compressive strength factor of rock mass (MPa)
mi = material constant for the intact rock
GSI = Geological Strength Index
D = disturbance factor (account for blast damage and stress relaxation)
s and a are constants.
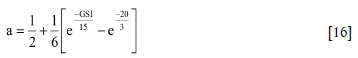
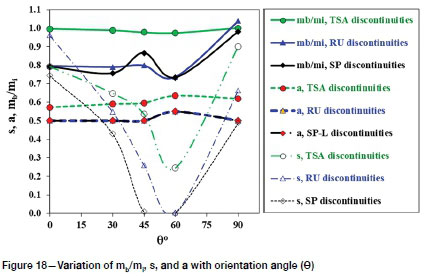
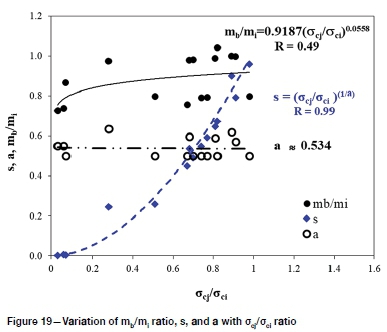
The material constant for the intact rock (mj was obtained by conducting statistical analysis using DataFit. Values of 8.05 and 4.51 were obtained for limestone (Intact-L) and model material (Intact-M) respectively. The rock mass material constants mb, s, and a were also determined by statistical analysis of 15 groups of test results from specimens having different discontinuity roughness and orientations (Table II). To clarify the effect of TSA, RU, and SP discontinuities and orientation angle on the axial strength, the dimensionless relationships between σ1/ σciand σ3/σciwere compared for each individual orientation angle. The results are shown in Figures 13-17. The rock mass material constant (a) varies from 0.5 to 0.636, corresponding to intact rock (GSI = 100) and very low quality rock mass (GSI = 5) respectively, according the generalized Hoek-Brown rock mass failure criterion. For orientation angles of zero and 90 degrees, the two parameters mb and s are approximately equal to rrii and unity, particularly for TSA and RU discontinuities. As shown in Figures 13 and 17, the failure criterion for jointed rock is similar to that for intact rock. For all groups of test results, the parameters mb and s decrease with increasing orientation angle from zero to a minimum at 60 degrees, increasing again at 90 degrees (Figure 18). Furthermore, the parameters mb and s are greater with increasing discontinuity roughness. The relationships between parameters mb, s, and a and the σCJ/σclratio from the test results were also analysed (Figure 19). Parameter s increase with an increase in σCJ/σclratio, but has an average value of approximately 0.534. A lower correlation (i.e. lower value of R) between mb and the σCJ/σciratio was obtained (Figure 19). Other factors than discontinuity roughness and orientation angle can affect the parameters of the jointed rock failure criterion, e.g. infill material, discontinuity spacing, and number of discontinuity sets. However, a higher correlation may be achieved using additional data such as triaxial test results on specimens with infill material, different discontinuity spacing, and discontinuity sets.
Conclusions
> Discontinuity interlocking becomes more significant with increasing roughness and confining pressure. The joint resistance parameter (r) increases with increasing roughness.
> For specimens with TSA, RU, and SP discontinuities orientated at zero and 90 degrees, failure occurred in the body of the specimens under all confining pressures. For some SP discontinuities with an orientation angle of 30 degrees, failure was observed along the direction of the discontinuity. For all specimens having discontinuity orientation angles from 45 to 60 degrees, failure took place in the direction of the discontinuity and tooth-shaped asperities were broken along the discontinuities, particularly under high confining pressures. However, for specimens with a TSA discontinuity angled at 60 degrees, sliding occurred at one side of teeth planes of the discontinuities under zero confining pressure as in this case the axial compressive strength had the lowest value.
> The effect of discontinuity roughness on the mode of failure was more significant for orientation angles of 30, 45, and 60 degrees.
> The effect of roughness and orientation on the axial strength decreases with increasing confining pressure and becomes negligible under higher confining pressures. The axial strength of specimens with a TSA discontinuity oriented at 60 degrees approaches the axial strength of the model material under high confining pressure.
> The discontinuity roughness and orientation angle have a great effect on the a, and Bj parameters in Ramamurthy's failure criterion.
> The new relationships obtained between the σcj/σciratio and joint factor (Jf), and Bj for fifteen groups of specimens with different discontinuity roughness and orientations are considerably different from the relationship proposed by Ramamurthy.
> The rock mass material constant (mb) of specimens with TSA discontinuities at different orientation angles is nearly equal to the rtij value for intact specimens.
> The effect of orientation angle on the failure mechanism and strength of jointed specimens depends on the discontinuity roughness.
Acknowledgments
The authors would like to thank Mr V. Mohebi, technical officer in the rock mechanics laboratory of Urmia University, for his continual assistance in manufacturing devices for modelling specimens.
ORCiD ID:
H Moomivand: https://orcid.org/0000-0002-6106-9779
References
Amanloo, F, and Hosseinitoudeshki, V, 2013, The effect of joint roughness coefficient (JRC) and joint compressive strength (JCS) on the displacement of tunnel, International Research Journal of Applied and Basic Sciences, vol. 4, no. 8, pp. 2216-2224. [ Links ]
Asadi, M, and Bagherfour, M.H, 2014, Numerical and intelligent modeling of triaxial strength of anisotropic jointed rock specimens, Earth Science Informatics, vol. 7, no. 3. pp. 165-172. [ Links ]
ASTM. 1994a. Unconflned compressive strength of intact rock core. ASTM Annual Book of Standards, D2938-86, West Conshohocken. PA. pp. 389-390. [ Links ]
ASTM. 1994b. Standard test method for splitting tensile strength of intact rock core specimens. ASTM Annual Book of Standards D3967-92, West Conshohocken. PA. pp. 433-435. [ Links ]
ASTM. 1997. Standard test method for triaxial compressive strength of undrained rock core specimens without pore pressure measurements. ASTM Annual Book of Standards, D2664 - 95a, West Conshohocken, PA. pp. 242-245. [ Links ]
Bock. H. 1978, An Introduction to Rock Mechanics, Department of CM and Systems Engineering, University of North Queensland, Townsville. [ Links ]
DataFit, 1992, Data fitting by linear and multiple non-linear regression, Macquarie Centre, NSW, Australia. [ Links ]
Gu, D, and Mostyn, G, 1992, A casting method for artificial rock specimens, Proceedings of the 11th International Conference on Ground Control in Mining, Aziz,, N.I. and Peng, S.S. (eds). University of Wollongong, Australia, pp. 588-592. [ Links ]
Gu, D., Jafari, M.R., and Mostyn, G, 1993, An artificial soft rock for physical modelling, Geotechnical Engineering of Hard Soils-Soft Rocks, Anagnostopoulos, A., Schlosser, F. Kalteziotis, N., and Frank, R. (eds), A.A. Balkema, Rotterdam. pp. 517-524. [ Links ]
Hencher, S.R. and Richards, L.R. 2015, Assessing the shear strength of rock discontinuities at laboratory and field scales, Rock Mechanics and Rock Engineering, vol. 48, no. 3. pp. 883-905. [ Links ]
Hobbs, D.W. 1966, Scale model studies of strata movement around mine roadways, International Journal of Rock Mechanics and Mining Sciences, vol. 3. pp. 101-127. [ Links ]
Hoek, E., Carranza-Torres, C, and Corkum, B, 2002, Hoek-Brown failure criterion - 2002 edition, Proceedings of the 5th North American Rock Mechanics Symposium and 17th Tunneling Association qf Canada Conference, University of Toronto, American Rock Mechanics Association, Alexandria, VA, pp, 207-271 [ Links ]
Hoek, E, and Franklin, JA, 1968, Simple triaxial cell for field or laboratory testing of rock, Transactions of the Institution of Mining andMetallurgy, vol, 77. pp. A22-A26. [ Links ]
Indraratna, B. 1990, Development and application of synthetic material to simulate soft sedimentary rocks, Geotechnique, vol. 40, no, 2. pp. 189-200. [ Links ]
Jiang, Y., Lib, B., and Tanabashia, Y, 2006, Estimating the relation between surface roughness and mechanical properties of rock joints, International Journal of Rock Mechanics & Mining Sciences, vol. 43. pp, 837-846. [ Links ]
Johnston, I.W. and Choi, S,K, 1986, A synthetic soft rock for laboratory model studies, Geotechnique, vol. 36, no. 2. pp. 251-263. [ Links ]
Moomivand, H, 1996, Some factors affecting the strength of rock under triaxial compressive stresses, PhD thesis, University of New South Wales, Australia. [ Links ]
Moomivand, H, 2014, Effects of orientation, frequency, and number of sets of discontinuities on rock strength under triaxial stresses, Arabian Journal of Geosciences, vol, 7. no, 12. pp. 5345-5352. [ Links ]
Patton, F.D. 1966, Multiple modes of shear failure in rock, Proceeding of the 1st Congress of the International Society of Rock Mechanics Lisbon, Portugal, ISRM, Lisbon. pp. 509-513. [ Links ]
Ramamurthy, T, 2001, Shear strength response of some geological materials in triaxial compression. International Journal of Rock Mechanics & Mining Sciences, vol, 38. pp. 683-697. [ Links ]
Ramamurthy, T, 2008, Joint factor concept in solving rock engineering problem. Proceedings of the 5th Asian Rock Mechanics Symposium, Tehran, 24-26 November. ISRM. Lisbon. pp. 147-148. [ Links ]
Ramamurthy, T, Rao, G,V,, and Rao, K,S, 1985, A strength criterion for rocks. Proceedings of the Indian Geotechnical Conference, vol, 1, Indian Geotechnical Society. pp. 59-64. [ Links ]
Ramamurthy, T, 1993, Strength and modulus responses of anisotropic rocks. Comprehensive Rock Engineering, vol. 1. Pergamon Press, UK. pp. 313-329. [ Links ]
Ramamurthy, T, and Arora, VK, 1994, Strength predictions for jointed rocks in confined and unconfined states. International Journal of Rock Mechanics & Mining Sciences, vol. 31, no. 1, pp. 9-22. [ Links ]
Rosenblad, J.L. 1968, Development of rock like material. Proceedings of the Tenth US Symposium on Rock Mechanics, American Rock Mechanics Association, Alexandria, VA. pp. 331-361. [ Links ]
Saneie, M., Rahmati, A., Dehghani, B., Faramarzi, L., and Bagherpour, R, 2013, Optimal selection criteria for estimate shear strength of roughened joint surfaces in hard rock andesite./oyma/ of Applied Geology, vol. 9, no. 2, pp. 111-121. [ Links ]
Saucier, K,L, 1967, Development of material for modelling rock. Miscellaneous Paper, no, 6-93, US Army Corps of Engineers Waterways Experiment Station, Vicksburg, MS, October. [ Links ]
Sinha, U,N, and Singh, B, 2000, Testing of rock joints filled with gouge using a triaxial apparatus. InternationalJournal of'Rock Mechanics and Mining Sciences, vol. 37. pp. 961-981. [ Links ]
Singh, M., Rao, K,S., and Ramamurthy, T. 2002. Strength and deformational behavior of a jointed rock mass. Rock Mechanics and Rock Engineering, vol. 35, no. 1. pp. 45-64. [ Links ]
Sivanathan Thirukumaran, S,, and Indraratn, B, 2016, A review of shear strength models for rock joints subjected to constant normal stiffness, Journal of Rock Mechanics and Geotechnical Engineering, vol. 8. pp. 405-414. [ Links ]
Stimpson, B, 1970, Modelling materials for engineering rock mechanics, International Journal of 'Rock Mechanics and Mining Sciences, vol. 7, pp. 71-121. [ Links ]
Tatone, B.S.A. 2014, Investigating the evolution of rock discontinuity asperity degradation and void space morphology under direct shear, PhD thesis, Graduate Department of Civil Engineering, University of Toronto. [ Links ]
Verma, A,K, and Singh, T.N. 2010, Modeling of a jointed rock mass under triaxial conditions, Arabian Journal ofGeoscience, vol. 3. pp, 91-103. [ Links ]
Vutukuri, V.S. and Moomivand, H, 1996, Development of a brittle rock-like material having different values of porosity, density and strength, EUROCK '96, Proceedings of the. ISRM International Symposium on Prediction and Performance in Rock Mechanics and Rock Engineering, Torino, Italy, 2-5 September, 1996, ISRM, Lisbon, pp, 213-220. [ Links ]
Wei, J., Men, Y, Sun, S., Le, H., and Zhu, F. 2018, Experimental study on 3D roughness and shear failure mechanism of rock mass discontinuity. Advances in Civil Engineering. Article ID 7358205, https://doi,org/10,1155/2018/7358205 [ Links ]
Wua, Q, Xub, Y. Tanga, H., Fangc, K., Jianga, Y, Liua, C., Wanga, L., Wanga, X., and, Kanga, J. 2018, Investigation on the shear properties of discontinuities at the interface between different rock types in the Badong formation, China, Engineering Geology,, vol. 245, 1 November 2018. pp. 280-291. [ Links ]
Zhang, G. Karakus, M., Tang, H., Ge, Y., and Zhang, L. 2014, A new method estimating the 2D joint roughness coefficient for discontinuity surfaces in rock masses, International Journal Qf Rock Mechanics and Mining Sciences, vol. 72. pp. 191-198. [ Links ]
 Correspondence:
H. Moomivand
Email: h.moomivand@urmia.ac.ir
Received: 4 May 2018
Revised: 25 Jun. 2019
Accepted: 10 Oct. 2019
Published: December 2019

