


Services on Demand
Article
 English (pdf)
 Article in xml format
 Article references
Indicators

Related links
-
 Cited by Google
 -
 Similars in Google
Share

 Permalink
Journal of the Southern African Institute of Mining and Metallurgy
On-line version ISSN 2411-9717
Print version ISSN 2225-6253
J. S. Afr. Inst. Min. Metall. vol.119 n.12 Johannesburg Dec. 2019
http://dx.doi.org/10.17159/2411-9717/685/2019
GENERAL PAPERS
A risk-based methodology to improve the definition of geotechnical sectors in slope design
M. BesterI, II; T.R. StaceyI; I. BassonIII; C. KoegelenbergIII; P. CreusIII; L. LorigIV; A. CabreraIV
IUniversity of the Witwatersrand, Johannesburg, South Africa
IIKumba Iron Ore, a division of Anglo American, Centurion, South Africa
IIITect Geological Consulting, Cape Town, South Africa
IVItasca Consulting Group, Minneapolis, United States
SYNOPSIS
In the planning of open pit mines, it is often difficult to determine the shapes and sizes of slope design sectors prior to their analysis, particularly in structurally complex geological environments. This problem is exacerbated in sectors encompassing significant strike changes of lithological units or contacts. This variability in strike is often poorly addressed/represented by applying median values or averages for key parameters, thereby increasing uncertainty and risk. The design process may be improved by the early identification of specific lithological units - of any shape or size - that show unfavourable interaction of geological features with slope geometries on future pushbacks or on final designs, utilizing inputs from apparent dip analysis and synthetic rock mass modelling. Focused data acquisition and more rigorous stability analysis in areas of concern will result in more robust and practical sector-specific design parameters, typically applied in block model format as inputs for mine design. A case study at Sishen mine, in the Northern Cape Province of South Africa, demonstrates that an ongoing, risk-based approach leads to a higher-confidence dynamic geotechnical model, thereby allowing for an integrated mine design process with the ultimate goal of achieving early risk mitigation and delivering optimized designs that unlock significant value without compromising the geotechnical risk profile of the mine.
Keywords: slope design, anisotropy, optimization, synthetic rock mass model.
Introduction
In the planning of open pit mines, it is often difficult to determine the shapes and sizes of slope design sectors prior to their analysis, in structurally complex volumes. This problem is particularly acute where the strike of lithologies, within a standard or typical wedge-shaped defined sector, shows a dramatic change in orientation. These sectors are poorly addressed by reverting to median values or averages for key parameters. This results in greater uncertainty and risk as it may obscure step path failure mechanisms through weaker materials.
Routinely applied geotechnical data in mined areas is typically sparse or focused only on a narrow volume around vertical, 2D design cross-sections, which are orientated perpendicular to slope strike. Moreover, at Sishen mine it is difficult to simulate the effects of anisotropic rock mass strength, scale effects, and deformation behaviour of banded iron formation (BIF) and Gamagara Shale on pit slope stability.
This study suggests a means of improving the mine design process by early identification of volumes - of any shape or size - that show unfavourable interactions between geological features and slope geometries, either on future pushbacks or on final designs, by utilizing inputs from apparent dip analysis and synthetic rock mass modelling. Focused data acquisition and more rigorous stability analysis in areas of concern result in robust and practical suites of sector-specific design parameters as inputs for mine design.
The application of this process to Sishen mine, in South Africa's Northern Cape Province, demonstrates that an ongoing risk-based approach produces a dynamic geotechnical model that allows for an integrated mine design process that delivers optimized designs and early risk mitigation.
Synthetic rock mass modelling
A straightforward, rigorous, and generally applicable approach is to apply a synthetic rock mass (SRM) methodology to characterize rock mass anisotropy (Mas Ivars et al., 2007). This approach was pioneered by Itasca and has been widely reported in the literature.
Banded iron formation (BIF), shale (SH), and tectonic shale (SHT) at Sishen mine exhibit anisotropic behaviour on a rock mass scale (Mas Ivars et al., 2008). It is not practical to simulate explicit bedding within a large-scale numerical pit model, due to incomplete structural geological knowledge and excessive computational requirements. Consequently, equivalent continuum representation is required to ensure reasonable computation times for the realistic simulation of the effects of anisotropic rock mass strength and deformation behaviour on pit slope stability. The ubiquitous joint rock mass (UJRM) modelling technique in 3DEC (Itasca Consulting Group, 2016) was developed by Itasca to account for rock mass anisotropy and scale effects. This simulates well-defined strength anisotropy due to embedded planes of weakness within a Mohr-Coulomb material. When used to simulate rock mass strength and deformation behaviour under unconfined compression, the UJRM model (Sainsbury, Pierce, and Mas Ivars, 2008a, 2008b) characterizes the progressive degradation of matrix cohesion and ubiquitous joint failure at various stages of loading.
Methodology
As a starting point in determining appropriate rock mass properties, a series of large-scale, simulated triaxial compression tests was conducted in 3DEC, using geometries that include an explicit representation of (1) bedding planes and (2) orthogonal jointing at realistic spacings.
The discrete fracture network (DFN) approach is a way of realistically representing the rock mass fabric by stochastically generating fractures in a 3D volume. This technique accounts for the spatial variability of various parameters such as orientation, persistence, and termination, each of which is assigned a statistical distribution in a series of model realizations.
The distribution of discontinuities within the specimen is based on a DFN realization. A series of UCS and triaxial tests was performed in 3DEC with varying bedding plane dip angles (ß angles) from 0° to 90° with respect to axial compression loading. The behaviour indicated by 3DEC simulated laboratory tests is ideally reflected in the rock mass response, which is obtained by calibrating UJRM continuum model behaviour to that of 3DEC models. The UJRM modelling approach provides a close match to the anisotropic curve derived from explicit DFN simulation of the joint fabric with 3DEC. Finally, these calibrated UJRM properties are utilized to spatially analyse the interaction of anisotropic units with other geological features and pit geometry.
Banded iron formation (BIF)
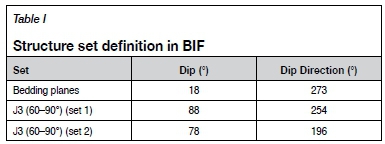
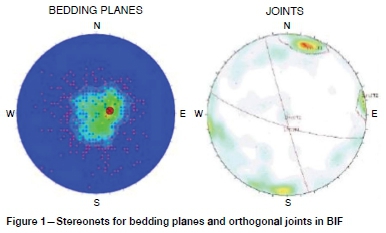
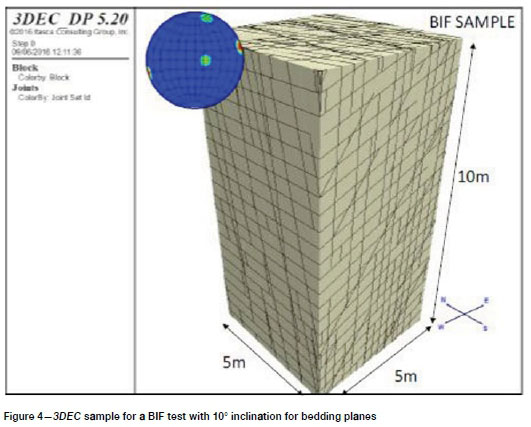
In order to investigate the anisotropic strength of BIF, a synthetic rock mass sample of size 5 m x 5 m x 10 m was tested in 3DEC under confined compression (triaxial test). Both bedding planes and orthogonal joint sets, with their actual spacings, were explicitly represented in the volume using DFN logic, while intact rock properties were applied for intervening volumes. The represented structure sets (bedding planes and joints) were selected from mapping data in the Sishen acQuire geotechnical database. Table I illustrates orientations used for BIF while Figure 1 shows stereonets generated from the mapping data. Due to the highly jointed nature of the BIF, joint sets are grouped into bedding planes: J1 (0-30°), J2 (3060°), and J3 (60-90°).
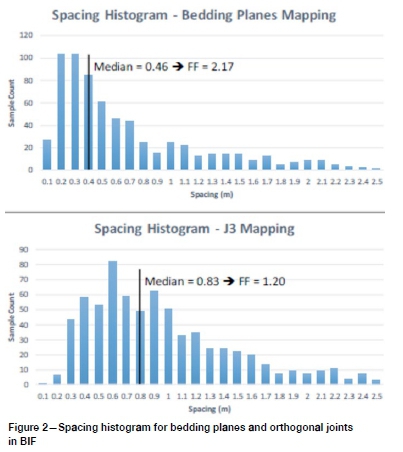
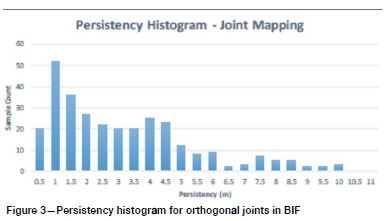
Geometrical considerations for every set (bedding planes and joints) were also derived from mapping data in the Sishen acQuire geotechnical database. Figure 2 shows a spacing histogram and the median value for every set, while Figure 3 shows a persistency histogram for joints. Bedding planes are assumed to be fully persistent in all 3DEC samples.
Since joints in the sample are defined by DFN logic and every sample shows a unique joint distribution, three different samples were tested for every bedding plane inclination, ranging from 0° to 90°. These three unique sample conditions satisfy the various structure geometrical assumptions. Figure 4 shows one of these samples, which exhibits a 10° inclination for bedding planes.
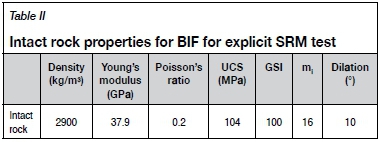
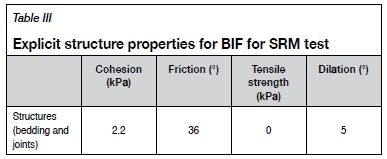
Intact rock material properties assigned to the anisotropic rock mass in 3DEC models, as well as the Mohr-Coulomb properties for structures, were obtained from the Sishen acQuire geotechnical database (refer to Tables II and III).
Explicit joint results
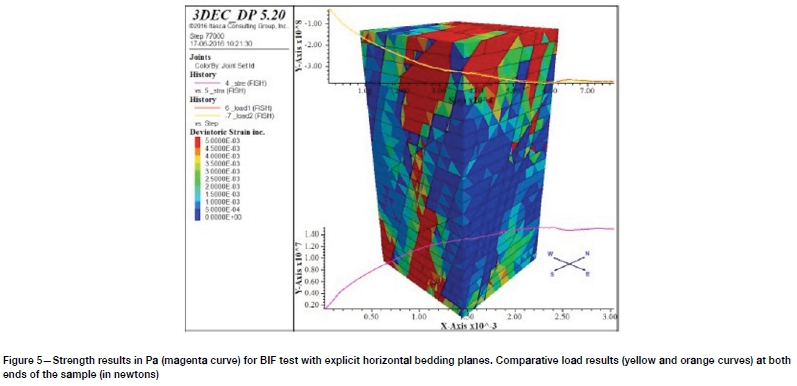
Numerical tests for confined compression were conducted by applying boundary conditions. Both the top and bottom of the model move with constant velocity in the z-direction (vertical), simulating model loading. The loading stress was estimated using a FISH function, by dividing the reaction forces on sample ends by the cross-sectional area of the model. The mean values of the maximum principal stresses were monitored throughout the simulation. As an example, Figure 5 shows the strength results for a BIF sample with horizontal bedding planes. There are two graphs that show the correct behaviour. The top one shows the force (in N) applied at the top and bottom areas (yellow and orange curves) of the sample per step. They are overlaid, which indicates a test with equal top and bottom forces applied (max. load approx. 340 MN). The bottom graph is the strength result with stress on the x-axis and strain on the y-axis.
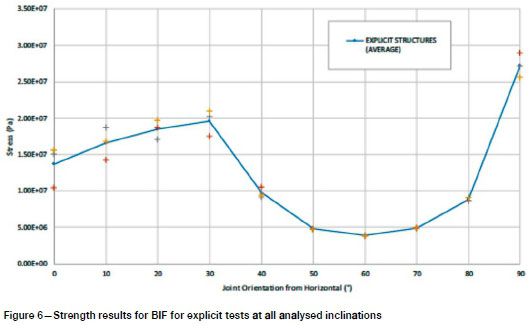
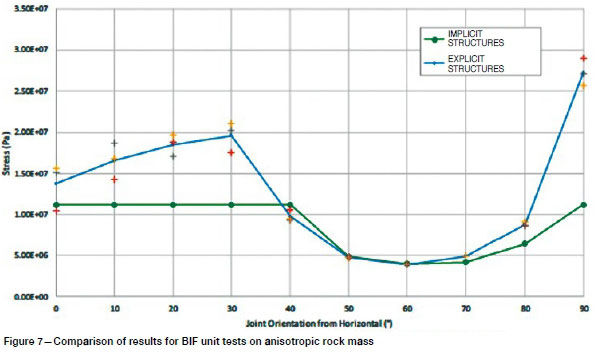
Figure 6 presents the results of the numerical models for confined compressive tests on an anisotropic rock mass (1 MPa confinement). The value of the maximum principal stress varies from approximately 5 MPa to 30 MPa, depending on the orientation of the structure sets with respect to the vertical loading orientation. The blue line represents the average value for every inclination, while coloured crosses are values for each test.
Implicit joint results - calibration of anisotropic strength
In order to represent the anisotropic rock mass in a continuous model or to perform spatial analysis, all zones are assigned a ubiquitous joint model in the direction of bedding. The zone sizes in these samples are comparable to the smallest zones within the mine-scale numerical model.
Table IV presents calibrated properties for the specimen rock mass. Ubiquitous joint properties are the same as in the explicit test. Calibrated properties were obtained by adjusting implicit results to the explicit average strength curve presented in Figure 6.
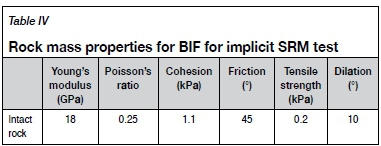
Figure 7 illustrates the anisotropic strength response of the calibrated ubiquitous model in comparison with explicit model results. The implicit result is somewhat conservative, except in the critical area of low strength, where a good correlation is evident.
Shale (SH)
Following the same approach, 3DEC was used to create a synthetic rock mass sample of size 5 m x 5 m x 10 m to be tested under confined compression (triaxial test). Both bedding planes and orthogonal joint sets with actual spacings were explicitly represented in the volume using DFN logic and intact rock properties for intervening volumes. Represented structure sets (bedding planes and joints) used for this model were the same as used for BIF, i.e. based on the structural geological understanding at Sishen mine. However, geometrical considerations for every set (bedding planes and joints) in the shale (SH) unit were derived from mapping data obtained from the Sishen acQuire geotechnical database.
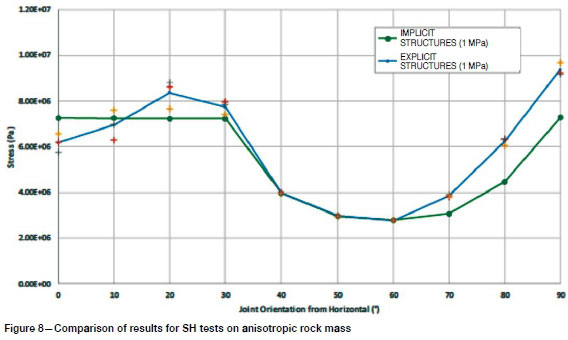
Figure 8 illustrates the anisotropic strength response of the calibrated ubiquitous model in comparison with explicit model results. The match is somewhat conservative except at 0° inclination. In the critical area of low strength, however, there is good correlation between the explicit and implicit models.
3D geometrical analysis methodology
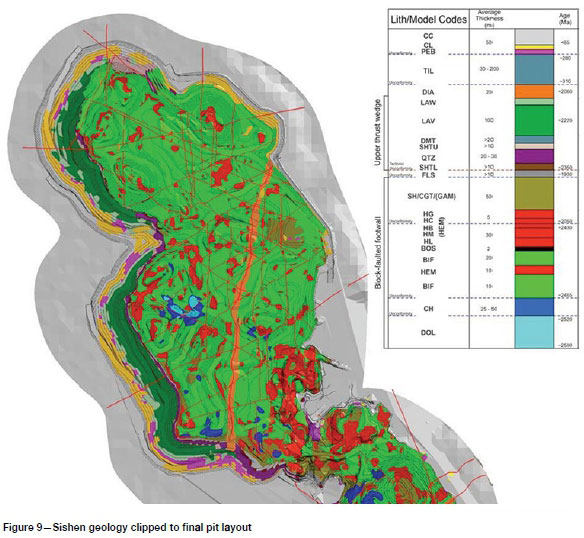
Following synthetic rock mass analysis (SRMA), a methodology was developed to augment the use of vertical 2D design sections by applying and analysing SRMA results in 3D, without sectional constraints. This seeks to develop a more accurate methodology for the extraction of spatial variation in parameters while at the same time obviating several limitations of preordained, typically wedge-shaped design sectors and their central, vertical sections. Improved design sector classification highlights possible areas -of any size or shape - that show unfavourable interaction with slope geometries in future pushbacks or on final faces, thereby resulting in a more robust and practical suite of sector-specific design parameters as inputs for mine design. The geometry around instability events may also be utilized to investigate other volumes with comparable structural and bedding interactions with slope geometry. This allows for focused data acquisition, such as mapping, dedicated geotechnical drilling with downhole optical/acoustic televiewers, and more rigorous stability analysis, in order to further improve the geotechnical model. Any plane of anisotropy is amenable to this analysis (viz. bedding, foliation, faults). The majority of Sishen mine's final pit slopes will comprise BIF, ore, basaltic andesite, clay, and calcrete, as illustrated in Figure 9 and described by Anthonissen et al., 2016.
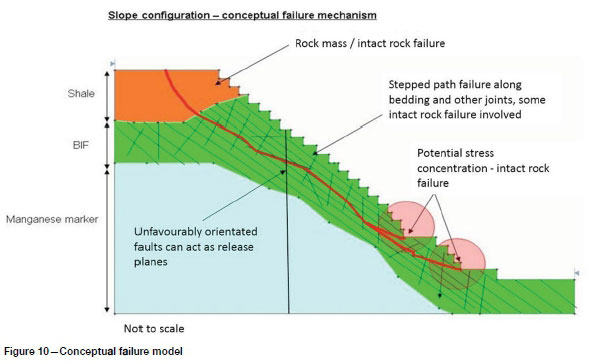
In order to perform stability analyses, a conceptual failure mechanism was derived. Rock mass failure could occur only in the softer rock masses at Sishen, for example Kalahari Formation clay and calcrete, whereas it is unlikely within BIF and related anisotropic units. A structurally-controlled, stepped path failure mechanism (interaction between faults, bedding, joints, and rock bridges) is anticipated for BIF (Figure 10).
Due to the nature of the orebody, pit geometries are complex with a number of sub-pits within the final pit footprint and mining progressing in several phases or pushbacks, each with its own unique geometry. This leads to multiple permutations of pit geometries interacting with the main plane of anisotropy in each geotechnical domain. Where unfavourable, these interactions are ultimate drivers of stability or instability according to the conceptual BIF failure model.
Calculating apparent dips
In geological modelling, the orebody and associated lithologies are represented by triangles that are connected together to form a surface (wireframe). Each triangle is defined by three vertices that form a plane containing these vertices. Triangles are therefore used as a planar approximation of a smooth surface, due to the fact that graphics software packages and hardware devices operate more efficiently utilizing triangles.
Analysed anisotropic units (BIF and SH) occur within a block-faulted footwall. Utilizing Micromine, triangle orientations were extracted from wireframes representing lithological contacts, essentially the uppermost limits of 3D volumes or closed wireframes, in order to quantify and qualify the geometry (dip and dip direction) of lithological contacts in 3D space. Areas or volumes where these were in direct contact with erosional or tectonic unconformities were excluded, as this violates one of the basic assumptions of the analysis. Otherwise, triangle orientations were reasonably assumed to be parallel or sub-parallel to bedding within their respective volumes and structural domains. This can be tested by comparing recorded bedding readings, from in-pit mapping, with surface-extracted triangle orientations in the same area. Each subset of triangle orientations, in the form of dip direction and dip, was assigned to a separate structural domain (viz. fault-bounded blocks). Triangles on the sides of these blocks, which would indicate anomalously steep dips where they run up against steep or vertical bounding faults, were omitted from the analysis.
Gridding and contouring of this data shows the spatial variation in the true dip of lithological contacts. It is also advisable to integrate mapping data or actual dip and dip direction data obtained from oriented drill-holes into triangle orientation files prior to gridding and contouring. In order to fully undertake the analysis and to account for changes in orientations of actual mining surfaces or a design layout relative to bedding in any given area, it is necessary to calculate the apparent dip of bedding.
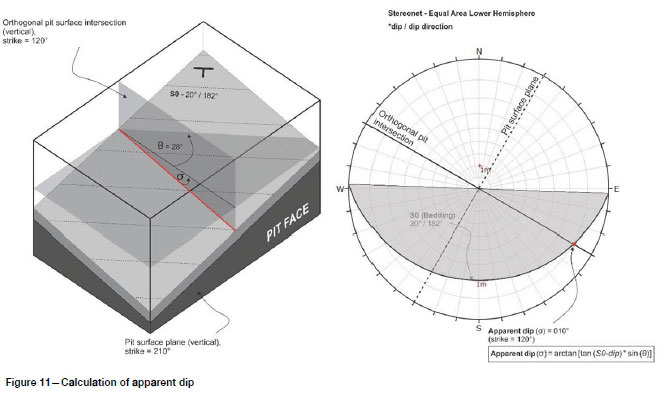
Gridded triangle orientations, i.e. true lithological dips, were assigned to these pit surfaces using a nearest-neighbour algorithm. The proximity over which this projection is done from off- (pit)-surface varies, but it is advisable to refer to the thickness, lateral extent, and internal coherence of the unit from which data is taken and, by default, through which data will be extrapolated. It was found that using true dip data within 20-50 m of the pit surface was acceptable for Sishen mine geology. The methodology or theory applied for apparent dip calculation with regard to mining surfaces (or future design layouts) is shown in Figure 11.
Apparent dips were then re-gridded using an inverse distance interpolator so as to give an accurate representation of apparent dips for each anisotropic lithological unit within each fault-bounded block.
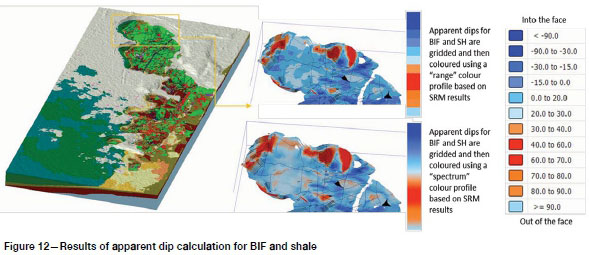
Figure 12 is an example of gridded and colour-coded BIF and SH apparent dips, within 12 dip angle bins, between -90° and +90°. These bins show apparent dips into the face (0° to -90°) and out of the face (0° to 90°). These ranges are based on results obtained from the curve of the anisotropic strength response of the calibrated ubiquitous model described in the previous section. Apparent dips are displayed only where units intersect the design pit. This was achieved by clipping modelled lithological volumes of BIF/SH against the design pit so as to show where BIF/SH daylights on the design pit surface. Areas coloured orange and red are of particular concern due to the unfavourable interaction of anisotropic materials and the planned pit geometry.
Definition of geotechnical design sectors
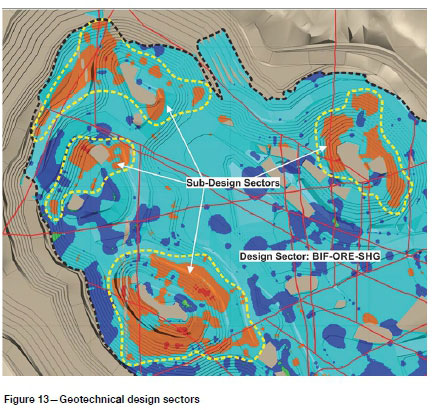
By incorporating data obtained from apparent dip maps and utilizing various strength models according to the conceptual failure models (with regard to lithological layers), unique geotechnical design sectors can be defined. Design sectors are first identified and grouped according to one or more lithologies with similar strength properties. If required (i.e. for anisotropic layers), these sectors are gridded with calculated apparent dips on the design pit surface (Figure 12) to constrain further possible design 'subsectors'. To illustrate this principle, a design sector was created for grouped BIF and SH, and populated with apparent dips (refer to Figure 13). Importantly, apparent dip orientations that denote a low-strength area are considered as separate design 'sub-sectors' (Figure 13). Interaction with faults and weak contacts according to the conceptual failure model is also considered during this process.
Once completed, the geotechnical block model may be constrained with these individual design sector solids and populated with sector-specific geotechnical design parameters, including berm width and slope angle, for use in mine design optimization, scenario analysis, and practical pit layout construction.
The slope design process following an iterative, risk-based approach
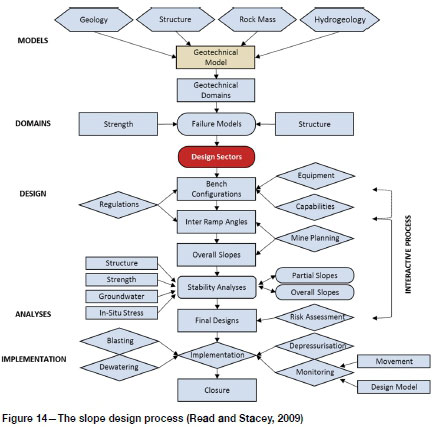
The slope design process, developed over the past 25 years, is widely utilized in a relatively standard format (Figure 14) (Read and Stacey, 2009). Data from geological, structural, rock mass, and hydrogeological models is used to formulate and populate geotechnical models. Based on these parameters, the volume of interest is divided into geotechnical domains. Structural and rock strength information are key inputs to defining the conceptual failure model(s) within these geotechnical domains. Subdivision of domains into design sectors should typically result in practical slope designs for volumes that contain structurally-controlled and/or anisotropic materials.
According to Read and Stacey (2009), certain degrees of safety, economic, and financial risk have always been implicit in mining operations. In open pit mines, slope instability is one of the major sources of risk, largely due to data uncertainty as well as the generally modest levels of stability accepted for designs. With the increasing requirements for management to be involved in the decision-making process for slope design, risk quantification is necessary. The objective of risk-based design is to provide management with quantitative information for:
> Defining acceptable risk in terms of safety and economics
> Assessing relative risk levels for different slope configurations
> Benchmarking risks against industry norms and the corporate mission statement.
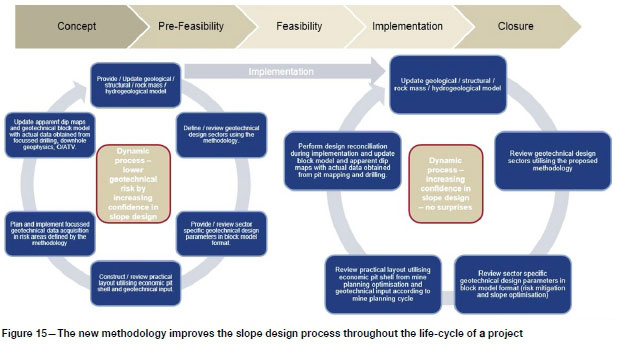
Steffen (1997) addresses the methodology of introducing risk into open pit mine planning. Recommendations are put forward for achieving a risk balance between the mineral resource estimate and slope design. Subsequently, Steffen (2007) stated that mine planning is a typical engineering design function that integrates the disciplines of geology, metallurgy, geotechnics, mining, and economics. Slope angles are a key economic and risk parameter in open pits. Since the objective of mining is to maximize the value, steepening slope angles to their safe limits is always a priority. This is a clear case of evaluating risk against reward, where the risk is not the failure of the slope, but the consequences of failure. In order to reach this goal of optimal and safe extraction of the mineral reserve, mining needs to be progressively more predictable (Vorster, 2001). This improves the slope design and risk assessment process in open pit mining, leading to optimized slope designs and early risk mitigation, which will consequently improve the understanding of mine plans and their associated implementation risks, ultimately leading to increased investor confidence. The methodology can be incorporated in the slope design process from early-stage projects through to operational mines' planning cycles, as illustrated in Figure 15.
The methodology follows a risk-based approach as the resulting focused data acquisition, rigorous stability analysis, and risk assessment in areas of concern mitigates risk from early project stages (Stacey, 2009) to operational mines (future pushbacks). It therefore addresses the fact that slope instability is one of the major sources of risk in open pit mining, largely due to data uncertainties.
Sishen mine GR 8O Area case study
Sishen mine is developed in a series of pushbacks or phases towards the final pit boundary. Subsequent to performing spatial analysis using the methodology described in the previous section, an area of concern was highlighted in a future pushback, as shown in Figure 16.
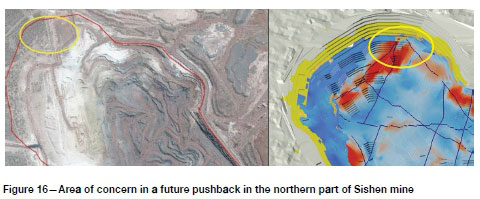
Based on the 3D geometrical analysis utilizing SRM results, the area shows unfavourably-orientated BIF and shale dipping into the pit, as well as faults that could act as release planes according to the conceptual failure model. Furthermore, the shale is underlain by a tectonic unconformity. Following the methodology illustrated in Figure 15, more rigorous analysis and focused data acquisition were deemed necessary in this area to achieve value protection through early risk mitigation.
Focused data acquisition and 3DEC analysis
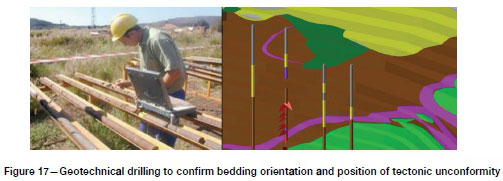
TWo dedicated geotechnical core drill-holes were planned and drilled in the area of concern. A downhole survey was also performed, resulting in the confirmation of both an unfavourably-orientated geology and the position of the tectonic unconformity. The red arrows in Figure 17 indicate shale dipping into the pit.
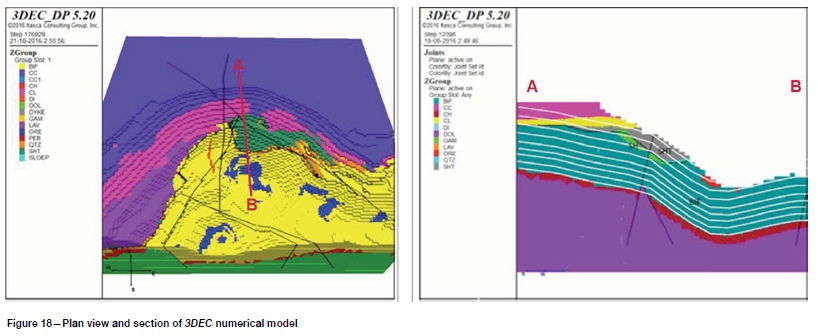
Geotechnical logging of drill-holes furthermore indicated localized ferruginization of shales, which needs to be accounted for in the stability analysis of this area. A model of the area (as shown in Figure 18) was constructed in 3DEC for stability analysis, with strength properties obtained from the Sishen acQquire geotechnical database as well as the SRM analysis described previously.
Analyses of various scenarios were completed with varying strength properties of large-scale faults, the tectonic unconformity phreatic levels, and pore pressures. For the area under investigation (factor of safety of 1.3-1.4) the stability is influenced by the location and orientation of the tectonic unconformity, as well as the anisotropy orientation of BIF and shale. To improve understanding of the potential complex interaction of several aspects influencing stability, various sensitivity analyses were conducted.
The first analysis was done by adjusting the friction angle of the tectonic unconformity. This parameter was increased from ф = 17° to <p = 33°. The second analysis was done by adjusting the residual cohesion of the tectonic unconformity by increasing cres = cpeakfrom zero to 95 kPa. In both cases, the factor of safety in all areas increased significantly, i.e. equal to or greater than 1.4 and equal to or greater than 1.5.
For the third sensitivity analysis, the cohesion on all faults was reduced from c = 10 kPa to zero. The factor of safety results obtained are similar to the original results, indicating that slope stability is more sensitive to the strength of the tectonic unconformity than that of the faults.
It should be noted at this stage that all previous analyses were performed with no pore pressure in any of the zones. Therefore, for the third and fourth sensitivity analyses, two hydrogeological conditions were analysed.
For the third analysis, a near-surface aquifer in calcrete (CC) and clay (CL) materials was considered in which pore pressures were applied only in the zones and structures within these lithologies. The rationale behind this is that Sishen mine has an extensive dewatering programme, with current water levels already drawn down in excess of 100 m below the current pit floor, and that only the surface aquifer in the Kalahari Formation (calcrete and clay) needs to be considered. The pore pressures were allowed to develop in the 3DEC model as a product of the depth, water density, and gravitational acceleration. Results indicate that the factor of safety decreases significantly in the areas with pore pressure, ranging from FS = 1.1-1.2 to FS < 1.0.
The fourth sensitivity analysis was performed considering the near-surface aquifer with pore pressures applied in all structures (including faults and the tectonic unconformity). This scenario considers a hydrogeological connection through structures where surface water infiltrates along these structures. This is justified by the Sishen groundwater numerical model and practical experience, indicating that Sishen is essentially a fractured aquifer where dewatering infrastructure targets waterbearing structures. Results are similar to those from the previous analysis, but lower areas also showed a significant reduction in the factor of safety. This is attributed to a decrease in strength of the tectonic unconformity due to pore pressure.
To summarize, by varying the strength properties of large-scale faults, the tectonic unconformity, phreatic levels, and pore pressures, it was shown that stability will be most sensitive to the strength and orientation of the tectonic unconformity, as well as increased pore pressures in the rock mass and structures.
Risk mitigation
The geotechnical risk management process at Sishen mine employs controls at all levels, from slope design to implementation. The slope in question does not carry critical infrastructure, therefore to adhere to corporate and industry-accepted criteria, based on the new information obtained, stability assessment, and the subsequent risk assessment, the following mitigation actions were implemented
Extension of the depressurization project
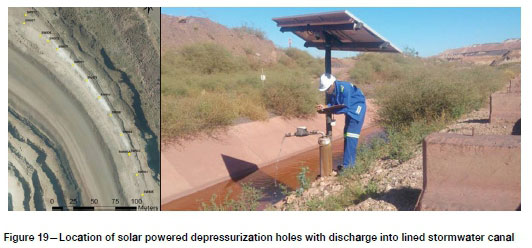
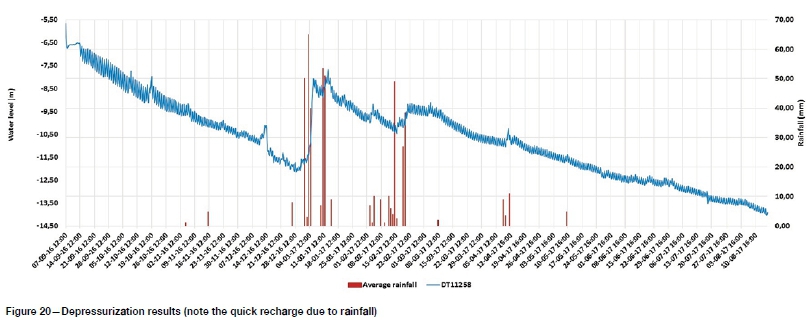
Sishen mine's dewatering strategy was until recently focused on dewatering the deep, fractured aquifer in the BIF and the chert breccia overlying the dolomite. The shallow Kalahari Formation aquifer became a focus area for depressurization, due to the increased rate of mining and instability in an area south of the study area. Piezometer-monitoring holes were drilled, and a series of shallow drill-holes established and equipped with solar-powered pumps to depressurize the Kalahari aquifer (Figure 19).
Based on the successful drawdown achieved (Figure 20) and the sensitivity to pore pressures in the rock mass and structures highlighted by 3DEC analysis, the network is being expanded to cover the future pushback area as well as the western pit slope.
Economic risk mitigation
Based on the mine planning schedule, further mitigation actions are planned for the period in which mining will take place in the area in question, ensuring adequate stockpile levels and access to alternative exposed ore should instability occur.
Slope stability monitoring
Sishen mine utilizes best-practice slope monitoring technologies in order to manage slope instability, and will therefore employ strategic and critical/tactical monitoring in the area in question.
Pit wall control and mine to design reconciliation
Limit blasting techniques (pre-split and trims) will be employed in the area in question with a robust process in place to reconcile actual performance against the slope design (geometry and face conditions).
Operational controls
All operational controls to be in place, including continuous risk assessments, hazard maps and trigger action response plans, safe declaration procedures, and stand-off/exclusion zone procedures.
Value created by following the methodology described
Following the methodology described led not only to more effective risk mitigation at Sishen mine, but also to the launch of a slope optimization initiative to unlock value. This is based on the principle that following the methodology as part of an iterative process continuously increases confidence in the slope design by addressing geological uncertainty in potential risk areas.
Optimization initiatives focused on design sectors with favourable interaction of slope geometry with geology, lithologies with favourable strength characteristics where stability analysis indicated optimization potential, as well as layout optimization aspects (geotechnical berms and ramps). Options were evaluated that determine cost saving by decreasing waste stripping for the same amount of ore as well as accessing additional deeper ore at equivalent strip ratios.
Phase 1 of the slope optimization project was included in the Sishen 2018 life of mine (LOM) plan. This work unlocked significant value for Kumba Iron Ore and was the major contributor to an increase in NPV from 2017 to 2018 of approximately R10 billion (an additional 50 Mt of ore) (Anglo American, 2019).
Conclusion
In order to reach the goal of optimal and safe extraction of the mineral reserve, mining needs to proceed in a progressively more predictable manner. The work flow described in this contribution improves the slope design process, by improving the definition of design sectors and by following a risk-based approach, thereby leading to optimized slope designs and early risk mitigation. This should begin at an early stage and continue throughout the life-cycle of a project (from concept phase to operations).
The Sishen mine case study illustrates that adhering to the methodology described will improve the understanding of the way mine plans interact with the underlying geology and their associated implementation risks through a dynamic geotechnical model. Ultimately it leads to increased investor confidence by unlocking maximum value without compromising the geotechnical risk profile of the mine.
Acknowledgements
The contribution of the following colleagues towards this work is acknowledged:
The Sishen Mine Geotechnical Engineering / Hydrogeology and Mine Planning teams, specifically Richard Carey, Tim Russell, Travis White ,and Derek Esterhuysen.
Our thanks also to Kumba Iron Ore, a division of Anglo American, for the opportunity to publish this paper.
ORCiD ID:
M. Bester: https://orcid.org/0000-0001-7278-3639
References
Anglo American. 2019. Anglo American Kumba Iron Ore Investors. https://www.angloamericankumba.com/investors/annual-reporting.aspx [ Links ]
Anthonissen, C.J., stoch, B., McCall, M., and Basson, I.J. 2016. Sishen Mine: Structural re-interpretation and baseline 3D modelling in Leapfrog Geo: For ore resource estimation and geotechnical design. Report no. TECT007/2016R for Kumba Iron Ore. 104 pp. [ Links ]
Itasca Consulting Group. 2016. 2-Dimensional Distinct Element Code (3DEC), Version 5.2. Minneapolis, MN. [ Links ]
Mas Ivars, D., Deisman, N., Pierce, M., and Fairhurst, C. 2007. The synthetic rock mass approach - A step forward in the characterization of jointed rock masses. The Second Half Century of Rock Mechanics, Proceedings of the 11th Congress of the International Society for Rock Mechanics, Lisbon, July 2007. Vol. 1. Ribeiro e Sousa, L., Olalla, C., and Grossmann, N. (eds). Taylor & Francis, London. pp. 485-490. [ Links ]
Mas Ivars, D., Pierce, M., DeGagné, D., and Darcel, C. 2008. Anisotropy and scale dependency in jointed rock-mass strength - A synthetic rock mass study. Continuum and Distinct Element Numerical Modeling in Geo-Engineering. Proceedings of the 1st International. FLAC/DEM Symposium,, Minneapolis, MN, 25-27 August 2008. Hart, R., Detournay, C., and Cundall, P. (eds), Paper no. 06-01. Itasca Consulting Group, Minneapolis, MN. [ Links ]
Read, J. and Stacey, P. 2009. Guidelines for Open Pit Slope Design. CSIRO, Australia. [ Links ]
Sainsbury, B., Pierce, M., and Mas Ivars, D. .2008a. Simulation of rock mass strength anisotropy and scale effects using a Ubiquitous Joint Rock Mass (UJRM) model. Continuum and Distinct Element Numerical Modeling in Geo-Engineering. Proceedings of the 1st International. FLAC/DEM Symposium,, Minneapolis, MN, 25-27 August 2008. Hart, R., Detournay, C., and Cundall, P. (eds). Paper. no. 06-02. Itasca Consulting Group, Minneapolis, MN. [ Links ]
Sainsbury, B., Pierce, M.E., and Mas Ivars, D. 2008b. Analysis of caving behaviour using a synthetic rock mass - Ubiquitous joint rock mass modelling technique. SHIRMS2008. Proceedings of the First Southern Hemisphere International Rock Mechanics Symposium. Potvin, Y., Carter, J., Dyskin, A., and Jeffrey, R. (eds). Australian Centre for Geomechanics, Perth. pp. 243-253. [ Links ]
Stacey, T.R. 2009. Design-a strategic issue. Journal of the Southern African Institute of Mining and Metallurgy, vol. 109, no. 3. pp. 157-162. [ Links ]
Steffen, O.K.H. 1997. Planning of open pit mines on risk basis. Journal of the South African Institute of Mining and Metallurgy, vol. 97, no. 2. pp. 47-56. [ Links ]
Steffen, O.K.H. 2007. Mine planning: its relationship to risk management. Proceedings of the 2007 International Symposium on Rock Slope Stability in Open PitMining and Civil Engineering. Potvin, Y. (ed.). Australian Centre for Geomechanics, Perth. https://www.semanticscholar.org/paper/Mine-Planning-%E2%80%93-Its-relationship-to-Risk-Management-Steffen/ba0d74eba4d414b588841fa8f86a3ee7e90e3000 [ Links ]
Vorster, A. 2001. Planning for value in the mining value chain. Journal of the South African Institutefor Mining and Metallurgy, March/April 2001. pp. 61-65. https://www.saimm.co.za/Journal/v101n02p061.pdf [ Links ]
 Correspondence:
M. Bester
Email: marnus.bester@angloamerican.com
Received: 25 Mar. 2019
Revised: 10 Oct. 2019
Accepted: 7 Nov. 2019
Published: December 2019

