


Servicios Personalizados
Articulo
 Inglés (pdf)
 Articulo en XML
 Referencias del artículo
Indicadores

Links relacionados
-
 Citado por Google
 -
 Similares en Google
Compartir

 Permalink
Journal of the Southern African Institute of Mining and Metallurgy
versión On-line ISSN 2411-9717
versión impresa ISSN 2225-6253
J. S. Afr. Inst. Min. Metall. vol.119 no.11 Johannesburg nov. 2019
http://dx.doi.org/10.17159/2411-9717/603/2019
GENERAL PAPERS
The use of 3D ground penetrating radar to mitigate the risk associated with falls of ground in Bushveld Complex platinum mines
T. Kgarume; M. van Schoor; Z. Nontso
CSIR, South Africa
SYNOPSIS
Some of the recent advances in ground penetrating radar (GPR) technology are discussed in this paper; in particular the move to, and potential value addition offered by, the 3D approach to surveying over the more conventional 2D approach. Case studies at two platinum mines in the Bushveld Complex are used to stress the fact that the niche role for GPR is that of immediate hangingwall assessment, aimed at identifying geological features that could potentially result in falls of ground (FOGs). The paper also highlights the obstacles that still need to be overcome to enable GPR to become a routine tool in local mining operations, and recommendations are offered on how to address these obstacles through ongoing research efforts.
Keywords: remote sensing, ground penetrating radar. GPR, mine safety, fall of ground.
Introduction
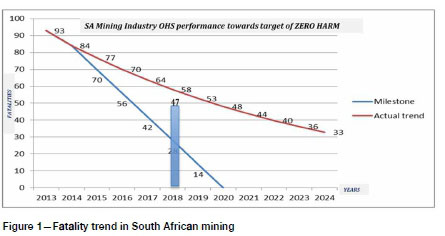
The South African mining industry has always been plagued by incidents that result in injuries and fatalities. A greater awareness of, and commitment to, addressing this problem has led to a significant decrease in fatality rates over the last 20 years; however, the trend has recently plateaued (Figure 1), suggesting that the industry still has much work to do towards achieving the zero harm objective. To this end, the Minerals Council South Africa (MCSA) has called on all the stakeholders to reaffirm their commitment and to remain focused on achieving zero harm.
A closer analysis of the modality statistics relating to mining fatalities indicates that falls of ground (FOGs) has consistently been, and remain, the single biggest contributor to injuries and fatalities (Vorster and Franklin, 2008; Department of Mineral Resources, 2017). FOGs may occur as soon as the face has advanced after blasting or machine cutting, and can also occur after support has been installed. There are many factors that contribute to the occurrence of FOGs; for example, insufficient support, excessive bolt spacing, weathering, horizontal stress/weak roof rock, suboptimum mining practices, and anomalous geological structure. Vorster and Franklin (2008) stated that the effects of FOGs can be mitigated by careful adherence to appropriate parameters (excavation width, timing of support installation, and characteristics of the support system).
In 2015, the consolidated South African Mining Extraction Research, Development & Innovation (SAMERDI) strategy was accepted as a direct result of the government-driven Mining Phakisa (Creamer, 2018). The main objectives of SAMERDI are to achieve zero harm, increase efficiency, and reduce costs. One of the key focus areas identified in SAMERDI is that of Advanced Orebody Knowledge (AOK), which is based on the core discipline of inmine geophysics. The AOK programme supports the SAMERDI zero harm objective by researching technologies that can delineate the orebody and associated geological disturbances to allow for better understanding of the rock mass and to aid in mine planning and rock engineering design. The proposed technology solutions include the routine application of 3D ground penetrating radar (GPR) to assess the integrity of the hangingwall in unsupported or partially supported workplaces. GPR technology can also inform the selection of appropriate and adequate support.
The potential role of GPR as a risk assessment tool has previously been demonstrated and documented (van Schoor, du Pisani, and Vogt, 2006; Vogt, van Schoor, and du Pisani, 2005); however, the technology has, to date, not been widely adopted or routinely implemented by the industry due to a number of reasons. These reasons, which will be discussed in more detail in the following section, relate mostly to the need to optimize the logistics of data acquisition as well as data processing, visualization, and interpretation.
The use of in-mine ground penetrating radar to date
GPR was first introduced to the local mining industry in the late 1980s (White, Frankenhauser, and Budd, 1989; Frankenhauser, White, and Budd, 1990; Frankenhauser and Kelly, 1993; Fenner, Kelly, and Frankenhauser, 1994; White et al., 1999). These early investigations into the feasibility of GPR in underground mines were driven by the need to find a tool that could map fractures and fracture intensity in support pillars, both before and after preconditioning. This pioneering GPR work was conducted by the former Chamber of Mines Research Organisation of South Africa (COMRO). The commercially available GPRs used in these early trial surveys were not designed for, or well suited to, harsh in-mine conditions. Furthermore, these systems were generally difficult to use and did not meet intrinsic safety requirements. These shortcomings were considered in the subsequent design of two mine-worthy systems. The first was the SIR-2M system, which was a collaborative effort between COMRO and GSSI around 1992-1994 (Fenner, Kelly, and Frankenhauser, 1994); the second was the RockRadar system developed around the same time by ISS International and ISS Geophysics, South Africa (White et al., 1999). The developers of RockRadar opted to focus on a deeper probing system and therefore produced a range of antennas between 90 MHz and 200 MHz frequency. In contrast the SIR-2M was designed for shorter range applications (higher frequency of 500 MHz). For about the next 5-0 years, these GPRs were used mostly on an ad-hoc basis in a variety of in-mine applications in local gold and platinum/chrome mines. However, despite several promising and successful surveys, GPR was still not implemented as a routine tool in any South African mines by the early 2000s. The use of these systems was still hindered by niggling problems. For example, the major criticism of the SIR-2M was that in an effort to meet intrinsic safety requirements the display was reduced from a full profile display to a single trace display, which made on-site analysis impossible. The major issue with the RockRadar system was portability - the lower frequencies required for deeper probing necessitated larger antennas and systems were often described as too bulky to be used effectively and routinely in underground environments.
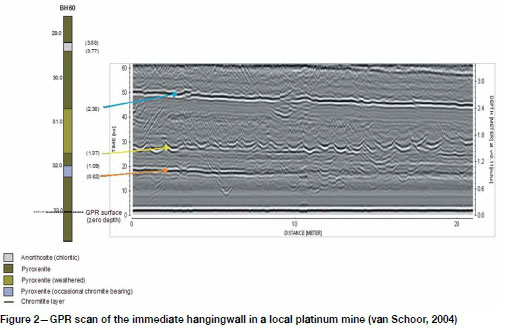
The next major effort to implement GPR in local mines occurred under the PlatMine collaborative research programme during the period 2002-2004 (van Schoor, 2004). One of the key objectives of this project was to assess technological advances in GPR and to compare different commercially available systems and recommend the system(s) that best met specific user requirements. Even though systems like SIR-2M and RockRadar offered significant improvements on the earlier commercial systems, there remained some negative perceptions around the use of GPR, as alluded to above. In particular, potential endusers were still concerned about shortcomings in terms of ease of use, portability, and real-time data display. Some of the newer systems, like the Sensors & Software, Inc. (S&SI) RockNoggin and GSSI's SIR-2000 and SIR-3000, proved to be able to address the above shortcomings adequately. During the following decade, the use of GPR on platinum mines increased, with several mines purchasing their own systems. It is estimated that a total of approximately 30 GPR units were acquired by at least 20 different mines during this period (Odgers, 2016). Figure 2 shows a good example of how GPR can be a really useful tool when utilized in the right environment and niche application, and the platinum and chrome mines of the Bushveld Complex proved to be generally conducive to the application of GPR. Rock engineers in these mines are often concerned with chromitite stringers, lithological boundaries, and key parting planes in the immediate hangingwall, and these features represent excellent radar targets. The data in Figure 2 was acquired using a S&SI RockNoggin GPR with a 500 MHz antenna.
Despite the great strides that were made during the PlatMine programme and subsequent years, the adoption of GPR technology could still be considered as slow. By 2015 it was established that, although some mines used GPR on a semiroutine or needs basis, it was still not integrated as a routine tool in production environments. The perceived slow adoption can be attributed to a combination of the following factors or obstacles.
1. Remaining negative perceptions regarding the performance of GPR - A commonly encountered perception is that GPR generally does not perform well in hard rock mines. This perception most likely stemmed from the fact that, in the past, mines often attempted to apply GPR in non-ideal or unsuitable environments and were disappointed when the output did not match their expectations.
2. Lack of sufficient understanding/knowledge of the technology - This can be attributed to the fact that although most mines have a resident geologist, access to an in-house geophysical expert appears to be the exception. This point is closely linked to the previous in that limited understanding/knowledge then also contributes to the negative perceptions.
3. Logistical challenges associated with the application of GPR - Although modern GPR systems are much easier to operate than the early systems described above (both ergonomically and from a user interface perspective), GPR remains challenging to apply as it still relies on manual data acquisition in environmentally and geometrically challenging sites.
4. Slow turnaround times - Despite the advent of real-time data display in modern GPRs, the ability to take advantage of this feature is usually not exploited by mines and a common complaint from industry is that there is often a waiting period of several days before survey results become available.
5. Integration of results with other mining information - One of the most valid criticisms of GPR has been the inability to integrate GPR outputs with existing mine plans and associated relevant information, and also to present GPR results in a meaningful way.
6. Limited spatial (3D) information provided by traditional 2D approach - The traditional 2D approach to in-mine GPR involves the acquisition of single GPR profiles, which only provide cross-sectional views of near-surface structure directly below the GPR profile. In many geological scenarios, the vertical and lateral spatial variation of features would be of interest to decision-makers, and it is anticipated that 3D GPR can provide this information.
The intention is to address the above obstacles through focused research done as part of the SAMERDI AOK programme, as well as other closely linked CSIR R&D projects. It should be emphasized that it is absolutely critical to consider all the above points in pursuing a technology solution. If any of these obstacles are not adequately overcome, the intended adoption and implementation will be compromised. The first topic that is being addressed in the associated research activities, and which also forms the main topic of this paper, is the evolution from 2D GPR to 3D GPR. Research into this area includes a series of proof-of-concept trial surveys aimed at demonstrating the potential value-add offered by the 3D survey approach.
Proof-of-concept 3D GPR trial surveys
Survey planning and design
Proof-of-concept trial surveys were conducted at two platinum mines (Mine A and Mine B) where the Upper Group Chromitite no. 2 seam (UG2) is exploited. At Mine A, the hangingwall consists of a chromitite stringer package made up of the Intermediate Chromitite Layer (ICL) and the Leader Chromitite Layers (LCL). This package typically occurs within the first 4 m of the immediate hangingwall; however, its depth, thickness, and undulation within the panel hangingwall is unknown. At Mine B a similar problem is encountered - a shear zone is known to exist, but its depth, thickness, and undulation within the hangingwall is also unknown. Knowledge of these factors is essential for selecting support design parameters such as the length and density of the roofbolts required to support the hangingwall. In order to determine the geometry of these structures, 3D GPR trial surveys were conducted at selected sites at these two mines. A RockNoggin GPR system with a 500 MHz antenna was used to acquire the data (Sensors & Software Inc, 2018). A 500 MHz antenna in the platinum environment typically achieves a penetration depth of about 4-6 m in the hangingwall, which is generally the depth of interest for hangingwall support purposes.
Mine A
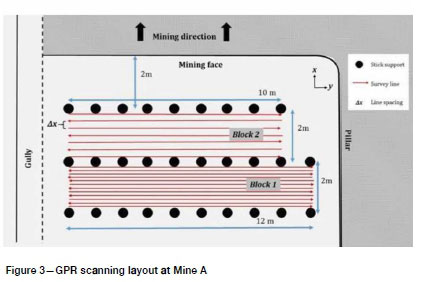
The test site at Mine A was a conventional narrow-reef stope. Due to the geotechnical complexities encountered at the site, a panel length of 15 m is used for stability purposes. The survey was designed to cover the area of the hangingwall within two rows of stick support elements. Figure 3 shows a schematic plan view of the survey layout. In order to fast-track data acquisition, data was collected in a zig-zag fashion. Two survey line spacings were employed: 0.1 m in Block 1 and 0.2 m in Block 2. The change in line spacing from Block 1 to Block 2 was motivated by production-related time constraints, but also offered the opportunity to assess the effect of increasing the line spacing on the quality of the 3D GPR model.
Mine B
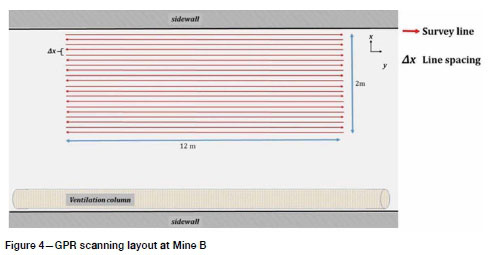
The second test site was a roadway in a mechanized platinum operation. Figure 4 shows a plan view of the survey layout.
Data acquisition
Data was acquired by moving the 500 MHz antenna along the hangingwall surface, following closely spaced parallel lines as per the survey designs in Figures 3 and 4. The total numbers of acquired survey lines were 26 (Mine A) and 17 (Mine B). Figure 5 shows a photograph of the survey block with survey line markings along the hangingwall of the roadway at Mine B; this photograph reveals some of the logistical issues that are associated with in-mine 3D GPR survey efforts.
One of the key findings of the trial surveys was that if 3D GPR surveys are to become a routine tool in hangingwall investigations, the process of data acquisition needs to be optimized. In particular, manually moving the antenna along pre-marked survey lines proved to be time-consuming and physically challenging. During these surveys, the survey crew also had to first spend some time marking out the survey block, as no automatic positioning technology was used for georeferencing the survey grid. Owing to the time needed for this important activity, less time is available for actual data acquisition, and consequently the very tight time constraints result in suboptimum surveys in terms of coverage or sampling density. Both survey preparation and data acquisition are further complicated in cases where the hangingwall is not at an easily reachable height (as is sometimes the case in mechanized sections) or if there is limited space for the survey crew in which to move and manoeuver the antenna and system (as is often the case in conventional narrow stopes). For these reasons, using manual labour to conduct 3D surveys is not desirable from a health and safety perspective - also because people are working underneath a potentially hazardous hangingwall.
For effective 3D GPR surveys, positioning accuracy is critical, in terms of in-line positioning of the antenna as well as of relative line positioning (Groenenboom, van der Kruk, and Zeeman, 2001; Lapazaran, 2016). With modern GPR systems that are operated on surface, issues of positioning accuracy can usually be mitigated through the use of high-precision GPS systems, supported by on-board odometer systems (Rial et al., 2006; Tanajewski and Bakula, 2016). These positioning strategies can provide acceptable accuracy in most applications; in some instances where very high precision is required - such as in landmine detection or in high-resolution archaeological studies, other technologies may also be employed. These could include the use of inertial measurement devices (Chicarella etat, 2016; Pasternak, 2014), photogrammetric methods (Barzaghi et al., 2016), and inclinometers (Prokhorenko et al., 2012).
In the underground mining environment, GPS-based positioning systems cannot be used, while some of the other common positioning aids such as odometers also cannot be employed effectively. In-mine GPR data acquisition is generally much more prone to positioning errors than surface surveys. This is particularly true of the hangingwall investigations described above, where the antennas are manoeuvred manually and the hangingwall topography is sometimes highly variable. Furthermore, it is also challenging to maintain a constant distance and angle between the antennas and the hangingwall and to consistently follow the intended survey profiles accurately. All of these sources of error, if not monitored and quantified, could ultimately contribute to inaccurate data interpretation.
To summarize, the logistics of in-mine GPR ultimately need to improve drastically in the following ways.
> Remove people from the equation - this could potentially be done by deploying GPR on an autonomous or remote-controlled unmanned vehicle or platform. This topic is currently under investigation in the SAMERDI AOK research programme.
> Improve accuracy by integrating GPR with suitable
positioning systems - not only will this improve accuracy and minimize human error, but it will also contribute to reducing overall survey times by effectively removing the need for manual preparation of the survey area as described above, as well as the associated georeferencing of the survey grid. This topic is also being investigated in the SAMERDI AOK programme. It is envisaged that 3D laser mapping technologies will be employed for mapping out the mining excavation and for localizing the abovementioned autonomous or remote-controlled vehicle. > Reduce survey times drastically - the actual data
acquisition time can be reduced significantly by adopting a multi-channel survey approach. Arrays of, say, four or more sensors can be employed to reduce the number of passes required to complete a 3D grid survey. The use of multi-channel systems to enhance survey accuracy and productivity is well documented in other areas of applied geophysics, such as in archaeological studies (e.g. Novo et al., 2012; Novo, Dabas, and Morelli, 2012; and Novo et al., 2013) and roadbed damage detection (e.g. Xu et al., 2014).
Data processing, visualization, and interpretation
GPR data is processed to transform the collected raw data (which comprises a collection of voltage vs time traces) into a meaningful image of the subsurface. This is done by sequentially applying a number of processing steps to the raw data in order to enhance the signals/reflections of interest. These processing steps typically include:
(1) A time-zero correction
(2) Mean subtraction (de-wow) to eliminate unwanted low-frequency components from the data
(3) Automatic gain control (AGC) to amplify low-amplitude ranges
(4) Background removal to suppress horizontally coherent energy and to emphasize anomalies that vary laterally such as diffractions; alternatively, filters can be applied that emphasize horizontally coherent energy rather than suppressing it.
To transform multiple 2D data-sets into a single 3D volume, Sensors & Software's GFP_Edit software was employed for the georeferencing of grid profiles and to produce the 3D input file that enables the depth slice module, Ekko_Mapper, to organize and operate on the data as a volume. The Ekko_Mapper software can be used to extract depth slices from the data volume, and can also be used to export 3D volumes for visualization in third-party visualization software tools such as Voxler. The basic processing steps referred to above can be done either within Ekko_Mapper or in any GPR processing software tool prior to depth slicing and subsequent exporting for 3D visualization. Examples of processed 2D radargrams from Mine A are shown in Figure 6. For the purpose of comparison, two radargrams, spaced approximately 1.6 m apart, are shown.
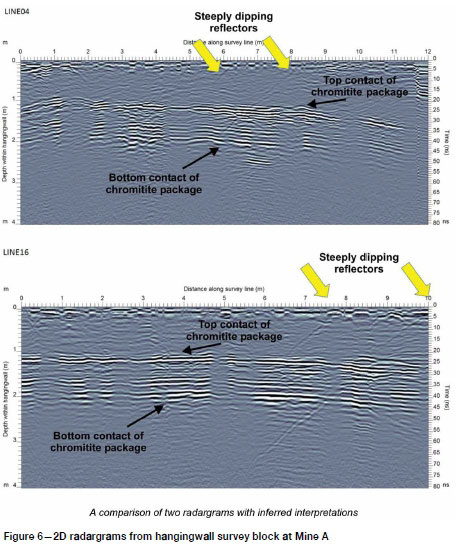
In the radargram interpretations presented in Figure 6, two prominent reflectors can be identified at approximately 1 m and 2 m within the hangingwall. These are interpreted as the bottom and top contacts of the chromitite package. In addition, two steeply dipping reflectors can be identified at 6 m and 8 m along the survey line on LINE4 and at 8 m and 10 m on LINE16. These are interpreted as steeply dipping fractures occurring in the immediate 4 m of the hangingwall. The longer of the two fractures cuts through the chromitite package while the shorter terminates at the bottom contact of the package. The interaction of the horizontally lying chromitite package and the steeply dipping fractures could result in the formation of a potential loose block of rock within the hangingwall. The interpretation presented in Figure 6 gives important, but limited, information about the hangingwall. As was alluded to previously, the 3D approach can be used to extract more information by combining the individually collected 2D radargrams into a single volume of data.
Figure 7 presents the rendered 3D isosurface model of the hangingwall at Mine A showing the imaged chromitite package within the hangingwall. An isosurface is a surface of constant value in a three-dimensional volume. Since reflections from the chromitite package come from similar chromitite layers, the isosurface representation enhances the delineation of the package from the surrounding rock mass.
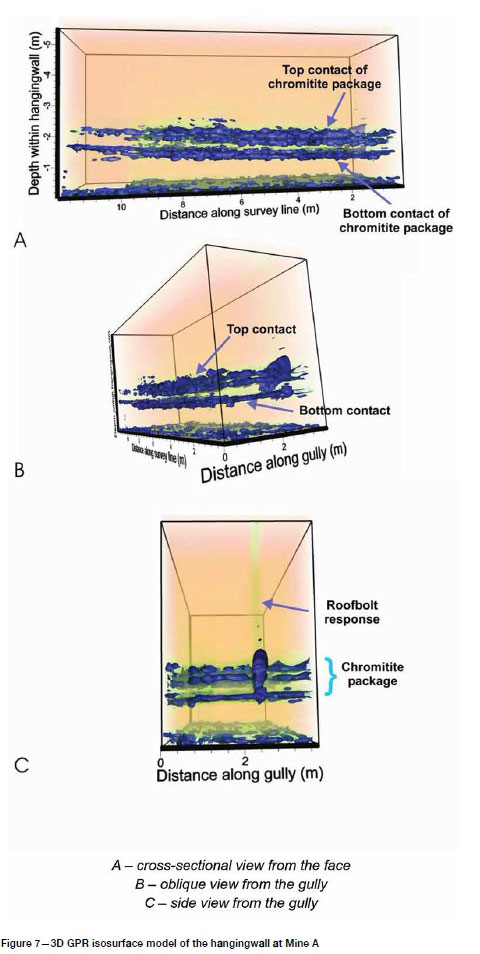
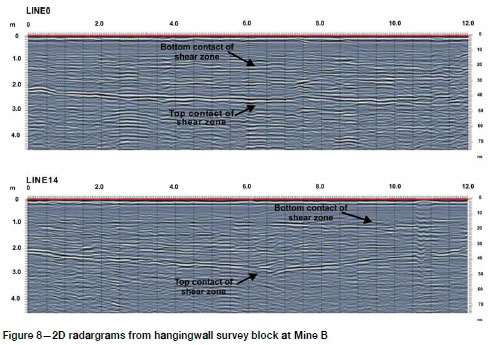
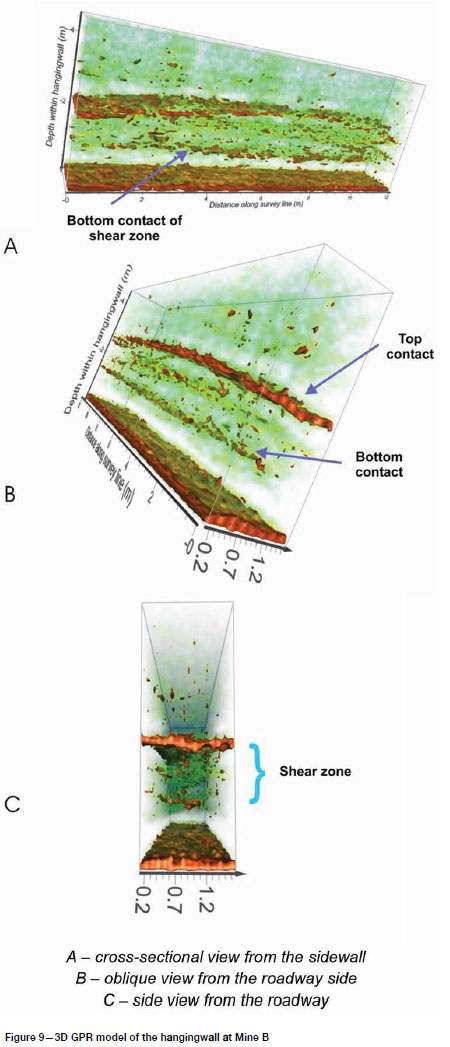
Figure 8 presents a comparison of two closely spaced 2D radargams from the Mine B survey, while Figure 9 shows the rendered 3D model of the immediate hangingwall, with the imaged chromitite package within the hangingwall.
Discussion of results
Mapping of key hangingwall features
The 3D GPR models of the hangingwall at both mines show that 3D surveying can be used to image key features within the immediate hangingwall. The survey at Mine A successfully imaged the depth, thickness, and geometry of the chromitite package within the hangingwall. For this survey, two line spacings (0.1 m and 0.2 m) were used for data acquisition in order to assess the effect of line spacing on the quality of the rendered 3D model. No significant effect on the quality of the model rendered was found. It should be noted that increasing the line spacing beyond the antenna width will compromise the accuracy of the 3D representation of the rock mass being imaged. It is thus suggested that 0.2 m be used as the maximum line spacing for data acquisition for an antenna with a centre frequency of 500 MHz. The rendered model indicated that the chromitite package is at a depth of 1 m within the immediate stope hangingwall and about 1 m in thickness. The bottom and the top contacts of the package were imaged at 1 m and 2 m within the hangingwall respectively. The model also shows that the package is flat-lying and parallel to the surface of the hangingwall within the surveyed area.
A very important aspect of 3D GPR needs to be highlighted here: One should not rely only on the 3D views and derived visualizations, such as depth slices, to reveal all potential features of interest in a survey. Instead, one should jointly consider 3D views and individual 2D cross-sectional views to extract the maximum useful information from the acquired data (van Schoor, Nienaber, and Marais-Werner, 2017). While a 3D view offers a more attractive and intuitive visualization of the data, it does not always reveal some of the subtle features that may be of interest to the end-user. This is so because the 3D processing introduces an additional level of filtering and smoothing and this, coupled with the more global view of the whole data volume (compared to the more localized 2D perspective), may result in the suppression of smaller-scale features. This is evident in the 3D analysis of Mine A, where the steeply dipping features seen in the 2D radargram (Figure 6) do not manifest clearly in the 3D views (Figure 7). The value of the 3D survey approach and associated 3D visualizations is nevertheless significant. For example, in beam thickness investigations, if the target plane is flat-lying, one or two 2D radargrams may provide sufficient information to inform support design for the excavation. Selected 2D analyses may, however, fail to detect beam thickness variations in all dimensions. This is, for example, evident in the comparison of LINE4 and LINE16 acquired at Mine A (Figure 6). On the LINE4 radargram the bottom contact depth varies between approximately 1.0 m and 1.8 m along the profile; however, on LINE16 it remains mostly between 1 m and 1.2 m. This variation, which might be critical from a rock engineering and support design perspective, would not necessarily be detected when using a traditional 2D approach.
The survey at Mine B also successfully imaged the depth, thickness, and geometry of the shear zone within the hangingwall. The zone was found to be fairly flat-lying and at a depth of 1 m within the immediate hangingwall of the roadway. The zone is about 1 m in thickness, with the bottom and top contacts imaged at 1 m and 2 m within the hangingwall at the surveyed area.
The above shortcoming of only considering selected 2D profiles in an area is also evident in the analysis of the survey at Mine B. Figure 8 compares a profile acquired close to the centre of the roadway with a profile located approximately 2 m away, closer to one of the sidewalls. Note that in the first radargram, the depth of the top contact of the shear zone in the central portion of the radargram is approximately 2.5 m, while in the second radargram it appears approximately 0.5 m deeper. This difference might prove to be critical from a rock engineering and support design perspective. While this variation can be quantified much better through a detailed analysis of the 2D radargrams, the 3D views in Figure 9 do provide some first-pass visual cues.
Another advantage of 3D modelling is that it provides rock engineers, geologists, and mine planners with an added layer of information to add to their 3D CAD mine models. The rendered 3D models can be zoomed in/out and rotated to allow viewing from different angles and perspectives. Additionally, depending on the type of the target being imaged, different volume outputs can improve visualization and enhance delineation of the targets of interest. Data from the two underground sites presented above, where the targets of interest were planar extending structures, indicated that volume rendering and isosurfaces are the most effective 3D representations of the volume data.
Implication / value-add for mining
This proof-of-concept study demonstrated that 3D GPR can be used as a hazard mapping tool, particularly for assessing the stability of the hangingwall. The technology, when applied in 3D mode, has the potential to identify and quantify the risk posed by falls of ground in underground mines. This can assist mine personnel such as rock engineers in making better-informed decisions with regards to optimization of required hangingwall support, such as roofbolt length and density. 3D GPR surveying can add value to mining in terms of improving safety by assisting in falls-of-ground mitigation, thus contributing to the 'zero harm' objective of the industry.
Conclusion and recommendations
Since the introduction of GPR to the South African mining industry more than two decades ago, the potential of the technology as a routine hangingwall assessment tool has been demonstrated on numerous occasions. However, adoption and development of the technology to fulfil this role has been relatively slow. Several reasons for this have been given in this paper, but the matter essentially boils down to the fact that the technology has never been sufficiently optimized and adapted for it to be implemented on a routine basis without being a hindrance to production-related activities. Ongoing research, conducted as part of the SAMERDI strategy and aligned to CSIR research activities aims to address the obstacles that have in the past prevented GPR from becoming a routine AOK solution. The research will address various aspects of the GPR survey process, including the reduction of survey and data turnaround times, improving positioning and data accuracies, and making the data acquisition process safer.
One of the first and most important topics that has been tackled is advocating the use of 3D GPR instead of the single-profile 2D approach that has traditionally been used for in-mine surveys. The adoption of the 3D approach 'kills two birds with one stone' - it firstly will enable decision-makers to obtain more complete geological/geotechnical information by assessing a complete volume of the immediate hangingwall instead of selected cross-sectional profiles; secondly, it will enable operators to speed up data acquisition significantly, provided a multi-sensor/multi-channel system can be employed. In the trial surveys reported on here, the first step of demonstrating the value-add of the 3D approach was successfully completed; the 3D data examples presented clearly reveal the type of quantitative information that could not be extracted easily with the traditional 2D approach. The study did, however, reveal a very important point relating to 3D GPR - analysis of the 3D models should always be done in conjunction with individual 2D radargrams to optimize the extraction of detailed information. While the 3D views do provide a bigger picture perspective of the characteristics of geological structures in an area, 2D analysis of cross-sectional radargrams is still important for extracting subtle and detailed features that may not manifest clearly in the 3D models.
Going forward, one of the next steps in the GPR research journey would involve the deployment of a multi-sensor GPR on a suitable remote-controlled or autonomous platform. The latter could be a dedicated, customized robotic or unmanned platform or it could be an existing mining machine. It is anticipated that the ideal deployment platform may depend on the mining method and layout. The successful implementation of a GPR deployment platform will not only contribute to reducing survey times, but it could also help to remove people from potentially hazardous hangingwall scenarios; for example, in executing routine entry examinations.
Another important topic for ongoing GPR research is that of in-mine positioning. 3D GPR requires a high level of positioning accuracy and this will become more critical when data acquisition is automated or remote-controlled. The successful implementation and integration of a high-precision positioning system will also contribute to reducing survey times as it will eliminate the need for time-consuming survey layout and marking as part of the survey preparation process or for pre- or post-survey georeferencing of the survey site.
As a final recommendation, the continued trial/demonstration survey approach is strongly advocated. However, it is imperative that such surveys be conducted with the known niche applications of GPR in mind. It is also critical to continually raise awareness in the local mining industry regarding ongoing GPR research activities to help mitigate the remaining negative perceptions relating to GPR, and also to enhance the appreciation and understanding of GPR and its strengths, weaknesses, and pitfalls through regular knowledge transfer activities.
Acknowledgements
The authors would like to acknowledge the CSIR and the Mandela Mining Precinct for their support.
References
Barzaghi, R., Cazzaniga,N.E., Pagliari, D., and Pinto, L. 2016. Vision-based georeferencing of GPR in urban areas. Sensors (Basel), vol 16, no. 1. doi: 10.3390/s16010132 [ Links ]
Chicarella, S., Ferrara, v., Frezza, F., D'Alvano, A., and Pajewski, L. 2016. Improvement of GPR tracking by using inertial and GPS combined data. Proceedings of the 24th International Conference on Software, Telecommunications and Computer Networks (SoftCOM). doi: 10.1109/SOFTCOM.2016.7772148 [ Links ]
Creamer, M. 2018. Exciting new mining research thrust. Mining Weekly, 27 April 2018. https://www.miningweekly.com/article/exciting-new-mining-research-thrust-2018-04-27 [ Links ]
Department of Mineral Resources. 2017. Occupational Health and Safety Report, October 2017. https://www.dmr.gov.za/Portals/0/MHSI_Library/Mine_Accidents_and_Disasters/OHS_Monthly_Report_2017-10.pdf?ver=2018-03-15-105126-570 [ Links ]
Fenner, T., Kelly, Α., and Frankenhauser, R. 1994. The development of a mine worthy ground penetrating radar system. Proceedings of the Society of Mining Engineers Conference, Albuquerque, NM, February 1994. [ Links ]
Frankenhauser, R.M. and Kelly, A.M. 1993. Ground penetrating radar applications and developments in the South African Mining Industry: Expanded Abstracts, Proceedings of the Third Technical Meeting of the South African Geophysical Association, Cape Town, South Africa, 14-16 April 1993, [ Links ]
Frankenhauser, R.M., White, H., and Budd, D.K. 1990. A preliminary study to establish the potential for using ground penetrating radar for the assessment of pillar integrity in a platinum mine. Technical Report no. 39931. CSIR (COMRO), Johannesburg. [ Links ]
Groenenboom, J., van der Kruk, J., and Zeeman, J.H. 2001. 3D GPR data acquisition and the influence of positioning errors on image quality. Extended Abstract, Proceedings of the EAGE 63rd Conference and Technical Exhibition, Amsterdam, 11-15 June 2001. http://earthdoc.eage.org/publication/publicationdetails/?publication=4566. [ Links ]
Lapazaran, J.J., Otero, J., MartIn-Espanol, Α., and Navarro, F.J. 2016. On the errors involved in ice-thickness estimates I: Ground penetrating radar measurement errors. Journal of Glaciology, vol. 62, no. 236. pp. 1008-1020 [ Links ]
Novo, Α., Dabas, M., and Morelli, G. 2012. The STREAM X Multichannel GPR system: First test at Vieil-Evreux (France) and comparison with other geophysical data. Archaeological Prospection. doi: 10.1002/arp.1426 [ Links ]
Novo, Α., Leckebusch, J., Goodman, D., Morelli, G., Piro, S., and Catanzariti, G. 2013. Advances in GPR imaging with multi-channel radar systems. Journal of Surveying and Mapping Engineering, vol. 1. pp. 1-6. [ Links ]
Odgers, T. 2016. Red Dog Scientific Service. Personal communication, October 2016. [ Links ]
Pasternak; M., Miluski, W., Czarnecki, W., and Pietrasinski, J. 2014. An optoelectronic-inertial system for handheld GPR positioning. Proceedings of the 15th International Radar Symposium (IRS), Gdansk, Poland, 16-18 June 2014. doi: 10.1109/IRS.2014.6869297 [ Links ]
Prokhorenko, v., Ivashchuk, v., Korsun, S., Musiyachenko, S., and Borodavka, V. 2012. Topographic correction of GPR profile based on odometer and inclinometer data. Proceedings of the 14th International Conference on Ground Penetrating Radar, Shanghai, China, 4-8 June. IEEE, Piscataway, NJ. pp. 425-429. [ Links ]
Rial, F.I., Pereira, M., Lorenzo, H., Arias, P., and Novo, Α. 2006. Use of ground penetrating radar and global positioning systems for road inspection. Proceedings of the International Calibration and Orientation Workshop (EuroCOW), Castelldefels, Spain, 25-27 January 2006. https://www.isprs.org/eurocow06_files/papers/Ecw05_gps_gprisrael [ Links ]
Tanajewski, D. and Bakuia, M. 2016. Application of ground penetrating radar surveys and GPS surveys for monitoring the condition of levees and dykes. Acta Geophysica, March 2016. doi: 10.1515/acgeo-2016-0006. [ Links ]
Van Schoor, M. 2004. Implement and optimise ground penetrating radar project final report. Report no. 2004-0084. PlatMine, Johannesburg. [ Links ]
Van Schoor, M. and Kgarume, T. 2018. Towards zero harm - identifying and quantifying the risk posed by falls-of-ground using ground penetrating radar. Proceedings of the MineSAFE Conference, Gallagher Convention Centre, Johannesburg, 29-31 August. Southern African Institute of Mining and Metallurgy, Johannesburg. [ Links ]
Van Schoor, M., du Pisani, P., and Vogt, D. 2006. High-resolution, short-range, inmine geophysical techniques for the delineation of South African orebodies. South African Journal of Science, vol. 102. pp. 355-360. [ Links ]
Vogt, D., van Schoor, M., and du Pisani, P. 2005. The application of radar techniques for in-mine feature mapping in the Bushveld Complex of South Africa. Journal of the South African Institute of Mining and Metallurgy, vol. 105. pp. 447-452. [ Links ]
Van Schoor, M., Nienaber, W.C., and Marais-Werner, Α. 2017. A controlled monitoring study of simulated clandestine graves using 3D ground penetrating radar. Near Surface Geophysics, vol. 2017, no. 15. pp. 274-284 [ Links ]
Vorster, Β. and Franklin, D. 2008. Immediate ground support, after development or stope face exposure, can prevent falls of ground. Proceedings of Narrow Vein and Reef2008. Southern African Institute of Mining and Metallurgy, Johannesburg. http://www.saimm.co.za/Conferences/NarrowVein2008/03-Franklin.pdf [ Links ]
White, W., du Plessis, Α., Noble, K., and Treloar, M. 1999. Routine application of radar in underground mining applications. Proceedings of the 12th Annual Meeting, Symposium on the Application of Geophysics to Environmental and Engineering Problems (SAGEEP), Wheat Ridge, CO. Environmental and Engineering Geophysical Society. pp. 197-206 [ Links ]
White, H., Frankenhauser, R.M., and Budd, D.K. 1989. Delineation of an underground haulage from a neighbouring crosscut using ground penetrating radar. Technical report no. 90057. CSIR (COMRO), Johannesburg. [ Links ]
Xu, X., Peng, S., Xia, Y., and Ji, W. 2014. The development of a multi-channel GPR system for roadbed damage detection. Microelectronics Journal, vol. 45. pp. 1542-1555. [ Links ]
Zlot, R. and Bosse, M. 2012. Efficient large-scale 3d mobile mapping and surface reconstruction of an underground mine. Tracts in Advanced Robotics. doi: 10.1007/978-3-642-40686-7 [ Links ]
 Correspondence:
T. Kgarume
Email: tkgarume@csir.co.za
Received: 24 Jan. 2019
Revised: 2 Aug. 2019
Accepted: 2 Aug. 2019
Published: November 2019

