


Services on Demand
Article
 English (pdf)
 Article in xml format
 Article references
Indicators

Related links
-
 Cited by Google
 -
 Similars in Google
Share

 Permalink
Journal of the Southern African Institute of Mining and Metallurgy
On-line version ISSN 2411-9717
Print version ISSN 2225-6253
J. S. Afr. Inst. Min. Metall. vol.119 n.7 Johannesburg Jul. 2019
http://dx.doi.org/10.17159/2411-9717/322/2019
PAPERS OF GENERAL INTEREST
Stability considerations for slopes excavated in fine hard soils/soft rocks at Cobre Las Cruces mine, Sevilla, Spain
S. CooperI; M.D. RodriguezI; J.M. GaleraI; V. PozoII
IUniversidad Politécnica de Madrid
IISubterra Ingeniería
SYNOPSIS
Cobre Las Cruces mine extracts copper minerals from a VMS deposit located in the well-known Iberian Pyrite Belt (IPB). As an open pit, it is distinguished geologically from other IPB mines by the presence of around 150 m of Tertiary soft marls, known locally as the Guadalquivir Blue Marls, followed by a regionally important aquifer. Below the marls and aquifer the mineralization is hosted by rocks typical of the Palaeozoic within the IPB, comprising gossan, tuffs, slates, and sulphides.
This combination of a substantially soft rock and more competent, older (but still occasionally problematic) Palaeozoic lithologies constitutes a unique geological framework and presents substantial challenges in maintenance of slope stability, and therefore operational safety, at the mine site. This paper describes the fundamental design, excavation, and monitoring measures implemented at the mine to maintain safe production, and the lessons learnt during the mine development.
Keywords: pit design, slope stability, monitoring.
Introduction
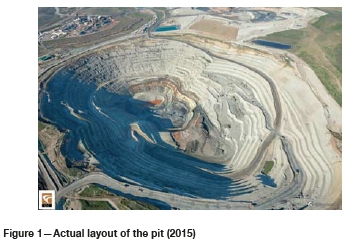
As a modern Spanish mine, Las Cruces is committed to the use of best available technology and practices with the aim of guaranteeing the production of ore in a safe environment. From a practical perspective, this implies the realization of a high quality pit design, ongoing geotechnical mapping of exposed slopes to ensure conformity with design, and use of leading geotechnical surveillance technology to complement visual observations. The focus of this article is to illustrate how, at a mine site with potentially problematic soil/rock conditions, multiple advanced techniques employed from design stage analysis through to final pit configuration and vigilance, were combined to achieve an overall control of the ground conditions. In Figure 1 the layout of the pit is shown, illustrating development at the beginning of 2015.
Mine description
The mine is an open pit measuring 1600 m by 900 m (final pit shell) with a maximum depth of 250 m. The mine extracts copper sulphides from the same volcano-sedimentary Palaeozoic deposit as the Rio Tinto and Aznalcollar mines. The ore is overlain by 140-150 m of the tertiary soft marls known as the Guadalquivir Blue Marls (Oteo, 2000). Below these marls there is a sandy formation that constitutes, together with the weathered top part of the Palaeozoic, a known aquifer denominated 'Niebla-Posadas'. Regionally, the water table is located around 30 m below the surface. Finally the Palaeozoic, in which the mineralization is hosted, is defined by slates, tuffs, and porphyric rocks.
To access the mineralization a pre-stripping excavation of the marls is required. These marls constitute a problematic unit from a geotechnical point of view as they present weak strength and low deformational parameters. This concern (associated with a lack of experience of such excavations in the Guadalquivir marls) strongly conditioned the original pit geometry, which was defined by an overall slope of 28° from the surface down to 150 m depth. In the Palaeozoic strata, a general slope of 45° was adopted.
The marls are highly impermeable (k = 109 to 1010 m/s) and so, without some form of hydromechanical coupling, a flow-based analysis would predict only a small pore pressure drop due to flow towards the pit. An additional aspect that required consideration and inclusion at the design stage was the incorporation of a perimetral drainage system. The system was based on well points drilled directly into the aquifer and pumping commenced prior to pit excavation, to minimize environmental impacts and improve geotechnical behaviour as excavation progressed.
Geological and geotechnical characterization at the mine
Initial characterization of the rocks was by dedicated geotechnical drilling and laboratory testing. Use was also made of geological drilling undertaken to assess the orebody characteristics.
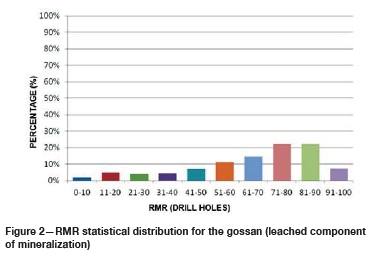
As part of a standard operating procedure, geotechnical logging of key geological mineral resource boreholes was undertaken (over 45 000 m of drilling prior to pit development). Additional complementary drilling of over 700 m of purely geotechnical boreholes was carried out in order to target explicit unknowns and improve the characterization of the surrounding host rocks. These boreholes were logged and analysed in detail. Figure 2 shows an example of the RMR histogram compiled for the mine's gossan zone (with an average thickness between 10 m and 20 m, commencing at around 150 m depth) highlighting the RMR statistical distribution for this lithology using the drillhole database. This RMR characterization was further improved following processing of in-pit mapping once stripping exposed this lithotype.
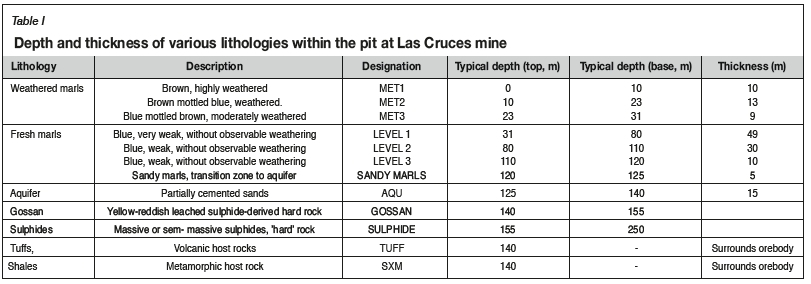
Summarizing all the existing data, Table I shows the stratigraphy of the mine from top to bottom, including the typical thickness of each unit.
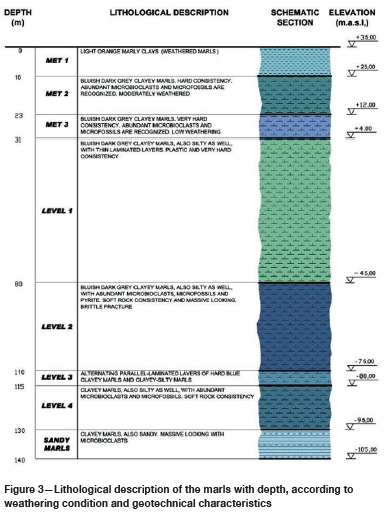
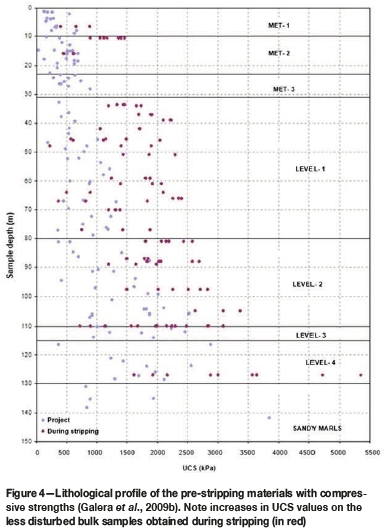
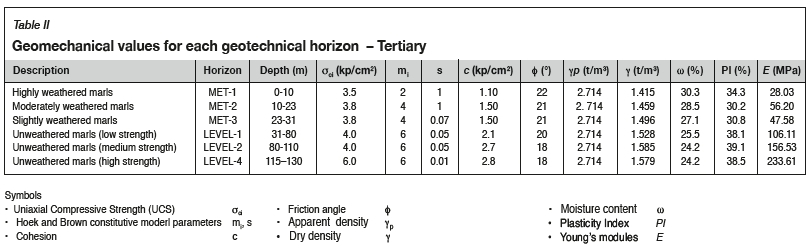
Figure 3 shows the detailed stratigraphy of the Tertiary strata that overlie the ore. Figure 4 shows the evolution of the UCS with depth, with distinction made between pre-excavation tests undertaken on samples from drill-holes, and tests on bulk samples obtained in the field during excavation, which were considered to be less disturbed. Table II shows the main geomechanical values for each horizon.
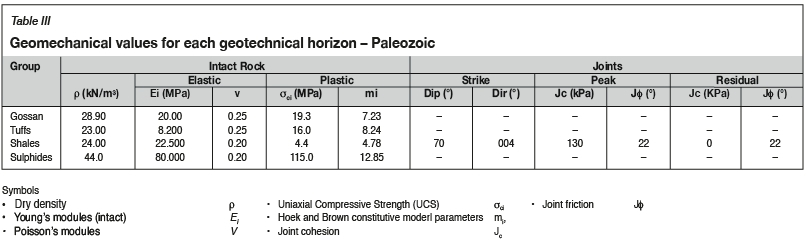
Below the marls and aquifer the mineralization is hosted by the rocks typical of the Palaeozoic within the Iberian Pyrite Belt. For the purposes of geotechnical evaluation the following lithologies were established: gossan, tuffs, slates, and sulphides. Geologically, these lithologies can be further sub-categorized with respect to their geochemistry. Table III includes strength and deformability values for the existing lithologies in the Palaeozoic.
Initial design (2003)
Using the geomechanical data from the site investigation based on boreholes and laboratory and in situ testing, an initial design of the slopes was undertaken for the mine using final pit shell configurations to provide a geometry for a 2D limit state analysis, applying the Rocscience geotechnical programme SLIDE as well as FLAC2D finite difference code for deformation analysis.
In fundamental terms, the limit state programme SLIDE undertakes systematic calculations of various slip circle configurations, discretely separating the geometry into slices to determine the least favourable situation with respect to balance of forces. Deformations are not considered in this type of analysis. Instead, the programme calculates the ultimate limit state condition of the slope, utilizing the geotechnical characterization of the soils and rock to determine the maximum resistance provided by the overall rock mass, comparing the sum of these values against the stresses induced by the weight of the rock mass in order to determine a safety factor for stability.
FLAC2D finite difference code was utilized to obtain information on localized overstresses, to better determine the transition from peak to residual resistance conditions and in order to determine deformation magnitudes for subsequent interpretation of displacement monitoring data from instrumentation in the field.
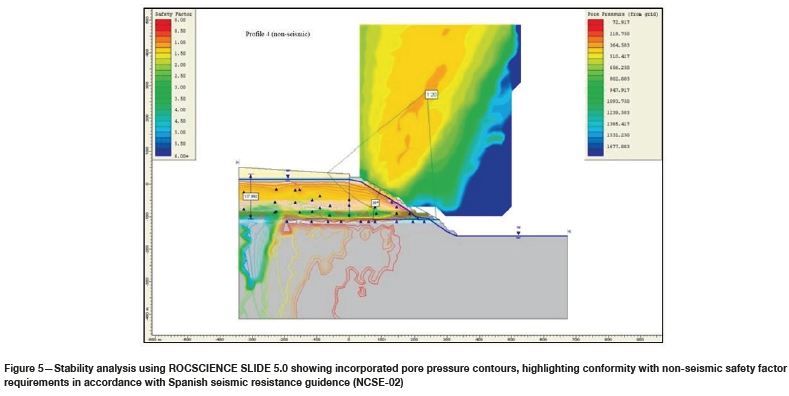
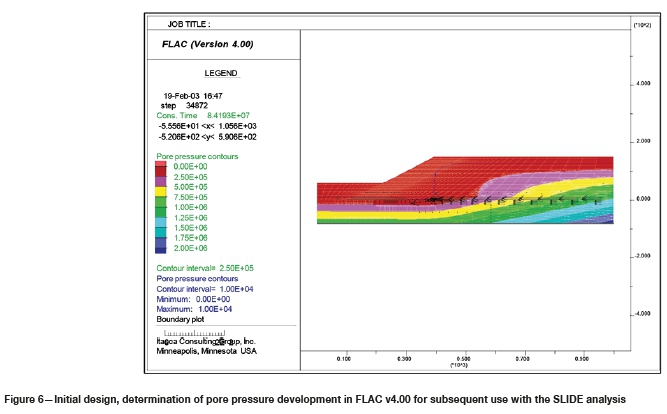
Figures 5 and 6 show typical examples of slope stability analysis at the mine; the first to determine the ultimate limit state using the method of slices, the second using finite difference stress-strain analysis software to determine deformation magnitudes.
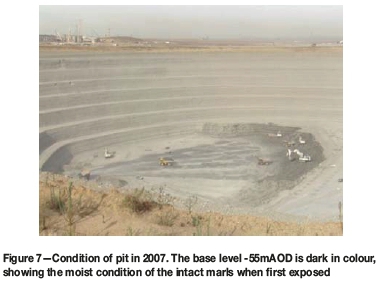
It should be stressed that with this initial design the mine operated successfully for 3 years, until a refinement process commenced in 2007. Figure 7 shows the relatively good condition of the pit in late 2007, one year after commencement of pre-stripping operations.
Key points of the 2003 initial design
> The use of limit state equilibrium analysis software to determine the minimum safety factor required for compliance with legislative requirements. Spanish mining law ITC 07-0103 stipulates minimum safety factors of 1.2 for non-seismic conditions and 1.1 for seismic conditions, with those seismic conditions being established by the country geographic register for earthquake potential
> Assumption of overlying homogenous marls subject to non-structural failure mechanisms
> Use of FLAC v4.00 to generate pore pressures associated with pre-strip pumping of the SDR (system of drainage and reinjection) network. The SDR network comprised a ring of perimetral drainage wells designed to draw water away from the pit, to be returned to the ground via re-injection at a considerable distance from the mine. The beneficial drawdown effect created by this drainage system needed to be considered within the FLAC analysis
> Strain-softening characteristics incorporated into marl parameters. A particular early concern regarding the marls was the high ratio between peak and residual resistance parameters. This varied with respect to the depth and weathering condition of the marls; however, typical peak friction angles were determined from laboratory tests (triaxial and shear box) at 21°, while the residual friction angles for the same marls were as low as 7° with deformations at less than 3%.
Pit vigilance
The slopes were intensively monitored from the very first stages of pre-striping. The instrumentation implemented was based on two types of measurement: deformation (using inclinometers and topographical surveys) and pore pressure measurement using vibrating-wire piezometers. These piezometer installations were initially sand-packed constructed, although during mining development and trialling in non-essential zones, the construction methodology was switched to grouted piezometers in later years, which proved quicker to equilibrate and easier to install.
Topographical monitoring (the GeoMoS monitoring system)
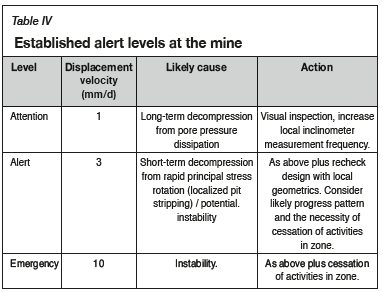
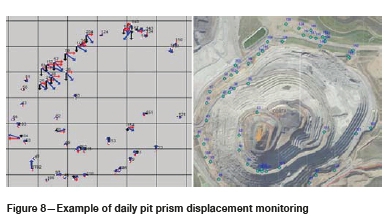
Slope surface movement was monitored using a GeoMoS topographical system. An early version of the system was installed during the first stages of pre-stripping, enabling movements to be catalogued and compared with determined velocity alert levels. These levels are shown in Table IV, while Figure 8 shows an example of the topographical prism survey on the perimeter of the pit as well as inside it, on the operational ramp.
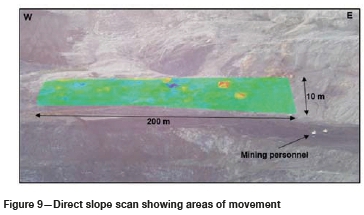
Over the years the system has been overhauled to increase reliability and measurement frequency (as high as one reading every 20 minutes of well over 100 prisms). In 2014 two more advanced systems were purchased; a pit slope scan from one of these is showed in Figure 9. The first of these systems was placed on the south side of phase 3 of the pit to reduce distances to prisms in newer phases and thereby increase precision. The most recently installed system represented a significant jump in the technology, enabling direct laser-based measurement of the slope surfaces (eliminating the need to install prisms in potentially unstable slopes). This system, near-analogous to a more expensive radar system, was installed within the Palaeozoic to monitor slopes during the extraction of an unanticipated highgrade ore zone in contact with problematic shales. The purchase costs of the system were justified by it enabling the operations team to guarantee personnel safety while extracting substantial additional ore not contemplated in the original pit configuration.
In-ground monitoring
Over the mining facility (including both pit and dumps) a matrix of piezometers and inclinometers was installed. The number of instruments increased proportionally with the mine development from the early stages to the current configuration of 72 piezometers and over 50 inclinometers.
Piezometers
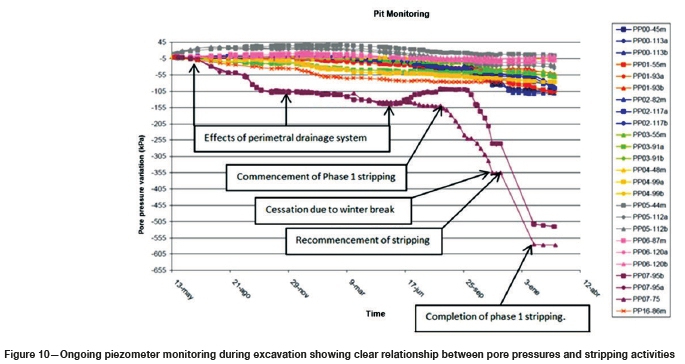
Piezometric levels were monitored to ensure that pore pressures did not exceed levels where the slope stability safety factors could be considered to be compromised. Figure 10 shows an example of the ongoing monitoring of the pore pressure around the pit. Figure 11 provides a plan view of the position of these piezometers in the field.
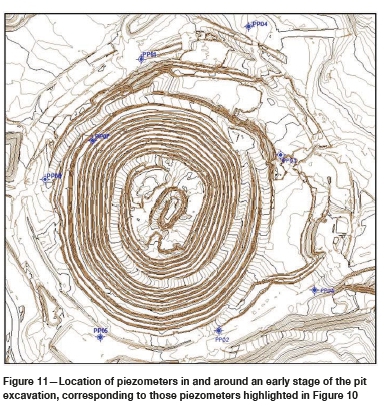
Piezometer information is also utilized to monitor the effects of shutdown in sectors of the SDR system for maintenance purposes. Finally, the development of pore pressures during mining activities for over 10 years, as described previously, provided invaluable information for checking and calibrating the estimated pore pressures generated by the hydro-coupling process utilized in FLAC3D.
Conventional inclinometers
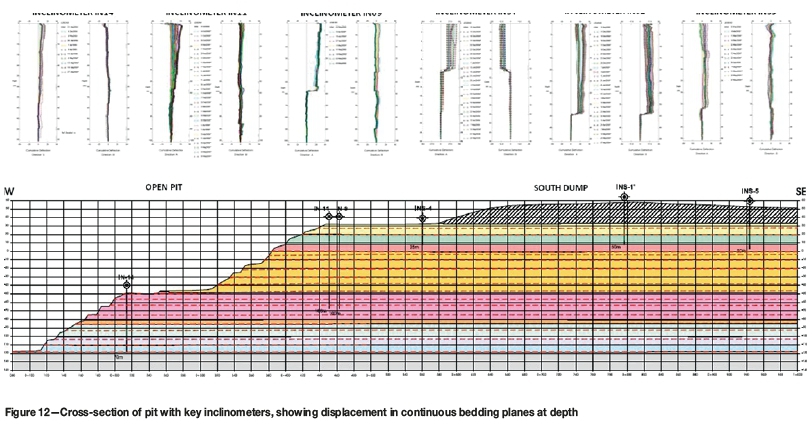
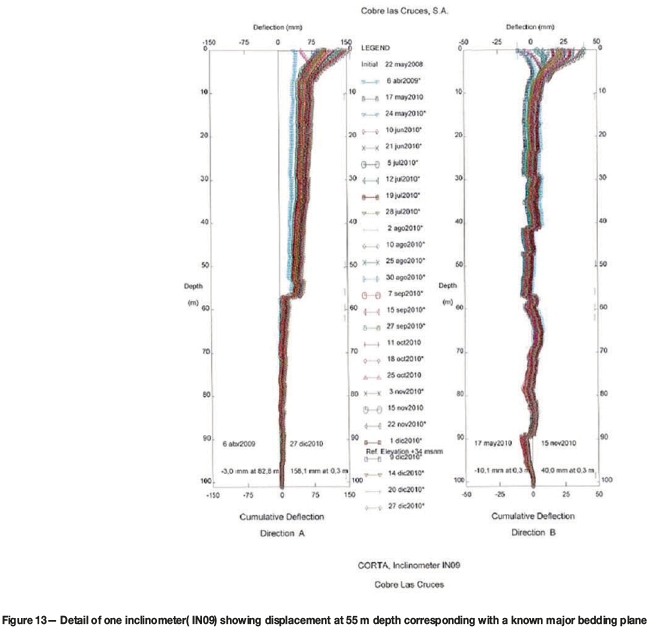
Predominant use was made of conventional inclinometer systems comprising continuous metal tubes installed to depths of up to 140 m. The distortions of these tubes were measured manually on a weekly or twice-weekly basis and compared with previous readings to calculate displacement velocities. Figure 12 shows a cross-section of the pit incorporating the south dump, showing the displacements detected within bedding planes at depth. Figure 13 shows an enlarged view of one of these inclinometer profiles indicating, for a perimetral location, the magnitude of displacements that manifested at bedding plane positions during pit excavation.
Real-time inclinometer readings
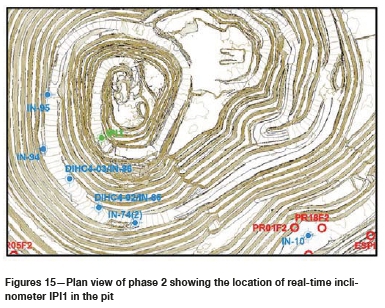
As well as conventional inclinometers, in key areas of the pit, technically more advanced inclinometers were installed. These systems enabled continuous information to be gathered as well as displacement exceedance alerts to be sent directly to the geotechnical engineers' mobile telephone (a functional tool also available for the topographical prism system). Figure 14 shows the cumulative displacements detected with a real-time inclinometer. This inclinometer was placed in the southwest of the phase 2 area for vigilance purposes during the extraction of high-grade mineralization adjacent to the mine's less competent footwall shales. Figure 15 shows the location of this particular real-time inclinometer with respect to the pit's phase 1 area.
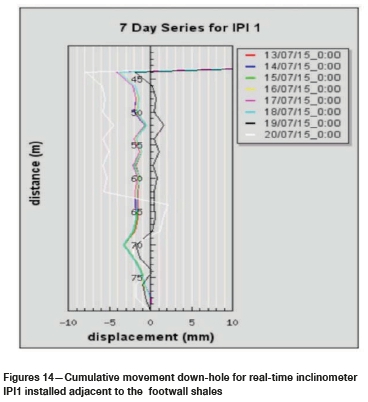
These inclinometers were more costly than conventional systems but provided far more information with respect to the evolution of movement and reaction of the substrata in real time during mining activity in that particular area; for example, deepening of an adjacent excavation. Given the extra costs involved, the most optimal form of implementation was to begin with a localized analysis of the slope of concern and the commencement of monitoring with conventional inclinometer systems to understand where instability was most likely to occur. Once this was firmly established, the zones with higher risk of instability were then targeted with real-time sensors. This continues to be the installation philosophy employed at Las Cruces Mine.
Visual inspections and geotechnical mapping
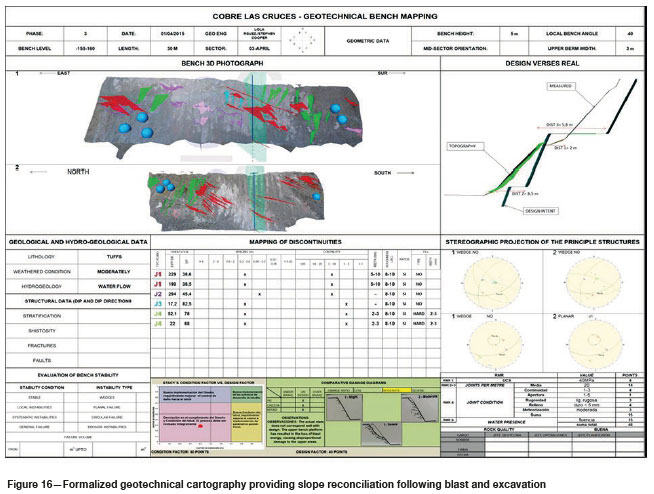
All the above instrumental vigilance was complemented by solid and ongoing in-the-field observation. This varied from simple but regular slope inspections undertaken to ensure short-term stability in operative areas, through to complex geotechnical reconciliation cartography to determine the quality and condition of the blasting and excavation works in comparison. Figure 16 shows a typical geotechnical mapping of a mine bench using conventional methods as well as stereographical photo methods. The mine employed 3D photography complemented with structural observations carried out on site. Post-processing of the photographs also provided an opportunity to encounter structures not accessible during the mapping due to safety considerations. The mapping as usual detailed the rocks' lithological and structural characteristics (orientation, weathering condition, roughness, fill etc.). In addition, the mapping attempts to undertake an objective evaluation of the efficiency of the blast utilizing factors associated with blast condition, and conformity to intended design.
Summary of design stages
Over the first 10 years, during stripping and ore extraction, the initial geotechnical model and design were modified and refined, culminating in additional investigation and geotechnical parameter characterization in 2012.
The work in 2012 was initially undertaken for due diligence purposes to complement an ongoing geological infill drilling campaign. Nevertheless, from the outset focus was placed on the possibility of increasing pit angles in the more competent lower marls. This possibility seemed reasonable, given increases observed in resistance parameters with depth, as calculated from bulk samples (considered less disturbed) obtained during the pit excavation. Additionally, during stripping a notable transition in strength at around 75 m depth was observed, which promoted the transition from mechanical free digging to the use of blasting to 'loosen' these lower marls prior to excavation.
Thus, along with an improved definition of the lithological variability of the Palaeozoic, the aim of further pit characterization was to improve knowledge of this marl sub-stratum. The additional information obtained indicated a small, but significant, increase in resistance parameters that were initially fed into a more refined SLIDE limit state analysis to justify increases in pit angles in those marls (from 28° to 31°). The same characterization information was also used subsequently in a three-dimensional finite difference tenso-deformational model which simultaneously incorporated the hydromechanical coupling for final pit geometrical configuration.
This evolution also had a basis in observations of reasonable behaviour of the slopes generally over a number of years, particularly at depth, which including the deformation results of the pit monitoring described in the previous section.
Using FLAC3D, attempts were made to model the hydrological complexities introduced by the pit decompression, low permeability of the overlying marls, and the use of a system of water extraction and reinjection put in place to obtain a drawdown on the water table, improving overall stability and minimizing environmental effects.
This section describes key phases in the evolution of the pit design.
First design refinement (2007)
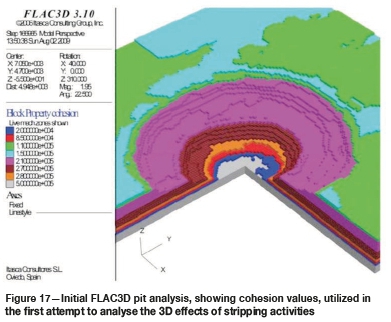
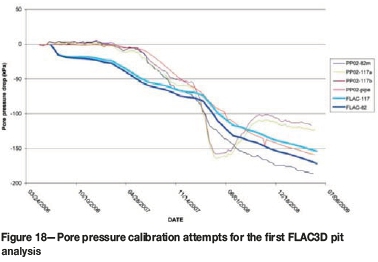
During 2007 the first detailed hydromechanical calibration in 3D of the pore pressure after completion of the pre-stripping of the marls was undertaken. The result of this work was described in Galera et al. (2009a). Figure 17 shows the cohesion values utilized in the block model in this first iteration of mine excavation (highlighting just the circular phase 1 and 2 condition). Figure 18 shows the results of the pore pressure comparison for some of the piezometers that had been installed at that early stage and which were indicating a reduction in pore pressure due to the decompression and aforementioned drainage system.
Key points of 2007 design stage
> Axisymmetrical FLAC3D analysis utilized to match pore pressures in design with those observed in vibrating-wire piezometers during the initial phases of stripping (pore pressure calibration process)
> Modelling of pressure drawdowns induced by the ring of perimetral drainage wells that formed part of the drainage and reinjection system (SDR)
> Incorporation in pit design of pore pressure drops due to a volumetric expansion associated with the excavation of the pit, achieved by the use of hydromechanical coupling to model the reaction of the soil/water mass as the principal stress rotated during pit excavation and slope formation.
A paper on that analysis (Galera et al. 2009b) highlighted that coupling of hydrogeological and mechanical behaviour indeed provides a rationale to incorporate piezometers as part of the pit monitoring system. In addition, the authors suggested the possibility of applying the same technique not just to soil slopes, but also to hard rock slopes with high permeability values, although clearly hydrologic recharge would set a limit to this aspect. Further work was recommended at other mine sites in this respect.
In general, this first work in FLAC3D was undertaken early in the mine life with less data build-up prior to the analysis. The determination of global safety factors in FLAC3D is also achieved via the summation of a series of local safety factors on each block (strength reduction factors). This process in itself can be subjective as appropriate slip planes need to be established for the summation process. Thus, the objective at that early stage was not to steepen slope angles, but rather confirm, via an alternative evaluation process, the angles approved previously by the more traditional limit state analysis methodology.
Globalpit optimization (2012)
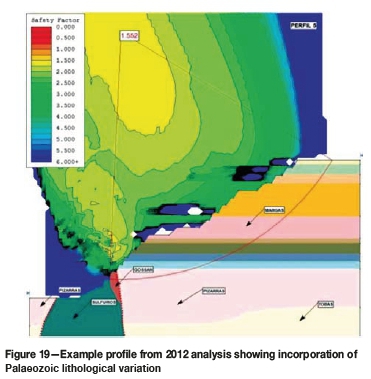
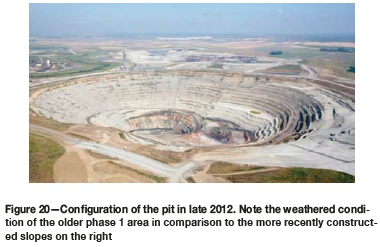
In 2012, during an operational optimization of the pit for resource model modifications, ongoing geological drilling was further complemented with geotechnical drilling and an associated refinement of the geotechnical pit model. Figure 19 shows the re-analysis of the pit slope stability undertaken using 2D limit state methods, while Figure 20 shows the aspect of the pit at the end of 2012.
Substantial refinements were made in the following areas.
> Marls-Desktop studies of excavations in the marls in the region (incorporating observations at an adjacent marl quarry operation) indicated that a relatively homogeneous and isotropic marl packet could be expected, and this was corroborated with regional information supplied by the Spanish Geological Institute. Early analysis incorporated those generic assumptions and focused on large-scale mass failure mechanisms. However, during the initial stripping operations, geotechnical mapping and a number of localized failures clearly demonstrated that any large instability was likely to be significantly structurally dominated. Thus a series of modifications was considered necessary for the marls, consisting of:
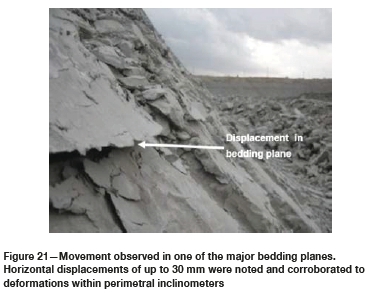
• I ncorporation of bedding planes and subvertical structures observed in geotechnical mapping of slopes during seven years of excavation (Figures 21 and 22). Minor movements had been observed in bedding planes by inclinometer monitoring. Distortions in the range of 100 mm to 200 mm (total cumulative movement) were typical, with decompression velocities of 0.1 to 0.3 mm/d observed in newly opened excavation zones. Although few instabilities were associated with these bedding planes at that stage, it was evident that these structures, along with other subvertical (apparently tectonically induced) joint sets, could play a pivotal role in future stability, and thus required consideration in design refinement. Analysis of bedding-plane displacements observed in inclinometers was therefore included in the global analysis (Cooper et al., 2011).
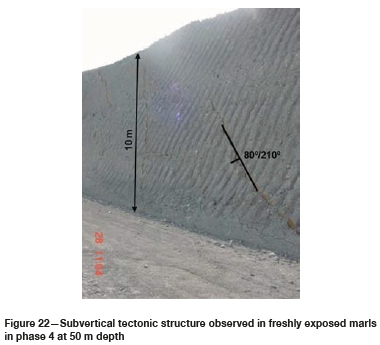
These bedding planes in marls were observable both implicitly via movement within inclinometers and explicitly following geological mapping of the slopes. They were generally observed to be closed, with no significant fill material, and close to the horizontal (with dip direction around 3° towards the south). In general, bedding planes occurred every 5 m to 6 m, some of which represent transition interfaces between the distinct marl bands
• Acknowledgement in design of a significant transition in geotechnical resistance parameters between the upper and lower marls (with a transition zone at around 80 m depth in Blue Marls LEVEL 1 to LEVEL 2). This transition, which was observed in laboratory testing and was also confirmed in the field, marked the depth at which blasting of the marls for excavation purposes became economically viable
• Modification of the resistive strength parameters (cohesion and friction angle, correlated with depth) for the lower marls. This implied a re-analysis of all information, incorporating additionally bulk samples that were less disturbed, with reduced scatter in the test results.
The incorporation of these three concepts led to a better understanding of a number of bench and multi-bench failures that had occurred nearer to the crest of the pit, as well as the recommendation to increase slope angle at depths between 80 m and 140 m from 28° to 31°.
> Palaeozoic-Improved analysis process on the Palaeozoic, which was assumed initially to be relatively intact and competent, included:
• I ncorporation of geotechnical mapping. Mapping of the pit slopes had been conducted bench-by-bench since stripping commenced and represented a significant and useful information database
• Specific analysis of problematic footwall shales. This analysis was predominantly kinematic to determine the likely severity and scale of planer instabilities
• Variation in slope angle recommendations depending on lithology and favourability/unfavourability of tectonic structures. Previous universal 45° slope recommendations became litho-specific and varied between 32° and 51°, depending on the above factors.
Further developments up to 2015
Information from the 2012 pit optimization was incorporated into a FLAC3D analysis of the pit in order to ensure that modifications, newly proposed in 2014, did not adversely affect pit slope stability. These modifications consisted of:
> Minor changes to the geometric configuration of the dumps near the northern perimeter of the pit
> Geometric modifications of the pit required for ore extraction near problematic footwall shales in the southern areas of the pit.
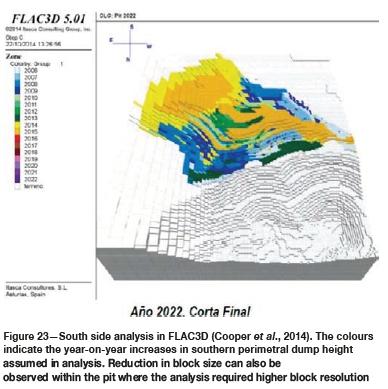
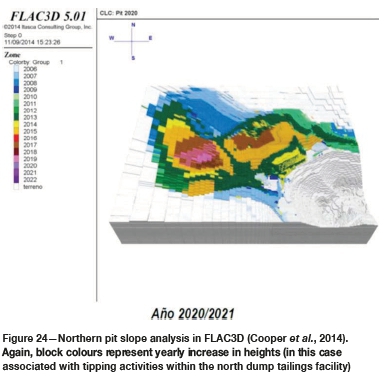
Figures 23 and 24 show the configuration of the block model for the FLAC3D analysis of the north and south pit areas.
Key elements of the design were:
> Alignment of coordinate system with the geological block model for future data re-incorporation
> Division of analysis into distinct zones (southern and northern aspects) to reduce demand on processing power and speed up the analysis
> Reduction of analysis block size with 10 m χ 10 m blocks in the pit. Enlargement of block size with distance from pit. This block size corresponds better to the individual bench sizes, allowing an evaluation of individual bench/berm stability. This block size was considered a sensible medium, given that the alternative, a 5 m χ 5 m, block size, would have required greater computer processing power and longer time
> Remapping of piezometric data up to 2014 to improve hydromechanical coupling calibration
> Analysis of individual phases of the pit within FLAC3D to arrive at final pit configuration.
Given the amount of work undertaken between the recharacterization and optimization process and the subsequent FLAC3D analysis, a method was needed for effectively communicating these changes to the mining team for ease of practical adoption during mine development. This was achieved with the mine operations visualization software VULCAN, enabling easy visualization of the various distinct geotechnical zones. Figures 25 and 26 show screenshots of the information placed in VULCAN, with two key aspects highlighted:
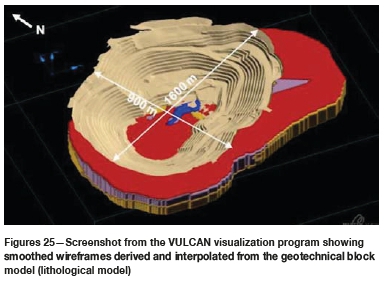
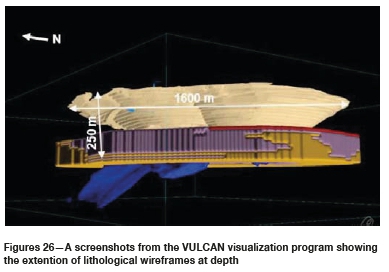
> Block modelling containing lithology and rock quality rating. The incorporation of both lithotype and rock quality rating (the Bieniawski RMR rock classification system) was considered useful for planning purposes when undertaking proposed pit configuration modifications
> Refinement of the 10 m χ 10 m grid to 5 m χ 5 m sub-blocks utilizing VULCAN interpolation software subroutines. The use of the interpolation tools built into the VULCAN software allowed an effective increase in resolution of the available information, which again was useful for pit configuration modification, given the use of 10 m benches.
Excavation optimization
During the various stages of excavation, operational activities were optimized in an attempt to best preserve the slope conditions. Highlighted among these are:
> A reduction in bench height from 20 m to 10 m. This was implemented early in the mine life, after attempts to achieve stable 20 m bench heights, stipulated in design, resulted in berm loss. This swift action to reduce bench heights to 10 m immediately improved stability, especially in the initial, highly weathered and less competent upper marls. However, the improved stability needed to be balanced against an associated reduction in the safety berm widths
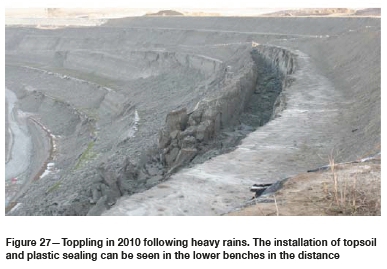
> Rendering the benches impermeable utilizing plastic and topsoil emplacement. Along with incorporation of a slight berm angle towards the pit in later years, this formed part of an effort to improve rainfall runoff from the benches and avoid this rainwater ingressing into the marls through fissures. Figure 27 shows an example of toppling which occurred on early slopes that were not rendered impermeable
> Improvement of blasting process, double benching in 5 m separate stages, significantly reducing the energy imparted to slopes
> Optimization of blasting patterns in the Palaeozoic, implementing a wall blast procedure with modified blast patterns to improve bench preservation and reduce slope rock fragmentation
> Slope smoothing and bench-to-bench knitting to reduce wall promontories (pit bullnoses) between phases.
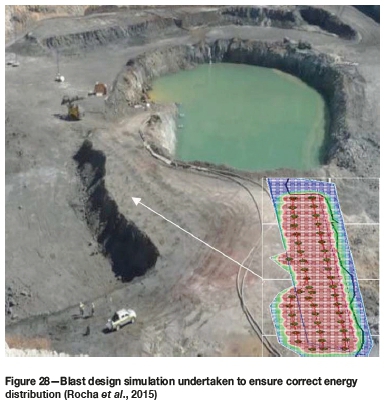
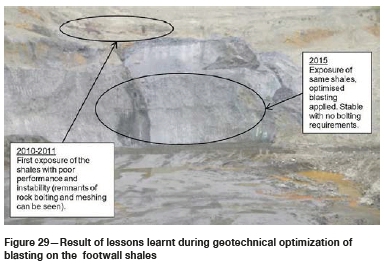
Figure 28 shows an analysis of the energy distribution of a test blast, while in Figure 29 the improvements in bench and slope preservation using the described optimization can be clearly seen.
Conclusions
There is no single solution to achieve stable slopes in an open pit mine such as Las Cruces. Although any activity can entail potential risks, the mine operates with an ALARA (As Low As Reasonably Achievable) risk policy and an objective of zero harm. In order to achieve this objective, over the years sturdier and more refined designs have been implemented to determine where the predominant risks in the mine lie and to what extent. Aside from minor instabilities observed over the years (typically wedge failures associated with localized geological structures), we have provided two examples of instabilities observed during mining that necessitated further work (toppling in the upper marls and planar failures in the footwall shales). Once higher risk areas had been identified, critical vigilance systems were subsequently put in place to manage the risk appropriately and on occasion, localized pushbacks prescribed in order to achieve a slope geometry more appropriate to the ground conditions. In some circumstances, ore extraction has only been possible with heightened local analysis, instrumentation, and vigilance.
In addition, in the case of Las Cruces, early mine development occurred during a period where significant technical advances were being made in monitoring systems - in particular the development of direct slope scanning topographical systems, 3D photography as a cartography aid, and even more recently, the incorporation of high-definition (4K) drone photography, which facilitates visual evaluations of large pits. If the mine had commenced in 2015 rather than 2005, it is likely that most of these systems would have been used from the outset rather than as part of a continuous improvement methodology.
Nonetheless, is it not always possible economically, nor appropriate technically, to implement all vigilance measures at the start of mining operations. Any pit design and vigilance plan needs to develop hand-in-hand with the mine's evolution, increasing in its refinement in preparation for the mine's most precarious stages (usually, but not always when the mine is at its deepest configuration) and finally winding down, changing from new investment to ongoing maintenance later in the mine life, when closure and restoration beckons.
References
Alonso, E.E. and Gens, A. 2006. Aznalcóllar dam failure, part 1: field observations and material properties. Géotechnique, vol. 56, no. 3. pp. 165-183. [ Links ]
Burland, J.B. 1989. Small is beautiful -The stiffness of soils at small strains. Canadian Geotechnical Journal, vol. 26. pp. 499-516. [ Links ]
Chandler, R.J., Leroueil, S., and Trenter, N.A. 1990. Engineering in Mercia Mudstone. Report C570. CIRIA. London. [ Links ]
Cooper, S., Pérez, C., Vega, L., Galera, J.M., and Pozo, V. 2011. The role of bedding planes on the slope stability in Cobre Las Cruces open pit. Proceedings of the International Symposium on Slope Stability in Open Pit Mining and Civil Engineering, Vancouver, Canada, 18-21 September 2011. Eberhardt, E. and Stead, D. (eds). Canadian Rock Mechanics Association. [ Links ]
Cooper, S., Rodríguez M.D., Pozo, V., and Galera J.M. 2014. Advanced 3D geotechnical modeling of Las Cruces Open pit.. Proceedings of the 2013ISRM European Rock Mechanics Symposium (EUROCK2014), Vigo, Spain, 27-29 May 2014. International Society for Rock Mechanics and Rock Engineering, Lisbon, Portugal. [ Links ]
Dindarloo, S.R. 2015. Peak particle velocity prediction using support vector machines: a surface blasting case study. Journal of the Southern African Institute of Mining and Metallurgy, vol.115. pp. 637-643. [ Links ]
Galera, J.M., Álvarez, M., and Bieniawski, Z.T. 2006. Evaluation of the deformation modulus of rock mass using RMR. Comparison with dilatometer tests. Proceedings of the ISRM Workshop W1, Underground Works under Special Conditions. International Society for Rock Mechanics and Rock Engineering, Lisbon, Portigal. pp. 71-77. [ Links ]
Galera, J.M., Montero, J., Pérez, C., Vega, L., and Varona, P. 2009a. Coupled hydromechanical analysis of Cobre Las Cruces Open Pit. Proceedings of the International Symposium on Slope Stability in Open Pit Mining and Civil Engineering, Santiago, Chile. Gecamin Ltda. http://subterra-ing.com/wp-content/uploads/2012/10/2009.-Coupled-hydromechanical-analysis-of-Cobre-Las-Cruces-Open-Pit.pdf [ Links ]
Galera, J.M, Checa, M., Pérez, and C., and Pozo, V. 2009b. Enhanced characterization of a soft marl formation using in situ and lab tests, for the prestripping phase of Cobre Las Cruces open pit mine. Proceedings of the International Symposium on Slope Stability in Open Pit Mining and Civil Engineering, Santiago, Chile. Gecamin Ltda. http://subterra-ing.com/wp-content/uploads/2012/10/2009.-Characterization-of-soft-marl-formation-using-in-situ-lab-test-Cobre-las-Cruces-pit-mine.pdf [ Links ]
Gens, A. and Alonso, E.E. 2006. Aznalcóllar dam failure. Part 2: Stability conditions and failure. Géotechnique, vol. 56, no. 3. pp. 185-201. [ Links ]
Gens, A. and Alonso, E.E. 2006. Aznalcóllar dam failure. Part 3: Dynamics of the motion. Géotechnique, vol. 56, no. 3. pp. 203-210. [ Links ]
Hoek, E. and Karzulovic, A. 2000. Rock mass properties for surface mines. Slope Stability in Surface Mining. Hustralid, W.A., McCarter, M.K., and van Zyl, D.J.A. (eds.). Society for Mining, Metallurgy and Exploration, Littleton, CO. pp. 59-70. [ Links ]
Hoek, E., Carranza-Torres, C., and Corkum, B. 2002. Hoek-Brown failure criterion - 2002 edition. Proceedings of the Fifth North American Rock Mechanics Symposium, Toronto, Canada. Vol. 1. American Rock Mechanics Association, Alexandria, VA. pp. 267-73. [ Links ]
Hoek, E. and Diederichs, M.S. 2006. Empirical estimation of rock mass modulus. International Journal of Rock Mechanics & Mining Sciences, vol. 43. pp. 203-215. [ Links ]
Hoek, E. 2012. Blast Damage Factor D. Technical note. RocNews, 2 February 2012. Winter 2012. [ Links ]
Kalamaras, G.S and Bieniawski, Z.T. 1995. A rock mass strength concept incorporating the effect of time. Proceedings of 8th ISRM Congress, Tokyo. Japan, 25-29 September 1995. Balkema. pp. 295-302. [ Links ]
Rocha, M., Carrasco, I., Castilla, J., Cooper, S., and Rodríguez, M.D. 2012. Wall control by blasting optimization at Las Cruces open pit copper mine (Spain). FRAGBLAST 10. Proceedings of the 10th International Symposium on Rock Fragmentation by Blasting. New Delhi, India, 26-29 November, 2012. Sing, P.K. and Sinha, A. (eds). CRC Press, Leiden, The Netherlands. pp. 715-724. [ Links ]
Shen, J., Karakus, M., and Xu, C. 2013. Chart-based slope stability assessment using the Generalized Hoek-Brown criterion. International Journal of Rock Mechanics and Mining Sciences, vol. 64. pp. 210-219. [ Links ]
Skempton, A.W. 1954. The pore pressure coefficients A and B. Géotechnique, vol. 4, no. 4. pp. 143-147. [ Links ]
Sönmez, H. and Ulusay, R. 2002. Discussion on the Hoek-Brown failure criterion and suggested modifications to the criterion verified by slope stability case studies. Bulletin of Earth Sciences. Application and Research Centre of Hacettepe University. Yerbilimleri. vol. 26. pp. 77-99. [ Links ]
Spain. 2002. Royal Decree 997/2002, Norma de Construction Sismorresistente: Parte General y de Edificación (NCSE-02). Ministerio de Fomento. (Spanish Seismic Legislation). 27 September 2002. [ Links ]
Spain. 1985. Royal Decree 863/1985. Reglamento General de Normas Básicas de Seguridad Minera. (Boletín oficial del estado, número 140, de 12- 06- 1985). (Spanish Mining Legislation). 2 April 1985. [ Links ]
Terzaghi, Κ. and Peck, R.B. 1948. Soil Mechanics in Engineering Practice. Wiley, New York. [ Links ]
Tsige, M. 1999. Microfábrica y mineralogía de las arcillas azules del Guadalquivir y su relación con las propiedades geotécnicas. Monografia 67. Ministerio de Fomento, CEDEX, Madrid, Spain. [ Links ]
 Correspondence:
S. Cooper
stephen.cooper@fqml.com
Received: 13 Sep. 2018
Revised: 17 Jan. 2019
Accepted: 15 Feb. 2019
Published: July 2019

