


Services on Demand
Article
 English (pdf)
 Article in xml format
 Article references
Indicators

Related links
-
 Cited by Google
 -
 Similars in Google
Share

 Permalink
Journal of the Southern African Institute of Mining and Metallurgy
On-line version ISSN 2411-9717
Print version ISSN 2225-6253
J. S. Afr. Inst. Min. Metall. vol.119 n.4 Johannesburg Apr. 2019
http://dx.doi.org/10.17159/2411-9717/588/2019
GEOMETALLURGICAL EDITION
Embracing step-changes in geoscientific information for effective implementation of geometallurgy
R. Lechuti-TlhalerwaI; S. CowardII; M. FieldIII
IDebswana, Botswana
IIInterlaced, Australia
IIIWood Group, United Kingdom
This paper was first presentedat the Furnace Tapping 2018 Conference, 15–16 October 2018, Nombolo Mdhluli Conference Centre, Kruger National Park, South Africa.
SYNOPSIS
Geometallurgy aims to improve mining project value by predicting the impact that ore and waste characteristics will have on mining and metallurgical processes. This requires integration of rich spatial models of orebody characteristics with validated process response models. These models have, until recently, been constrained by the spatial coverage and representativity of relevant data and the ability to validate predictions made.
The revolution in the diversity and volume of data and computational power that is now becoming available for integrated geoscientific modelling of orebodies, and stochastic simulation of mining and mineral processes is accelerating. By embracing emergent integrated data analysis and simulation techniques, geoscientists and engineers can lead a transformation in the way the mining value chain, from orebody to recovery, can be conceived, evaluated, and operated by using the geometallurgical paradigm.
This paper describes a methodology that is applied to an existing diamond operation. Analysis of spatial and process data is used to build an integrated geometallurgical value chain model (IGVCM). This IGVCM is used to generate geometallurgical options and evaluate their potential outcomes. The model facilitates the use of flexible, highly configurable, and potentially automated intelligent approaches to evaluate mining and mineral process configuration, and results in more robust design outcomes. The approach described here, and its successful implementation has potential to deliver step-changes in value.
Keywords: geometallurgy, value chain model, kimberlite processing, ore characteristics, process response.
Introduction
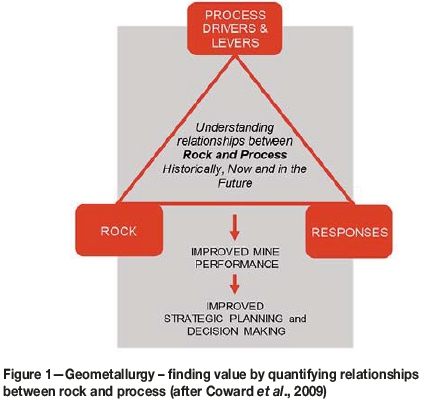
Geometallurgy aims to identify treatability risks - and opportunities - that arise from the interaction of orebody characteristics with mining and treatment. Improved understanding of the rock/process relationships allows project planners and production teams to predict performance, identify potential shortfalls, and thus enable the proactive creation and evaluation of strategies to mitigate these risks. These advanced insights also create opportunities for continually improving operational performance through dynamically adapting and improving the process response to the changing properties of the ore (Figure 1).
The geometallurgical approach to mine optimization aims to improve the operations through a better understanding of the interaction of orebody characteristics with process responses. The value-add from a strategic perspective is the use of this understanding to test and select the most robust mine configuration and improve understanding of the outcomes of high-value irreversible decisions (e.g. plant expansion, downsizing, changing mine design, overall design, and operational policy). Strategic use of a geometallurgical framework will increase the probability of making better design and configuration decisions and should result in robust returns, i.e. improving stability of financial return in the face of increasingly uncertain futures.
There is also material value-add in the implementation and use of the geometallurgical approach in a tactical framework, for both risk mitigation and operational execution improvement (Wambeke and Benndorf, 2017). This requires the development of several capabilities within the mining organization. These capabilities include the ability to spatially sample and then model the rock characteristics that drive process responses, development of suitable interfaces so that mine planning processes can use these in mine design, and process simulations that respond to the mining inputs to generate predictions of process performance and ore treatability. It is also important to develop a motivated and skilled team that will persistently drive the principles until they become embedded as a way of doing business in the operations. This is a critical success factor.
The traditional approach to development of geometallurgical models requires sufficient spatial sampling for ore characteristics that drive process behaviour. These characteristics can be spatially estimated or simulated into a block model. The estimated (or simulated) characteristics of the blocks that are to be mined in each period are used in a dynamic process model (process in the broad sense, including both mining and metallurgical processes) in which the process parameters can be varied in accordance with operational policies and procedures. The virtual models of the process and simulated outcomes can be used to quantify perceived risks, proactively test mitigation strategies, and design plans to benefit from opportunities that are identified or created (e.g. choose the best process parameters, reiterate the mine plan, deploy more efficient technology, sample optimization).
Developing the primary response framework for geometallurgy
In an ideal scenario (Ackoff, 1978), the geometallurgical team would be able to readily answer the following questions:
> Which response variables in the mining and treatment processes do we want to model and predict?
> What primary variables drive the response variables, and how must these be measured in the orebody, and at what scale?
> Once we have sampled and measured these variables, how do we estimate their values at unsampled locations?
> Once we have these spatial estimates, how do we build models and simulations that can be used to predict the response variables we want to improve?
Selection of response variables and their geological drivers
The search for the answers to these questions requires an iterative approach to dynamically explore what is desired and what is practically possible. This requires ongoing engagement in a process that requires input from geoscientists and engineers across the structured disciplines that typically characterize the configuration of mining projects and operations. A useful structured approach to the implementation of geometallurgy is provided in Vann et al. (2011). This paper addresses what would be considered the transition of geometallurgical capabilities from testing and building models into the use of these models in operational and strategic work flows.
For existing operations, the identification and selection of response variables precedes the design of sampling. This allows the operation to engage in the process and drive the gathering of operating data. Through analysis of performance it is possible to identify which rock characteristics are associated with selected process over- or underperformance. Once the associations have been identified, more experimentation is required to demonstrate causality. This investigation requires analysis of historical data on rock mixes and associated process performance. The characteristics of rock types that shift process performance away from a perceived stable state are tagged and the characteristics of each lithotype are then investigated (e.g., hard or soft ore).
In this process, the analytical geometallurgists will use systems analysis approaches as described by Demming (1986). The availability and use of advanced statistical process control tools in this type of analysis is becoming far more prevalent and hence allows for more meaningful use of historical data.
Design and execution of rock characteristics sampling
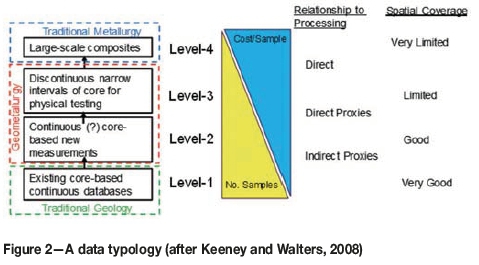
Tools and methods used in the descriptive and interpretative process of geological modelling have improved because of the ongoing focus on geometallurgy. The underlying concept of optimizing the sample layout by using a few high-cost samples and then building a calibrated framework to lower cost methods that can increase spatial coverage has been explored by several authors (Esbensen, 1987; Keeney, 2010). The classification, description, and characterization of kimberlite rocks have also improved.
These conceptual frameworks have resulted in improved sample experiment design and increased the number of samples and the metadata that are collected for geometallurgical modelling. The typology is relatively simple and provides a useful framework for interdisciplinary communication. It can be used to develop a programme that aims to achieve a balance between the high cost per sample and low coverage of level 4 data with the lower cost per sample and higher coverage that is associated with collection of level 1 data (Figure 2). This type of trade-off is required for each deposit as the best combinations of number of samples, sample support, and tests carried out. The resulting design will differ between mines, deposits, and lithologies and will require adapting to the level of maturity of the project.
Building spatial models of rock characteristics
To build rich multivariate models of the orebody, optimal use of data generated from a range of samples to predict process responses is required. These models can be used to drive an integrated value-chain model. Linear spatial interpolation estimation techniques, such as linear kriging, can be used to generate minimum error variance, unbiased spatial models of orebody characteristics (Armstrong, 1998). These methods yield estimated values that have less variability than the corresponding actual values. Spatial simulation techniques, such as sequential Gaussian simulation (Dowd and Dare-Bryan, 2007), multivariate co-simulation (Verly, 1993; Boucher and Dimitrakopoulos, 2009; Rondon 2012), and multi-point geostatistics (Ortiz and Deutsch, 2004) can be used to generate spatial models of rock characteristic variables that have a more realistic block-to-block variability.
The primary response framework suggests that primary variables may in some cases exhibit easy-to-model characteristics, whereas response variables often do not. The response variables are often nonlinear functions of a variety of process inputs and may therefore have non-additive properties. Defining domains for these variables can at times be difficult, though recent research has developed ways to address this concern (Sepulveda et al., 2017).
Developing an integrated value chain model
When an operation has access to an estimated block model of both ore and waste it is possible to overlay a mining plan and generate a rock stream that can be fed to a process simulator to predict process performance. Each of the key processes is modelled using a simplified transfer function to determine the impact that the range of rock characteristics will have on the unit process (Wolf, 2012).
The integrated approach, previously described by Jackson et al. (2014), uses block-scale models of the orebody containing both estimated and simulated characteristics. These models are linked to a mining and treatment model. The outputs from the production model are tied to a financial model that facilitates the translation of production outcomes in financial terms.
The benefits of the integrated model are that it can be used to link seemingly different areas of the businesses value chain in a way that reflects the true system constraints and the way in which they interact with variability that originates in the orebody. This approach facilitates an understanding of the system and provides a quantitative evaluation of the impact of variances on the system by explicitly modelling their interaction with real-world constraints (Deming, 1986).
Central to this approach is the integration of complex empirical processing models for e.g. crushing (Whitten, 1972), and hydrocyclone separation (Plitt, 1976) with observed process responses. The collection of data over a long period, in the order of five to ten years, enables valid correlations to be identified. These can be evaluated and with additional work, various hypotheses of causation can be tested and rejected or assumed to hold.
Implementation on an operating mine
Setting and methodology
The case review is based on a mine that treats kimberlite sourced from four different pipe-like bodies. The kimberlite comprises several different rock types, as kimberlite is characterized as being a heterogenous rock with a low diamond concentration.
The process plant employs a conventional diamond-winning process that includes crushing, scrubbing, dense media separation, and final recovery using a combination of magnetic and X-ray separation to produce a diamond-rich concentrate.
Although the mine has kept very good records of process performance and mine depletion, there is a complex stockpiling and blending circuit between the mine and the process plant, and the surge capacity both before and inside the processing plant is substantial. This meant that it was not possible to directly relate processed material properties back to in situ properties. This required the development of a method to understand the impact of various rock mixes on process performance, and then using this understanding to identify the primary in situ properties that were required to be spatially sampled and estimated.
Selection of response variables
The process was usefully divided into seven metallurgical response areas:
1. Mining, blasting, hauling
2. Stockpiling and blending
3. Comminution
4. Dense media separation
5. Undersize, materials handling. and water recovery
6. Magnetic separation
7. X-ray recovery
In consultation with the operation, the objectives of the operational areas were clarified and the rock properties that either hindered or assisted with production were recorded. Detailed monthly data for a period of 10 years was obtained to determine the range and variability of the performance of each of the sections.
Identifying rock characteristics that drive response behaviour
As described above, approximately 60% of treated material is fed to the plant via a stockpile and blending system. It is thus not possible to tie individual process responses back to a single domain or rock type. For each of the seven process response areas, periods where the performance was in the highest or lowest 5th percentile were identified. This was augmented with the use of various statistical process-control techniques (recursive partitioning, cumulative summation charts, v-charts, Manhattan plots etc.). The rock mixes that were fed during these periods were identified. The results of 30 rock mixes were then combined and analysed using multidimensional scaling to determine the main groups of rock characteristics that were driving process response. The impact of each of these was then tested by applying the rock mix characteristics in a simple linear model and identifying how well the model predicted actual performance.
Sampling and estimating rock characteristics
As this is a mature operation, several phases of sampling for so-called 'ore dressing studies' (ODS) have been carried out. This sampling has typically been aimed at defining long-term average characteristics, reminiscent of level 4 data. Recently, however, this sampling has been substantially augmented with various proxy measures. This data made it possible to identify approximately 15 rock characteristics that had been measured with sufficient spatial coverage to enable the use of geostatistical estimation. Several of these measured variables had indirect proxies that could be used to expand coverage in the estimate.
An example of this is the estimation of dense media separation yield. Level four sampling typically requires large (approx. 50 kg) samples for a full set of densimetric testing to determine the yield that is expected in the DMS for a given set of operating parameters. It was, however, found that the ore bulk density measures could be used with the full densimetric analysis to expand spatial coverage (Lechuti-Tlhalerwa, 2018).
An important addition to the estimated model was the inclusion of a 'quality indicator index' for each estimated variable. The index was based on several geostatistical estimation quality indicators (e.g. kriging variance, distance to nearest sample) and is similar to the processes used for informing the classification of resources and reserves. This index was used in the value chain model to give an indication of the quality of performance forecasts.
The process simulation model
The process model included the mining process, six main stockpiles, and a simplified main treatment plant flow. The distribution of types of material treated during the period under review is depicted in Figure 3.
The data from the mine planning and reconciliation system made it possible to track the material that is delivered to and removed from each stockpile. The properties in each stockpile were averaged every quarter, but the model can be configured in several ways to represent different blending and storage mechanisms (Robinson, 2011). The estimated block-scale rock characteristics delivered to the plant are depicted in Figure 4.
To replicate the flows through the comminution circuit, the material hardness characteristics (UCS, T10Ta) were used to determine the mass proportion of material that was sent to oversize, grits, and slimes. These characteristics were also used in a simple comminution and screening model (Whiten, 1972) to simulate the operation of the crushing section and predict the mass and size distribution of the feed to the DMS circuit.
The DMS dynamic model was configured to respond to the estimates of proportion of each density class in each size class for the ore block that is treated.
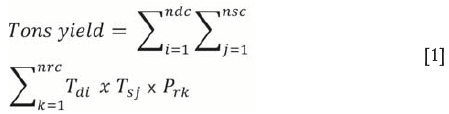
Equation [1] gives the formula used to calculate the mass of material that is expected to report to the sink fraction, where:
Tdi= Tons in density class n
Tsj= Tons in size class n
Prk= Tons recovery proportion of size/density class k.
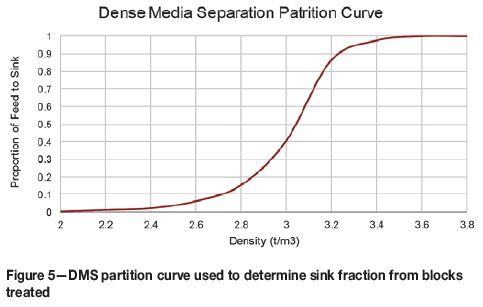
In the implementation, the proportion to sinks assumes a constant partition curve that incorporates a fraction of the less dense material that is the same for all periods. It would be possible in further iterations to include a rock type and cyclone configuration dependency in this model (Plitt, 1976). The specific partition curve used in this case is depicted in Figure 5. It would be possible to use historically recorded partition curves informed by regular tracer testing that has been carried out. Historical work has been conducted to develop and test several simulators, and the data and models developed during these prior programmes could be readily used to develop more robust models in this case.
Value chain model results
At this early stage, the correspondence between the outputs of the model and the recorded historical data is encouraging. The proportion of material that reports to the DMS is depicted in Figure 6.
The DMS partition model is applied at block scale and the results of the derived DMS concentrate produced are depicted in Figure 7. Although the model underestimates yield in the first few years of the period reviewed, there is good correspondence in the later years.
This process response prediction is based on a relatively smoothed kriged estimate of characteristics based on a few sparse samples. This demonstration model shows that there is indeed sufficient information available to begin building spatial models of geometallurgical characteristics at block scale and that the block-scale estimates can be used in a process simulator to forecast, albeit with some degree of error, the full-scale process plant performance.
It is also evident when calibrating this model that the modes of operation before and after 2009 are markedly different. This suggests that not only should the model be able to reflect the operation of the plant while in a tonnage-constrained mode, but it should also include measures that reflect the changes in efficiency that are achieved (or not) when the plant is run at a lower throughput and hence is responding to different sets of constraints.
Discussion and interpretation
The geometallurgical modelling process (variable selection, spatial modelling, and process simulation) has shown that it is possible to predict the future performance of the selected unit processes based on models developed from a historical analysis of the relationships between characteristics of the kimberlite that was treated and observed process response.
The next phase of this project aims to use the mine plan for the next 5-10 years with the existing geometallurgical model to predict the average, or estimated, rock characteristics that will be treated by the plant, and its resulting performance. This process will identify which periods will require either changes to the plan or adaption in the process plant to achieve the desired targets.
A second, more challenging but potentially more rewarding, focus is the inclusion of spatial simulations of the orebody characteristics to enable a range analysis to be undertaken. This will provide the mine with a method to understand the impact of extremes in the rock characteristics on overall process performance and quantify the downside and upside of the chosen plan and process configuration.
The feedback loop analysis suggests that as the collection of data of the processed properties improves, so will the models, and hence the ability to move up the 'geomet curve' (Vann et al., 2011) to the next phase, which will see the embedding of the geometallurgical model in mine planning and operational optimization.
Conclusion
The structure and approach to data collection, storage, and interrogation is adapting rapidly (e.g., Internet of Things, Industry Four, Cloud Processing Arbitrage). The three main driving forces are:
1. The development of cheaper, faster, more 'intelligent' sensors with improved granularity that can pre-process data
2. Vast increases in machine and sensor connectivity and networking
3. Ongoing increases in processing speed, and ease of access to transient computing power with a parallel reduction in processing cost.
The implications for geometallurgy are profound. At a strategic level there needs to be focus placed on improving the use of rich, quantitative orebody models, and integration of the approach into the business operating framework. At a tactical level, this urges operations to embrace technically advanced predictive models in both short-term and longer-term capital rationing decision-making (Dowd, 2016).
One way to improve the use of richer geometallurgical models requires an integrated evaluation of the entire value chain design to incorporate explicitly the impact of orebody characteristics across the mining project. Such a platform provides the basis for empirically testing design and operating decisions. This allows project teams to assign financial benefit to increasing geometallurgical insight and to extract additional value from mining projects. The simplest approach is to use spatial models of primary variables that can be converted through transfer functions to process responses, as demonstrated here. Deriving these functions requires simplification of process simulations that emulate the dynamics of inter-block interactions and system interdependencies.
A broad view of geometallurgy suggests that an improved quantitative understanding of the relationships between rock characteristics and the performance of processes used to mine and treat the ore should lead to mining projects that are more successful. The benefits potentially include a more robust return to all stakeholders for a longer period, with mining projects demonstrating resilience in the face of ubiquitous, rapidly changing operating environments.
References
Ackoff, R.L. and Ackoff, K.B. 1978. The Art of Problem Solving Accompanied by Ackoffs Fables. 2nd edn. Wiley, New York. [ Links ]
Armstrong, M. and Myers, D.E. 1998. Basic Linear Geostatistics, Technometrics. doi: 10.2307/1270968 [ Links ]
Boucher, A. and Dimitrakopoulos, R. 2009. Block simulation of multiple correlated variables. Mathematical Geosciences, vol. 41, no. 2. pp. 215-237. doi: 10.1007/s11004-008-9178-0 [ Links ]
Coward, S., Vann, J., Dunham, S., and Stewart, M. 2009. The primary-response framework for geometallurgical variables. Proceedings of the 7th International Mining Geology Conference. Dominy, S. (ed.). Australasian Institute of Mining and Metalliurgy, Melbourne. pp. 109-114. [ Links ]
Deming, E. 1986. Out of the Crisis. MIT Press, Cambridge, Massachusetts. [ Links ]
Dowd, P.A. and Dare-Bryan, P.C. 2007. Planning, designing and optimising production using geostatistical simulation. Orebody Modelling and Strategic Mine Planning. 2nd edn. Dimitrakopoulos, R. (ed.). Spectrum Series 14. Australasian Institute of Mining and Metallurgy, Melbourne. pp. 363-377. https://wiww.scopus.com/inward/record.uri?eid=2-s2.0-58049141125&partnerID=40&md5=2901d5c3030cf9ca31dfb82051286163 [ Links ]
Dowd, P.A., Xu, C., and Coward, S. 2016. Strategic mine planning and design: Some challenges and strategies for addressing them. Transactions of the Institution of Mining and Metallurgy, Section A: Mining Technology, vol. 125, no. 1. pp. 22-34. [ Links ]
Esbensen, K., Lindqvist, L., Lundholm, I., Nisca, D., and Wold, S. 1987. Multivariate modelling of geochemical and geophysical exploration data. Chemometrics and Intelligent Laboratory Systems, vol. 2, no. 1-3. pp. 161-175. doi: 10.1016/0169-7439(87)80094-1 [ Links ]
Jackson, S., Vann, J.E., Coward, S., and Moayer, S. 2014. Scenario-based project evaluation - full mineral value chain stochastic simulation to evaluate development and operational alternatives. Proceedings of the Ninth International Mining Geology Conference, Adelaide, South Australia, 18-20 August 2014. Australasian Institute of Mining and Metalliurgy, Melbourne. pp. 18-20. [ Links ]
Keeney, L. 2010. The development of a novel method for integrating geometallurgical mapping and orebody modelling. Julius Kruttschnitt Mineral Research Centre, University of Queensland. [ Links ]
Lechuti-Tlhalerwa, R., Gilika, Ο., and Field, M. 2018. Modelling geometallurgical variability in Orapa kimberlite ore. Proceedings of Geometallurgy 2018. Southern African Institute of Mining and Metallurgy, Johannesburg. [ Links ]
Oakland, J.S. 2008. Statistical Process Control. Elsevier Butterworth-Heinemann. [ Links ]
Ortiz, J.M. and Deutsch, C.V. 2004. Indicator simulation accounting for multiple-point statistics. Mathematical Geology, vol. 36, no. 5. pp. 545-565. doi: 10.1023/B:MATG.0000037736.00489.b5 [ Links ]
Plitt, L.R. 1976. A mathematical model of the hydro-cyclone classifier. CIM Bulletin Mineral Processing, vol. 69 (December). pp. 114-123. [ Links ]
Robinson, G.K. 2011. Managing variation of bulk materials in stockpiles and mineral processing plants. Design and Selection of Bulk Material Handling Equipment and Systems: Mining, Mineral Processing, Port, Plant and Excavation Engineering. Bhattacharya, J. (ed.). Wide Publishing, Kolkata, India. pp. 365-413. [ Links ]
Rondon, O. 2012. Teaching aid: minimum/maximum autocorrelation factors for joint simulation of attributes. Mathematical Geosciences, vol. 44, no. 4. pp. 469-504. [ Links ]
Sepulveda, E., Dowd, P.A., Xu, C., and Addo, E. 2017. Multivariate modelling of geometallurgical variables by projection pursuit. Mathematical Geosciences, vol. 49, no. 1. pp. 121-143. doi: 10.1007/s11004-016-9660-z [ Links ]
Vann, J., Jackson, J., Coward, S.J., and Dunham, S. 2011. The geomet curve - a model for implementation of geometallurgy. Proceedings of the First AusIMM International Geometallurgy Conference (GeoMet2011), Brisbane. Australasian Institute of Mining and Metalliurgy, Melbourne. pp. 35-43. [ Links ]
Verly, G.W. 1993. Sequential Gaussian co-simulation: a simulation method integrating several types of information. Proceedings of Geostatistics Tróia 'P2. Vol 5. Quantitative Geology and Geostatistics. Soares A. (ed.). Springer, Dordrecht. pp. 543-554. https://doi.org/10.1007/978-94-011-1739-5_42 [ Links ]
Wambeke, T. and Benndorf, J. 2017. A simulation-based geostatistical approach to real-time reconciliation of the grade control model. Mathematical Geosciences, vol. 49, no. 1. pp. 1-37. doi: 10.1007/s11004-016-9658-6 [ Links ]
Whiten, W.J. 1972. The simulation of crushing plants with models developed using multiple spline regression. Proceedings of the Tenth International Symposium on the Application of Computer Methods in the Minerals Industry, Johannesburg, 10-14th April 1972. Southern African Institute of Mining and Metallurgy, Johannesburg. pp. 257-264. [ Links ]
 Correspondence:
S. Coward
stephen.coward@interlacedconsulting.com
Received: 15 Jan. 2019
Revised: 12 Mar. 2019
Accepted: 12 Mar. 2019
Published: April 2019

