


Serviços Personalizados
Artigo
 Inglês (pdf)
 Artigo em XML
 Referências do artigo
Indicadores

Links relacionados
-
 Citado por Google
 -
 Similares em Google
Compartilhar

 Permalink
Journal of the Southern African Institute of Mining and Metallurgy
versão On-line ISSN 2411-9717
versão impressa ISSN 2225-6253
J. S. Afr. Inst. Min. Metall. vol.118 no.11 Johannesburg Nov. 2018
http://dx.doi.org/10.17159/2411-9717/2018/v118n11a8
COPPER COBALT AFRICA
Empirical model of recovery response of copper sulphide circuit at Kansanshi Mine
M. LusamboI, II; F.K. MulengaIII
IKansanshi Mining Plc., First Quantum Minerals Limited, Zambia
IIDepartment of Civil and Chemical Engineering, University of South Africa, South Africa
IIIDepartment of Electrical and Mining Engineering, University of South Africa, South Africa
SYNOPSIS
Geometallurgical models are a strategic tool used primarily in planning, diagnosis, and process optimisation. This paper discusses the development of a predictive model for flotation recovery at Kansanshi concentrator in Zambia as a function of key operational parameters. Daily data for milling and flotation from the circuit processing the copper sulphide ore was analysed. This data, recorded over a period of one year of production, was collected from diverse sensors measuring semi-autogenous milling and flotation parameters. Statistical analysis showed that copper head grade, acid-insoluble, and acid-soluble copper, SAG mill throughput, ball mill load, and tonnage of feed material to the SAG mill in the -125 +63 mm size fraction contributed to the prediction power of the proposed empirical model by as much as 90%. Finally, a proposal was made for the development of a simulation model under MODSIM®, a flexible tool for mineral processing applications. This was to test the limitations of the empirical model for future refinement.
Keywords: sulphide flotation, empirical model, recovery response.
Introduction
Kansanshi is the largest copper mine in Africa and the world's eighth largest copper producer, with a total of 253 272 t of copper produced in 2016 (Newall, 2017). It is located approximately 10 km north of Solwezi, the capital and administrative headquarters of the North Western Province, Republic of Zambia. The ore deposit consists predominantly of chalcopyrite and malachite with variable amounts of chalcocite, bornite, chrysocolla, and azurite. Because of the varying proportions of sulphide and oxide copper minerals, the ore is classified into three distinct categories: sulphide, mixed, and oxide ores. As such, three separate processing circuits are used to mill the ore down to a standard targeted grind size of 80% passing 150 um before froth flotation and leaching.
A lot of research and development has been done to improve the performance of the sulphide ore circuit at Kansanshi. Despite the research efforts and subsequent operation, the sulphide ore circuit did not attain the target recovery and grade for 2016, primarily because of the complexity of the orebody.
The constant drive to achieve the set production target of recovery and concentration grade after froth flotation motivated the development of a tool for the prediction of recovery. The anticipated benefit is not only to enable the plant to apply corrective actions when needed, but also to make a tool available for the quick assessment of the plant performance of the. For that purpose, data spanning June 2016 to May 2017 was analysed, cleaned up and curve-fitted to an empirical model. In doing so, key parameters were determined and calibrated to represent the behaviour of the plant.
Kansanshi sulphide ore circuit
The Kansanshi process comprises three separate circuits for three distinct run-of-mine ore feeds: sulphide ore, mixed ores, and oxide ores. The three circuits run in parallel, with each consisting of a dedicated crushing, milling, and flotation circuit. The present research work focuses on the sulphide ore circuit.
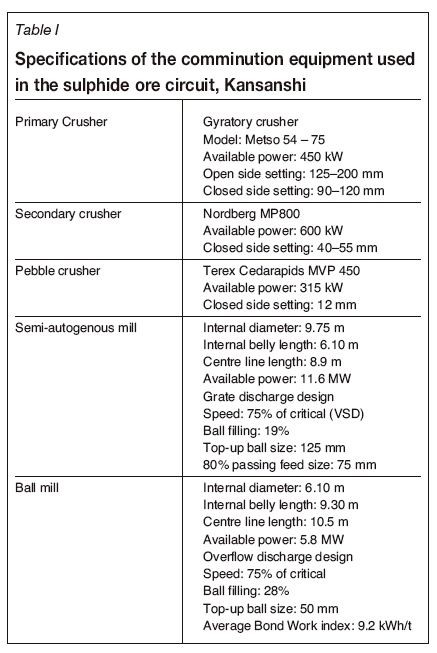
The sulphide ore circuit at the Kansanshi mine processed an average of 35 000 dry tons per day between 1 June 2016 and 31 May 2017. The run-of-mine sulphide ore undergoes a two-stage primary and secondary crushing in open circuit. The material is then sent to a classic semi-autogenous / Ball mill / Crusher circuit, also known as an SABC design. From a The product from the comminution section undergoes two stages of flotation roughing in 6 x 300 m3 cells, and cleaning in 8 x 30 m3 cells. Relevant specifications of the comminution equipment are listed in Table I.
Methodology
The primary objective of a processing plant is to produce good quality concentrates at the highest levels of recovery and throughput and at the lowest operation costs. The attainment of this objective depends on the quality of the ore feed, the geometry, configuration and operating conditions of all the processing units involved and, most importantly, an accurate knowledge and understanding of the circuit behaviour.
Concentrators generally yield a variable metallurgical recovery, to the extent that it has become common practice to model the behaviour of the concentrator as a function of key operating parameters. To do that, in-house databases can be used with the data comprising for example, historical operational performance data of the plant, planned surveys, geometallurgical data, and ore characteristics. The work by Compan, Pizarro, and Videla (2015) exemplifies this with a regression model proposed for the Chuquicamata plant which treats a copper sulphide ore by milling and flotation.
An attempt was made to produce an empirical model of the Kansanshi plant similar to that of the Chuquicamata plant. To this end, key input parameters were identified before the structure of the model was proposed. The data was pre-processed to enable curve-fitting by nonlinear regression. This was to determine the values of the parameters of the model and calibrate them to the Kansanshi operation.
Identification ofkey input parameters for model building
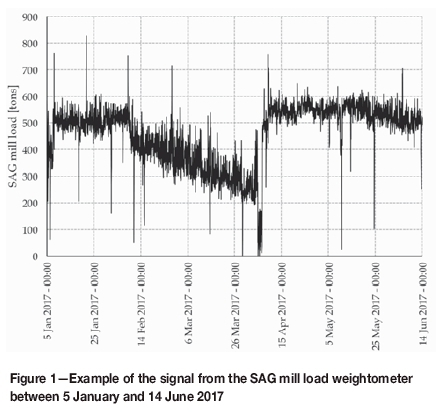
The Kanshanshi plant is fitted with a wide array of sensors for monitoring its general performance. For example, a camera-based system is used to measure the particle size distribution of the feed to the SAG mill, and weightometers are installed on the belt conveyors of all major units to supply mass flow data. Flow meters, densitometers, pressure readers, and level sensors are also used in the flotation section. On-stream analysers and laboratory analyses provide assays of key plant process streams for process control and metallurgical accounting purposes respectively. Figure 1 illustrates a typical signal from a weightometer measuring the SAG mill load.
Overall, 29 signals are collected from the SABC section and 49 signals comes from the flotation section. It became clear that, to produce a useful and flexible model of the plant, the number of input parameters should be cut down to a reasonable minimum.
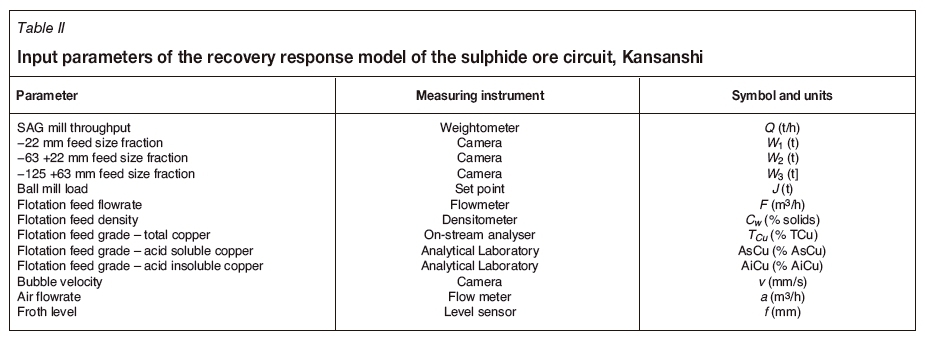
King (2012) described in a comprehensive manner the most important phenomenological models that can be used in the description of a wide variety of mineral processing units. These units include SAG mills, ball mills, hydrocyclones and flotation, which are all relevant to Kansanshi. A critical review of the models applicable to each unit reveals that, of the 78 signals streamed from the Kansanshi sulphide ore circuit, 13 may be used to model the performance of the plant with reasonable accuracy. These 13 parameters are listed in Table II.
By consulting King (2012), the choice of the key parameters above was also supported by the following references: Austin et al. (1984), Compan et al. (2015), Hu (2014), Klimpel (1995), Napier-Munn et al (1996); Pease et al. (2006) and Yahyaei et al. (2014).
Development ofan empirical model ofKansanshi sulphide ore circuit
The work by Compan, Pizarro, and Videla (2015) was selected to serve as the basis for the development of a regression model for use in determining the copper recovery of the Kansanshi sulphide ore circuit, since the Chuquicamata plant recovers sulphide copper minerals such as chalcocite and chalcopyrite, which are also found in the Kansanshi sulphide ore type. The following model was proposed for the Chuquicamata (Compan, Pizarro, and Videla 2015):
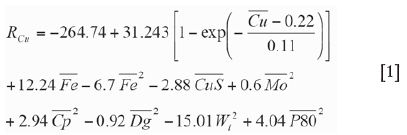
where RCu is the final copper recovery after flotation;  is the copper feed grade;
  and
and  are, respectively, the iron and copper sulphide feed grades to the plant;
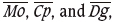 are the molybdenite, chalcopyrite, and digenite grades in the ore feed; and Wi and
  are the work index and product size of the ore after milling.
A look at Equation [1] shows that the majority of the input parameters in the Chuquicamata response function are grades of mineral species in the ore feed. The other parameters, including the work index Wiand product size  , are all physical properties of the ore. No parameter relating to operating conditions of milling and flotation is included, although the model should take into consideration these two processes. This can probably be ascribed to the fact that the parameters in Equation [1] are among those monitored on the plant.
The general problem with empirical models is that they are developed based on available information. This, in a sense, tempts one to overlook critical parameters in building the model; hence the limitationof these models. The advantages, however, of this type of model offers are primarily their simple structure, flexibility, and quick manipulation when estimates are needed, among others.
This brings us to discuss the structure of the empirical model of recovery response proposed for the Kansanshi copper sulphide ore circuit. The following equation was proposed for testing on the Kansanshi data at our disposal:
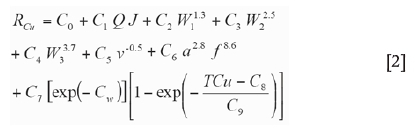
where C0 to C9 are the model coefficients that needed to be determined by the nonlinear regression of the Kansanshi data collected between June 2016 and May 2017. Thirty percent of this data was used in the calculation of the model coefficients, while the remaining 70% served to assess the predictive ability of the model proposed in Equation [2]. The outcome of this endeavour is presented in the next section.
Results and discussion
The results of the regression analysis are presented in this section. The adequacy of the model and that of the regressed coefficients are also discussed. A proposal is made for a simplified model based on the contribution of each parameter.
As a starting point, Equation [2] was curve-fitted against the copper recovery data in the least squares sense. Initial guesses were allocated to the coefficients C0 to C9 then the sum of squared differences between the theoretical and actual copper recovery values was calculated. A computer algorithm was finally involved to iteratively adjust the values of the coefficients until the sum of squared differences converged to a global minimum. Table III summarizes this result, with each coefficient value allocated its 95% confidence interval.
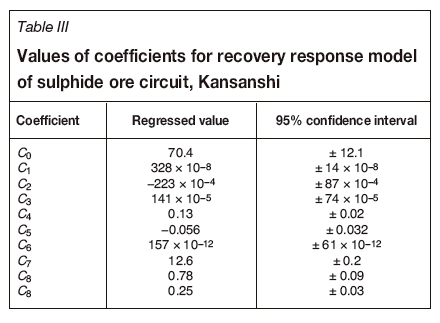
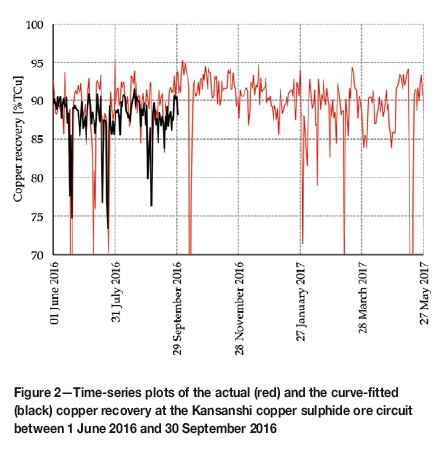
Figure 2 illustrates the results of the curve-fitting performed on the recovery data spanning June 2016 to September 2016. The theoretical and actual time-series curves are superimposed for the time duration. The coefficient of determination R2 of Equation [2] was calculated. This statistic was found to be R2= 0.557, meaning that 55.7 % of the data considered can be explained by Equation [2].
Based on the regressed coefficient values in Table III as well as their respective confidence intervals at a 95% significance level, it was decided to set the coefficients C2, C3, C5 and C6 at to zero. The decision to eliminate these coefficients was based primarily on their poor level of accuracy with respect to their average regressed values. By doing so, Equation [2] was simplified to the following form:
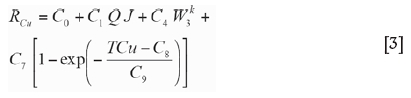
It should be noted in Equation [2] that input parameter Cw (flotation field density) is now absorbed into coefficient C7. This is because this particular parameter representing (see Table II) did not vary significantly over the year for which operation data was collected. Furthermore, for the sake of simplicity, the lower the number of input parameters, the better for the model. This, of course, needs to be balanced with an acceptable level of accuracy within the capabilities of the various measuring and monitoring instruments used at the plant. That is why a new exponent parameter k was introduced around parameter W3to add flexibility to the curve-fitting procedure.
With a simplified definition of the empirical model of recovery response of the Kansanshi copper sulphide circuit, a new regression analysis was initiated. This time, seven coefficients were regressed and their uncertainties still calculated at a significance level of 95%. The outputs from the curve-fitting algorithm are reported in Table IV.
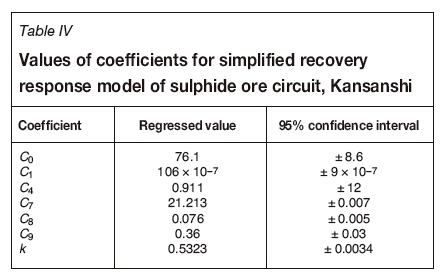
It will be noted that the parameters in Table IV are more accurately predicted than those in Table III based their errors at 95% significance level. In addition to this, when validated again the data from 1 October 2016 to 31 May 2017, a striking similarity is evident, as shown in Figure 3. To confirm this observation, the coefficient of determination R2 of Equation [3] was calculated. This statistic was found to be R2 = 0.694, indicating that 69.4% of the data considered can be explained by Equation [3]. Compared with Equation [2] (coefficient of determination R2 = 0.557) it is clear that Equation [3] is preferable, especially considering its simple format.
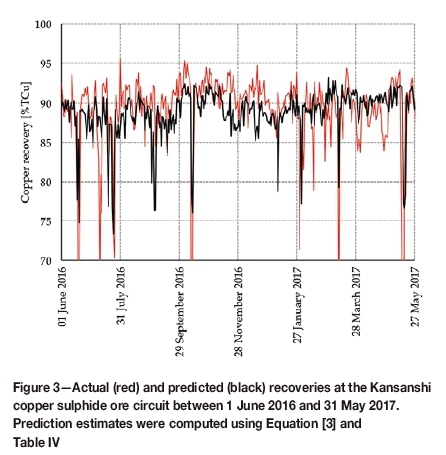
It is clear that some long negative peaks are not well reproduced by the model; however, the general trend, including the slight cyclical nature of the actual copper recovery data, is followed to an acceptable extent. The other concern is that the coefficient of determination may require further improvement. For that to be done, relevant operating parameters perhaps not yet available or not shortlisted in Table II should be explored for inclusion into the model.
To further improve on the predictive ability, the inclusion of the percentage acid-soluble copper (AsCu), the ratio of acid-insoluble copper to total copper (AiCu/TCu), and the difference between total copper (TCu) and total copper mean for the data-set (TCu) into the empirical model was explored. In doing so, Equation [3] was modified to the following form:
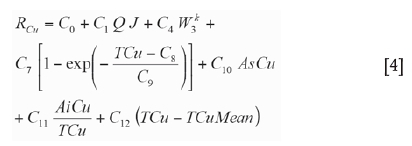
A new regression analysis was performed based on Equation [4]. This time, 10 coefficients were regressed and their uncertainties still calculated at a significance level of 95%. The outputs from the curve-fitting algorithm are reported in Table V.
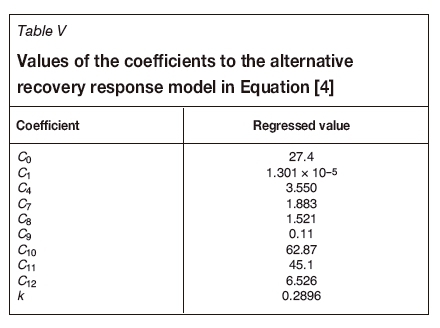
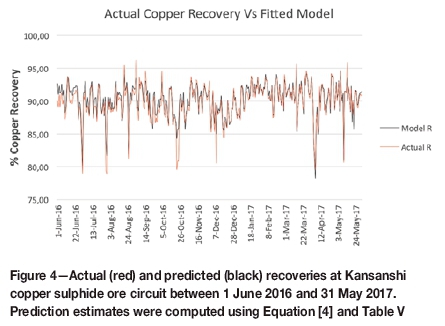
The result of this analysis was also validated against the data between 1 June 2016 and 31 May 2017. Here, a coefficient of determination R2 = 0.904 was noted for Equation [4]. In addition, when validated again the data between 1 June 2016 and 31 May 2017, a striking similarity is evident, as shown in Figure 4. The improved coefficient of determination R2 = 0.904 simply means that Equation [4] describes 90.4% of the data well with the remaining 9.6% being attributed to uncertainties inherent to the plant data collected as well as the structure of the model. However, an improvement is noted from R2 = 0.694 for Equation [3] with a more complex structure for Equation [4].
Finally, empirical models are generally useful and simple to use while their format is based on the experience of the researchers involved. One shortcoming, though, is that they need constant refinement and calibration. Therefore, they should be used with caution outside the average operating conditions under which they were developed. More realistic models are needed for application in wider operating ranges. Phenomenological models built around the population balance model (Austin, Klimpel, and Luckie, 1984; King, 2012) are good examples of realistic models of mineral processing operations. Further work is necessary to produce such type of a model for the Kansanshi copper sulphide ore circuit. A simplified version of the anticipated model may then serve the purpose better than Equations [3] and [4] in a wider operating range. The drawback may be the complex format of this type of model and the need to define an increased number of input parameters. For as long as the phenomenological model or its simplified version are not available, the proposed empirical model should be used.
Conclusion
The objective of this research was to develop a predictive model for copper recovery in the Kansanshi copper sulphide ore circuit. All available data collected online from the operation was reviewed to shortlist important input parameters to the model, and the literature was studied to determine an initial form of the empirical model.
The model building ensued once only 13 operating parameters of the circuit were retained; the information from the signals corresponding to each parameter was then extracted for the period from 1 June 2016 to 31 May 2017. This time-series data was curve-fitted using the empirical model initially proposed and the relevant statistics were produced in the process. From the statistics, it was clear that some regressed fitting coefficients added little to the accuracy of the model. These were eliminated and, consequently, the empirical model took a simplified format that included only ten fitting coefficients and seven input parameters. The input parameters are the copper head grade (TCu), percentage acid-soluble copper (AsCu), acid-insoluble copper (AiCu) at the flotation section, the SAG mill throughput, the ball mill load, and the tonnage of feed material to the SAG mill in the size fraction -125 +63 mm. The regression analysis revealed that the simplified empirical model accounts for approximately 90% of the copper recovery data. The significant improvement in model prediction ability with the inclusion of acid soluble copper provides strong evidence of the influence of mineralogy on flotation recovery. The influence of acid-soluble copper grade on model predictive ability was expected because soluble copper minerals do not float under sulphide flotation conditions. This indicated that there is room for improvement in the model; this may be achieved by the inclusion of parameters not currently measured or those that were not shortlisted in the development of the initial model. Despite some limitations, the model has the potential to serve the purpose of quickly estimating the expected recovery under given operating conditions. This timely information may help make sense of the actual recovery and identify avenues for corrective action guided by production targets.
Work is currently underway aimed at developing a model of the behaviour of the Kansanshi copper sulphide ore circuit. This computer model will be based on a more theoretical description of unit processes using MODSIM®, a specialized module simulator for mineral processing operations. This will become an additional, yet more comprehensive, tool to assist the process engineers in efficient operation of the plant.
Acknowledgements
The authors are indebted to the management of Kansanshi Mining PLC, First Quantum Limited, for permission to publish this paper. The University of South Africa (UNISA) is also acknowledged for encouraging the collaborative work and providing an environment conducive to research.
References
Austin, L.G., Klimpel, R.R., and Luckie, P.T. 1984. Process engineering of size reduction: Ball milling. Society of Mining Engineers of the AIME, New York. [ Links ]
Compan, G., Pizarro, E., and Videla, A. 2015. Geometallurgical model of a copper sulphide mine for long-term planning. Journal of the Southern African Institute of Mining and Metallurgy, vol. 115, no. 6. pp. 549-556. [ Links ]
Hu, W. 2014. Flotation circuit optimization and design. PhD thesis, Imperial College London, UK. [ Links ]
King, R.P. 2012. Modeling and Simulation of Mineral Processing Systems. 2nd edn. Schneider, C.L., and King, E.A. (eds.). Society for Mining, Metallurgy, and Exploration, Littleton, CO. [ Links ]
Klimpel, R.R. 1995. The influence of frother structure on industrial coal flotation. High Efficiency Coal Preparation, Kawatra, S. (ed.). Society for Mining, Metallurgy, and Exploration, Littleton, CO. pp. 141-151. [ Links ]
Napier-Munn, T.J., Morrell, S., Morrison, R.D., and Kojovic, T. 1996. Mineral comminution circuits - Their operation and optimization. JKMRC Monograph Series, University of Queensland. [ Links ]
Newall, C. 2017. First Quantum Minerals announces its 2016 production and sales. http://wwww.first-quantum.com/Media-Centre/Press-Releases/Press-Release-Details/2017/Fkst-Quantam-Minerals-Announces-Its-2016-Production-and-Sales/default.aspx [accessed 9 April 2018]. [ Links ]
Pease, J.D., Curry, D.C., and Young, M.F. 2006. Designing flotation circuits for high fines recovery. Minerals Engineering, vol. 19, no.s 6-8. pp. 831-840. [ Links ]
Yahyaei, M., Vos, F., Powell, M.S., Siliezar, J., and Perkins, P. 2014. Challenges in developing integrated process models based on industrial survey data. Proceedings of the 12th AusIMM Mill Operators Conference. Australasian Institute of Mining and Metallurgy, Carlton, Victoria. pp. 437-446. [ Links ]

