


Services on Demand
Article
 English (pdf)
 Article in xml format
 Article references
Indicators

Related links
-
 Cited by Google
 -
 Similars in Google
Share

 Permalink
Journal of the Southern African Institute of Mining and Metallurgy
On-line version ISSN 2411-9717
Print version ISSN 2225-6253
J. S. Afr. Inst. Min. Metall. vol.116 n.7 Johannesburg Jul. 2016
http://dx.doi.org/10.17159/2411-9717/2016/v116n7a12
PAPERS OF GENERAL INTEREST
Coal quality management model for dome storage (DS-CQMM)
M.A. Badani-PradoI; V. KecojevicI; D. BogunovicII
IDepartment of Mining Engineering, West Virginia University, Morgantown, WV, USA
IINorth American Coal Corporation, De Kalb, MS, USA
SYNOPSIS
Coal quality (ash, sulphur, moisture, and heating value) is one of the fundamental concerns for both coal mines and power plants. In order to deliver uniform coal quality to the power plant, there is a need for realtime monitoring of coal quality from the mine to the coal stockpiles. The specific problem represents the process of stacking the coal inside an enclosed facility such as a dome. The objective of this research was to develop a custom-made and integrated coal quality management model for dome storage (DS-CQMM). The DS-CQMM merges existing technology in surface mines, such as coal analysers, together with automation technologies, information technologies (IT), and mathematical models. The DS-CQMM is organized into four major sections: Delay Time application, Stacker application, Reclaimer application, and Live Stockpile application. A sub-process called Volume Calculation is embedded in Stacker application, while an additional feature called Forecast tool is included in the Reclaimer application. The DS-CQMM model was developed for a surface coal mine in the southern USA.
Keywords: coal quality; coal analyser; mathematical modelling; dome storage; stacker, reclaimer
Introduction
Knowledge of coal quality properties (ash, sulphur, moisture, and heating value) is one of the key aspects for mines and power plants. Modern mines invest time and economic and technological resources in order to manage coal quality for final use in power plants. Since the coal market is characterized by the need for a uniform product of particular specifications (Keleher et al., 1998), it is critical that the delivered product meet the quality requirements imposed by contracts. Oman et al. (2001) state that boiler efficiency at power plants is affected mainly by the changes in coal quality. Therefore, coal quality management is a fundamental concern.
In order to deliver a uniform product, mines usually use coal blending in order to homogenize mixtures of coal in such a way that the properties of the final blend satisfy particular specifications. Coal blending is also called coal mixing (Arnold and Smith, 1994). Mines blend coal to not only meet the customer's requirements, but also to optimize the life of their high-quality reserves (Reeves, 1995).
Coal blending can be performed at the mine site, on stockpiles, and in bins, bunkers, and silos (Arnold and Smith, 1994). There are a number of techniques that enhance the blending process, such as different ways of storage (circular stockpiles, longitudinal stockpiles), different procedures for stacking, and different processes of reclaiming. Wolpers (2014) indicates that stockpile homoge-nization systems equalize variations in chemical and physical properties of the raw materials and transform low-quality grades into a uniform mixture of higher material quality. Therefore, there is a need to know coal quality before stacking coal at the stockpiles so that potential problems can be blended out (France, 1999). Schott (2004) also stated that input properties of coal are a main factor for performance of homogenization of bulk materials in mammoth silos.
Blankenship (1995) used online coal quality data for fuel analysis in order to obtain better coal blending. The fundamental components of online coal quality studies are coal analysers, and they are employed in monitoring, blending, or sorting applications (Laurila, 1995). An example of integration of online coal analysers and a control algorithm is given by Ganguli et al. (1998). Prompt gamma neutron activation analysis (PGNAA) is considered to give the best online analysis precision for reporting coal parameters such as ash, moisture, sulphur, and heating value, by determining the concentration of primary elements (France, 1999).
An example of the importance of coal management is demonstrated by a mine in central Mississippi, which provides coal to a 440 MW power plant. The mine experimented with multiple coal quality analysers in order to find an accurate and reliable solution. The mine and adjacent power plant were challenged with quality deliveries; therefore, a suitable solution was to acquire coal analysers that would ensure that the product delivered to the power plant did not exceed a certain ash content. A dual gamma ash gauge was installed, with an associated microwave moisture meter to monitor coal quality. At first, the results were encouraging, but soon the operators found that the variation in coal flow rate was causing disparities in ash and moisture results. Additionally, the performance of microwave moisture meters is diminished with an increase in moisture concentration, and coal operators are wary of using them where moisture exceeds 30% (Foster and Heger, 2014). Due to these problems, the dual gamma ash gauge was removed from service. According to the mine and power plant operators, two lessons were learned from this experience: 'Real-time coal quality data is extremely valuable, but incorrect real-time data is worse than no real-time data at all.' The mine then addressed the problem by installing PGNAA analysers on the conveyor belt system. The analysers were used to monitor coal flow to the silos and boilers in such a way that if low-quality coal was arriving, control room operators could make adjustments to the blend ratio, depending on the real-time data retrieved from the analysers (Foster and Heger, 2014). However, since silos were used only for temporary storage, the entire system had limited impact on the blending process and therefore on the final quality of the coal being delivered.
A power plant near Castle Dale, Utah used a coal analyser to control the ash fusion temperature of the coal blend (Snider et al., 2005). Low ash fusion temperatures were the primary cause of slagging and unplanned outages. Engineers from the plant studied the relationship between certain coal ash minerals and the softening temperature of the ash, and developed formulae that estimated the ash-softening temperatures of the coal blend as a function of the ash components. They realized that PGNAA analysers could help determine the chemistry of the six major ash components and the ash-softening temperature (Snider et al., 2005). The analyser monitors blend coal conveyed from the stockpiles to the screening transfer building and then to a second transfer tower, which is connected to the storage barn (Snider et al., 2005). This solution was effective in dealing with ash challenges and led to reduced slagging, but lost generation and frequency of forced outages indicated that the rest of the quality tags should be given more attention.
According to Woodward (2008), the number of analysers purchased by utilities is growing. This shows that the coal mining industry has realized the advantages of using analysers for quality management purposes.
France (1999) investigated the utilization of coal analysers in a coal management system already installed in a coal mine. The coal analysers automated the data with a two-dimensional image of the stockpiles by accepting the coal quality data into stockpiling modelling software. The software allows users to visualize and analyse the coal stockpile stacked by the stacker/reclaimer. The model also provides the ability to predict the quality of the coal in case of reclaiming a specific area of the stockpile. The stockpile management system provides a visual output that allows graphic analysis of the content of ash and sulphur in the stockpile. This is an example of how online coal analysers can enhance the automation of coal quality management using computer technologies. Nonetheless, to the best knowledge of the authors, the visual output shows only two quality parameters (ash and sulphur) of the stacked coal.
There is a lack of real-time coal quality management models for dome storage. The specific problem represents the process of stacking the coal inside the enclosed facility such as a dome. This process generates the unique geometry of the stockpile due to the physical constraints caused by the circular shape and walls of dome and height and length of stacker. The reclaiming process also creates a particular shape of stockpile. The specific challenge to the mine is to know spatial distribution of coal quality parameters, volume, and tonnage in such a stockpile.
The objective of this research study was to develop a user-friendly interface for a coal quality management model for a dome storage (DS-CQMM) by using existing technologies in a surface coal mine in southern USA, merging automation technologies with information technologies (IT) and mathematical modelling. Specific aims were as follows:
i Create multiple user-friendly applications based on the Windows® OS for the process of stacking and reclaiming coal flow into a dome storage
ii Establish the connection between the applications, the coal analyser, and the distributed control system (DCS) room databases in order to retrieve and store necessary data for building a DS-CQMM model
iii Develop an algorithm for retrieving data from the DCS room database containing the velocities of different conveyor belts, and calculate the time remaining for a given batch of coal coming from the crusher and belt conveyors to the boom of the stacker inside the dome
iv Formulate a three-dimensional mathematical model for developing a stacking algorithm that will assign shape and relative position of the coal stockpile inside the dome
v Create an algorithm for calculating the coal volume that is being stacked into the dome and assign quality properties for presenting values in tons for the user interface
vi Formulate a mathematical model for developing a reclaiming algorithm that will show the operator the different ranges of values of different quality tags of the remaining coal inside the dome (in addition, it needs to show the remaining shape of the coal stockpile after reclaiming
vii Build a tool that implements a set of tables with numerical values of coal quality and tonnage for forecasting future reclaiming processes
vii Develop multiple simulators for each created application in order to test the model.
Methodology
The proposed technical approach for the development of the DS-CQMM is based on the technological process designed at a surface coal mine operated by one of the largest coal companies in the USA. Figure 1 shows the basic concept of the system and the flow of the coal from the dumping point to the dome. The system consists of a hopper, crusher, coal analyser, conveyor belt system, transfer towers, dome, stacker, reclaimer, and emergency reclaimer.
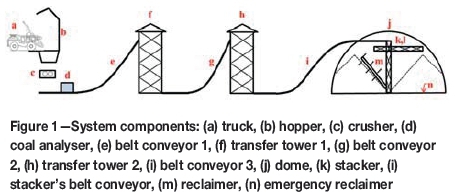
Truck (a) dumps the coal through the hopper (b) into the crusher (c). Crushed coal is transported by the belt conveyor 1 (e) to the transfer tower 1 (f) and belt conveyor 2 (g) and then to transfer tower 2 (h), which is designed to direct coal to either the emergency stockpile, power plant silos, or dome (j). The process at the transfer towers is conducted by the actuation of fast-acting proportional flop gates located on the towers. Coal quality and timestamps are recorded by the coal analyser (d), which is located above the belt conveyor 1 (e).
The coal flow directed to the dome (j) by the belt conveyor 3 (i) is delivered to the stacker (k). The boom of the stacker (k) rotates and steers the coal to its final location through a built-in belt conveyor (l). Finally, the coal is retrieved by the reclaimer (m) and transported outside the dome to the silos located at the power plant. In addition to the reclaimer (m), an emergency reclaimer (n) is installed at floor level in order to reclaim coal in case of the reclaimer's (m) failure or maintenance.
The PGNAA coal analyser provides coal quality information in real time, every minute for each batch of coal. A stacker stores the coal inside the dome and has one degree of freedom in the rotational (azimuthal) angle. A reclaimer that reclaims coal from the dome has two degrees of freedom: one in the rotational angle, and the other one in the elevation angle. Ultrasonic sensors are used for measuring the level of the coal stockpile, and encoders for determining the angular position of the stacker and the angular position and elevation of the reclaimer.
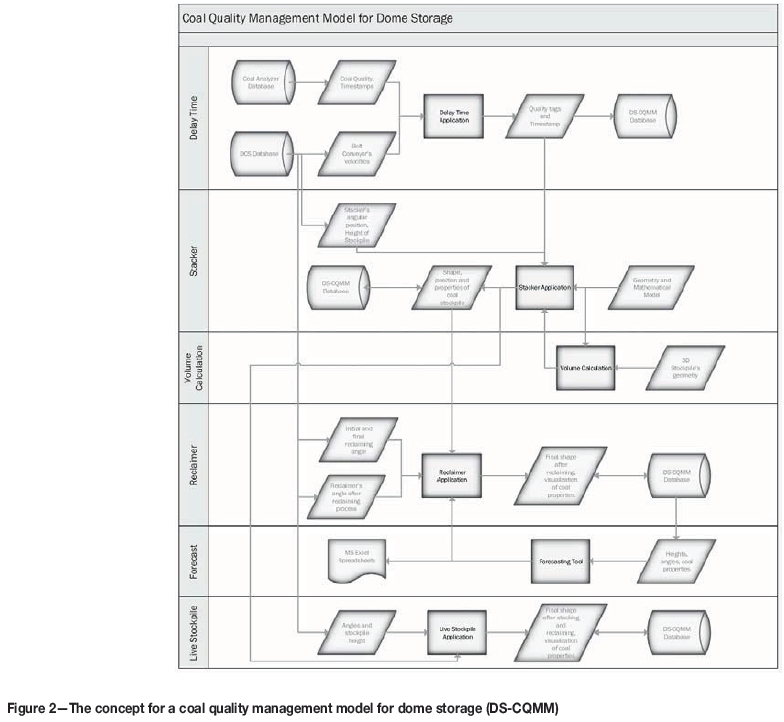
Figure 2 shows the concept of the DS-CQMM that is developed through this research. This model is organized into four major sections: (i) Delay Time application; (ii) Stacker application; (iii) Reclaimer application; and (iv) Live Stockpile application. A sub-process called Volume Calculation is embedded in the Stacker application, while an additional feature called Forecast tool is included in the Reclaimer application. All sections are related to each other in such a way that the data must be sequentially generated so that the DS-CQMM works properly in a specific coal mine.
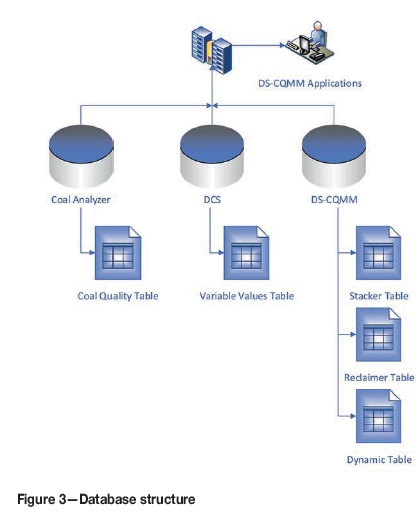
One of the most important components of the DS-CQMM is database synchronization. All applications are designed to retrieve, parse, and store values from and into the three different databases and their tables. These databases include: 'Coal Analyser' database, 'DCS' database, and 'DS-CQMM' database. Figure 3 shows the structure of these databases and their tables that are needed for a proper performance of the DS-CQMM.
Delay time application
Coal has to be transported between the coal analyser (starting point of the system) and the final point inside the dome. The coal analyser provides the instantaneous quality input of the current batch of coal that is passing under the detector at the beginning of the first belt conveyor. Therefore, it is necessary to know, for each batch, what its quality tags and timestamp are, and when will it reach the boom of the stacker in order to assign the angular position of the boom and the quality tags.
Mine operators can set and change the velocities of each belt conveyor, and this is achieved by the variable frequency drives (VFDs). After setting or changing the velocities, the DCS will retrieve the values from the programmabler logic controllers (PLCs) and store them along with a timestamp into the DCS database.
By accessing the DCS database, belt conveyor velocities can be queried every second or less to compare them with previous values and observe whether the belt conveyor has changed its velocity. Along with this information, querying the Coal Analyser database, and the absolute time from the DCS database clock, one is able to program a routine that calculates the coal delay time. For example, if it is supposed that there is only one batch of coal being transported from the coal analyser to the dome, its trajectory can be analysed along the belt conveyor system, the two towers, and finally the boom of the stacker. First, the coal is analysed by the PGNAA at the beginning of the conveyor system. Then, it is carried by the belt conveyor 1 and, depending on its velocity, it takes a certain time to travel along this conveyor. After that, it passes through the transfer tower 1 and it is directed towards belt conveyor 2. This process takes a fixed time. It is then carried through belt conveyor 2, transfer tower 2, and belt conveyor 3, repeating the described process. When the coal reaches the dome, it takes a certain time to be transferred to the stacker from belt conveyor 3. This can be considered as a delay time similar to the transfer tower's delay time. Finally, the stacker's belt conveyor meets the same criteria as the other belt conveyors. Once the batch of coal has reached the boom of the stacker, it is ready to be stacked inside the dome.
The process of the Delay Time application starts 'attaching' the quality tags to the batch of coal during transportation through the conveyor system. In this way, a query to the Coal Analyser database is performed and stored into local memory. By retrieving the belt conveyors' velocities, the Delay Time application calculates the time a batch of coal takes to be transferred from the coal analyser to the boom of the stacker inside the dome. When the coal reaches that point (i.e. when the coal is at the boom of the stacker and is ready to be stacked), the coal quality information with its timestamp is passed to the next application for further analysis and database storage.
Stacker application
Mine operators need to know and visualize the actual quantity (volume and tonnage), location, and properties (heating value, moisture, ash, and sulphur) of stacked coal inside the dome. In order to accomplish this task, the first step is to determine the angular position of the boom of the stacker inside the dome. This enables the assignment of a relative position to the coal inside the dome, along with its particular properties. For this purpose, absolute rotary encoders record the angular position of the boom of the stacker into the DCS database through the PLCs. This is then retrieved by the Stacker application in order to build the virtual stockpile. Another important piece of information is the height of the stockpile, which is measured by an ultrasonic sensor located at the boom of the stacker. This value is stored into the DCS database.
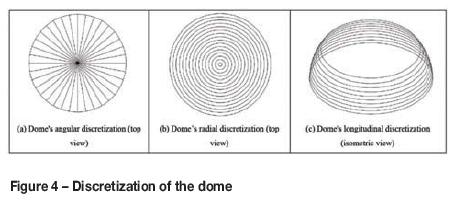
The geometry of the dome and coal stockpile is designed by using trigonometry equations. Discretization is conducted by a three-dimensional method using the cylindrical coordinate system. This ad-hoc model considers the ground of the dome as reference plane and the centre of the base circumference as the origin of the coordinate system. Discretization of the dome is performed as follows (Figure 4):
►Polar axis (θ): the dome is divided into 360 equal parts, each one corresponding to one degree on the angular coordinate. This is performed in order to retrieve the rotational angle of the boom of the stacker and the rotational angle of the reclaimer from the DCS database with a resolution given by the PLCs of one degree
►Radial axis (p): the dome is also divided on the radial coordinate, forming concentric circumferences with 0.3 m (1 ft) of radius-length difference. The discretization on this axis provides the third dimension
► Longitudinal axis (z): the dome is divided on the longitudinal axis into 90 equal parts with 0.3 m (1 ft) of distance. Since the maximum height of the coal stockpile is 26 m (85 ft), there is no need to extend the division further than 27.4 m (90 ft).
The model for the coal stockpile in the Stacker application is based on the following assumptions: (i) the stockpile's shape is approximately pyramidal; (ii) the analysis is performed in a plane that 'cuts' the pyramid in half; and (iii) the analysis is conducted in a two-dimensional plane. These three assumptions simplify the mathematical modelling and make analysis feasible.
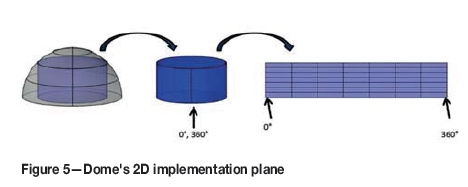
The first assumption is made because of the admissible approximation between the shape of the coal stockpile and the shape of the pyramid observed in perpendicular planes. The stockpile's peak is located at a given (and constant) distance from the centre of the dome. Using this information, the second assumption is formulated. Since the stockpile's height and stacker's angular position are key inputs of the DS-CQMM, the location of the stockpile's peak seems to be a reasonable main reference for the mathematical model and further graphical user interface (GUI). Therefore, the plane where the radius for the stockpile's peak is constant (p =ppeak = constant) is used for developing the model. The third assumption is an extension of the second assumption, i.e. given that the plane of study results in a cylindrical shape, it can be 'unfolded' and the mathematical model developed in a conventional plane with angle measurements in the abscissae and height measurements in the ordinates. Additionally, the mathematical model needs a point as an absolute reference (origin). At that point, angles 0° and 360° concur, establishing a rotational symmetry (Figure 5).
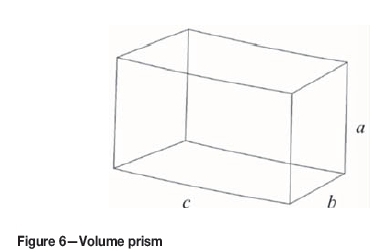
Since the dome is discretized in three dimensions, then the stockpile can be built as a pyramid and one can calculate the volume based on geometrical shape. Recall that the divisions are performed on the three axes (ρ,θ,ζ) at given distances. A closer observation of the resulting unit division of the intersection of these three divisions allows us to find the primary unit of volume, which is shown in Figure 6. Sides a and b measurements are each 0.3 m (1 ft) in length. Side c has no linear shape because it depends on the position of the prism, being larger if it is located farther from the centre of the dome. In other words, side c depends on the radius; therefore, there are two measurements of this side in each prism, therefore their average is taken for calculations.
The shape of the actual stockpile is plotted on the screen by querying the DS-CQMM database so the mine operator can know the actual shape of the coal stockpile inside the dome. Simultaneously, the screen shows an update of the remaining time until the next batch of coal along with its quality tags will arrive to the boom of the stacker. This enables the operator to rotate the boom of the stacker to a specific location in the dome. This is achieved by using the Delay Time application that queries the Coal Analyser database.
The Stacker application retrieves the angle of the boom of the stacker from the DCS database along with the height of the stockpile measured after the stacking process. The rotational angle and the stockpile's height are the key inputs for this application. After retrieving these measurements, the Stacker application calculates and generates data that is finally stored into the Stacker and Dynamic tables in the DS-CQMM database.
The stockpile's shape is plotted in a plane that follows the criteria explained in Figure 5 where a plane (θz) is extracted from the dome at a constant radius. Along with the quality tags, the Stacker application assigns the corresponding tonnage to each block using the volume and coal density.
Reclaimer application
One of the objectives of the DS-CQMM was to develop a user-friendly interface for determining the coal quality distribution inside the dome. Therefore, the Reclaimer application should have a configuration that allows the operator to navigate through the applications with minimal training. The Reclaimer application should also be able to obtain the correct inputs in order to show the previous and later status of the coal stockpile at the reclaiming process. In addition, numerical values of different coal quality tags should be available in tables for more accurate studies and analysis. Since the dome is used for storing purposes, the operator should be able to observe how much coal can be reclaimed, from which point of the dome, and the average of each quality tag that the reclaimed coal would have. All these objectives are achieved with the Reclaimer application and the Forecast tool.
The Reclaimer application shows the actual state of the coal stockpile inside the dome using the same interface layout as the Stacker application; which means that the interface is implemented in a two-dimensional plane where the radius of the peak of the stockpile is located. The operator has three options while the shape of the stockpile is being displayed: (i) to see the distribution of the different coal quality tags of the stockpile differentiated by colours; (ii) to perform the reclaiming process; and (iii) to start the Forecast tool.
The Forecast tool shows interactive tables; by selecting different cells or range of cells, the operator can display different values of coal quality and tonnage.
The operator is able to observe the coal quality distribution of the actual stockpile differentiated by colours. These colours are associated with a range of values for each quality tag. In other words, different ranges of coal quality are shown by colours for each coal quality tag following the actual shape of the stockpile.
The program retrieves the values of the different coal quality tags along with their position from the dynamic table in the DS-CQMM database so that the operator can decide which of the quality tags (ash, heating value, moisture, or sulphur) will be shown in the display area.
The process of plotting the quality distribution is the same for all tags. First, ranges of quality are set for each colour. Then, each point's quality value is compared with the ranges and the program decides which colour is assigned to that particular point. Finally, points are plotted into the display area.
It is important to recall that the points plotted correspond to the blocks located in the plane ρ= ppeak(i.e. the stockpile's peak radius). This situation is similar to the Stacker application where the two-dimensional implementation was performed. However, the database contains the entire data from the stockpile stored for every block: the location (ρ,θ,z) of the block, its quality tags, and the tonnage.
For this particular section of the DS-CQMM, three inputs are needed: initial angle of the reclaiming process (θs), final angle of the reclaiming process (θƒ), and final angle of the reclaimer after the reclaiming process (φ).
For historical records, the program stores the reclaimed coal properties and tonnage divided by blocks into reclaimer and dynamic tables in the DS-CQMM database; it then deletes the blocks that are located above the line defined by the reclaimer angle (φ) from the Dynamic table in the DS-CQMM database.
It is important to recall that the Dynamic table is used as a bridge table between the Stacker and Reclaimer tables. This table contains the actual state of the dome's stockpile. In that sense, the blocks corresponding to reclaimed coal are deleted from the Dynamic table but not from the reclaimer table.
The process of calculating the height and deleting the points above is repeated for every radius point pkat every angle θkcontained in the θs, θƒrange.
The final shape of the stockpile is shown in the Reclaimer application display area after the reclaiming process. It corresponds to the plane where the radius is constant (p = ppeak); however, there is coal stacked above that height 'behind' that plane. This is not reflected at the application display area, but remains stored in the DS-CQMM database and is reflected in numerical values at the Forecast tool.
Reclaimer application is a useful tool for graphical determination of coal quality distribution inside the dome. It gives the operator a good approximation of quality values and relative position of the stacked coal. However, it is necessary to obtain numerical values of coal quality data for different purposes such as forecasting, mine planning, blending, etc. The Forecast tool is developed for giving the operator information about the numerical values within a given range of angle and height for each coal quality tag, presented in tables. It also gives the operator a quick reference of average values of all the quality tags by selecting specific cells. Each quality tag and tonnage includes its own table of values that are shown on a display grid. These tables are divided using the same concept as used for Stacker and Reclaimer applications, i.e. by angles on the abscissae and heights on the ordinates. The user can select one of the following tables: Ash; Heating Value; Moisture; Sulphur; or Tonnage. The average values of the selected quality tag are shown in the table within a range of angles and heights.
The Forecast tool provides a dynamic way to obtain quality tag averages and a total summation of the tonnage of selected cells. The program obtains the initial and final value of the angle by retrieving the initial and final selected column. Once these values are obtained, it queries the Dynamic table in the DS-CQMM database for retrieving the averages and summation values.
After selecting the table of interest (i.e. any quality tag or tonnage table), the operator can select any range of cells from the table and the Forecast tool provides the averages and summation of the rest of the quality tag values. This flexible tool provides the user with the ability to forecast the reclaiming process based on one decision variable and to know the value of the rest of the variables in the system in a dynamic way.
Live Stockpile application
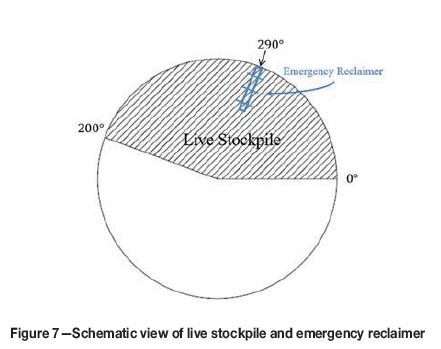
The emergency reclaimer is installed at the dome's ground level. This reclaimer is designed to work when the mobile reclaimer is undergoing maintenance or suffers a possible failure. It is located at 290° from the origin and the area of the live stockpile covers from angle 200° to angle 360° (Figure 7).
The coal will spend less time in this area of the dome than in the rest of the dome. In fact, the quantity of coal stored in the live stockpile increases and decreases constantly. By locating the stacker at angle 290° and activating the emergency reclaimer, this stockpile will dynamically change its shape.
Above the emergency reclaimer, an ultrasonic sensor is installed in order to provide the value of the stockpile's height constantly. In this way, the Live Stockpile application can retrieve that value from the DCS database in order to build the model.
The Live Stockpile application consists of a stacking part and reclaiming part. The operator decides what action is taken by switching between different available options: stacking, reclaiming, or coal quality display.
The Coal Quality Distribution display functions in the same way as in the Reclaimer application. This process shows the quality tags distributed within the coal stockpile differentiated within quality ranges by different colours. It is performed in the θzplane where the radius is constant and coincides with the radius of the peak of the stockpile {i.e. ρ= Ppeak). The difference is that coal quality distribution is shown in this section from angle 200° to angle 360°.
For implementation of the stacking part on the Live Stockpile application, the same inputs (i.e. stacker angular position (θ0) and stockpile height (z0)), and same volume calculation concepts as Stacker application are used. The data generated is also stored in Stacker and Dynamic tables in the DS-CQMM database. Additionally, this section includes the same graphical outputs as the Stacker application.
The display area shows the shape of the actual coal stockpile in a plane θzwhere the radius is constant and coincides with the radius of the peak of the stockpile (i.e. ρ=Ppeak).
Although the concept and development of the stacking part in the Live Stockpile application is similar to the Stacker application, the reclaiming concept and development is completely different. In the Reclaimer application, the reclaimer performs the reclaiming process on the surface of the stockpile. In other words, it reclaims from top to bottom and from side to side. In this case, the emergency reclaimer is located in a fixed position at ground level and reclaims from the bottom and from only one point of the stockpile. These are opposing concepts.
The reclaiming process at the live stockpile can be compared with an hourglass when it is running empty. The shape of the remaining stockpile will contain a hole with a shape of an inverted pyramid.
For implementation of the mathematical model, it is necessary to build an inverted pyramid that works as the reclaimed volume by the emergency reclaimer. For that purpose, the mathematical model is implemented on plane θzwhere the radius is constant and coincides with the stockpile's peak radius (p = ppeak). The width of the emergency reclaimer is also taken into consideration for accuracy.
The length of the emergency reclaimer is considered in the third dimension (i.e. pz plane). The influence of the emergency reclaimer's length on the live stockpile is reflected in the reclaiming process: the remaining stockpile has a dead volume originated by the emergency reclaimer's length. The dead volume has a triangular shape in plane pz determined by the angle of repose of coal (a).
Results and discussion
It should be noted that the DS-CQMM model was designed for a US-based surface coal mine and all units in Figures 8-16 are given in US units. However, in the text of this paper, all these units were converted to the metric system.
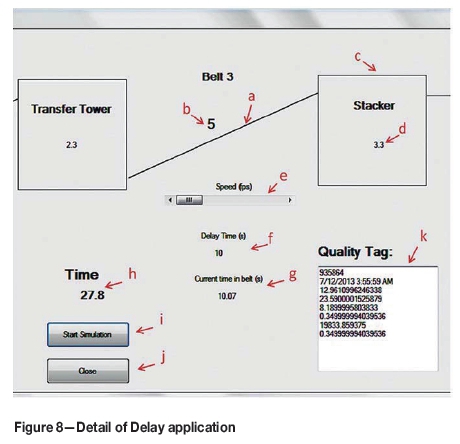
The screen of the Delay Time application test program is shown in Figure 8. The actual delay time (g) in seconds and the calculated delay time (f) are shown for each belt conveyor. The scroll bar (e) can be used to increase or decrease the velocity rate of the belt conveyor with ranges between 1.52 m/s (5 ft/second) and 3.35 m/s (11 ft/second) with increments of 0.3 m/s (1 ft/second). The velocity for each belt conveyor can be changed independently. The transfer towers are represented by a labelled square (c) that contains the actual residence time of coal (d) inside the tower. Raw data retrieved from the Coal Analyser database (k) is passed to the next stage for further analysis and processes. The total time that coal remains on the conveyor belts and in the towers (h) is the summation of all final delay times. The program starts by activating the 'Start' button (i), and closes database connections and the delay time applications through the 'Close' button (j).
The two key inputs of the Stacker application (θ0and z0) are shown as keyboard inputs. In the mine, these two inputs are retrieved automatically from the DCS database.
Suppose that a stacking process is taking place. The boom of the stacker is positioned at angle 65° and coal is stacked until the stockpile reaches the maximum height, 26 m (85 ft). The boom of the stacker then rotates to angle 70° and later to 75°, and stacks coal up to 26 m (85 ft). It is important to emphasize that the rotational angle of the stacker (θ0) is stored in the DCS database by the PLC and the height of the stockpile (z0) is measured by the ultrasonic sensor and stored in the same database.
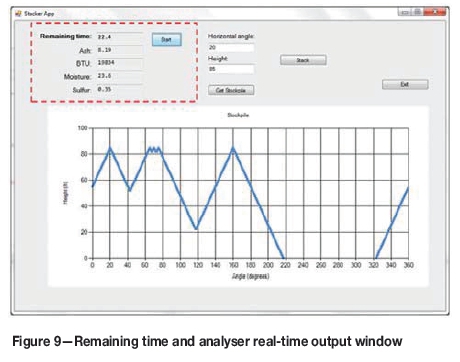
In case the operator decides to stack coal in a different location than the continuous stockpile, because the quality has a given characteristic or for any other reason, the Stacker application is able to build that stockpile. Figure 9 shows the final shape of the stockpile with coal stacked at 160° and 20° up to the maximum height. It should be noted that the left-hand branch of the stockpile does not overlap the existing branches.
Integration between the Stacker application and the Delay Time application is implemented in order to allow the operator to know the exact time remaining for that particular batch of coal to reach the boom of the stacker. This feature provides an extra benefit to the stacking process.
The 'Start' button that initiates the timer and triggers the queries is implemented for testing purposes; that action is automatically started when new data is available from the Coal Analyser database.
After stacking coal inside the dome, it is important to know the range of coal quality and its location. It is also important that the operators have an intuitive interface. For that purpose, the Reclaimer application provides the location of coal and, depending on the quality tag; it shows the range of quality distribution differentiated by colours.
Additionally, the Reclaimer application provides numerical values of coal quality, dividing the dome by angle and height ranges and displaying them in a table. This is implemented in a separate table for each quality tag and tonnage so that when the operator needs to know or 'forecast' the other quality tags based on that table, all that is required is to make a simple cells selection.
The example starts from the stockpile that has been created with the Stacker application. When the Reclaimer application is launched, it displays the actual shape of the coal stockpile. The display area shares the same concept as the Stacker application, where the stockpile is shown in two dimensions on plane z where the radius is constant and coincides with the radius where the peak of the stockpile is located (p = ppeak).
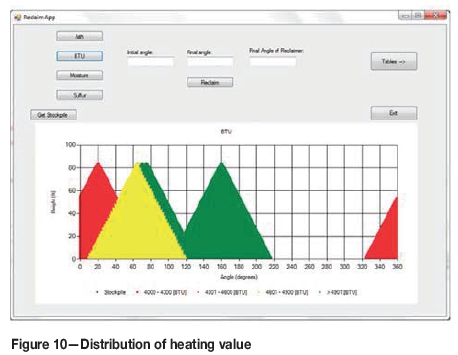
Now that the stockpile's actual shape is known, one can see the distribution of coal quality on the chart. Four coal quality tags are available in different colours for display. By selecting the corresponding buttons, the Reclaimer application displays the quality distribution associated with the quality tag. Figure 10 shows distribution of the heating value.
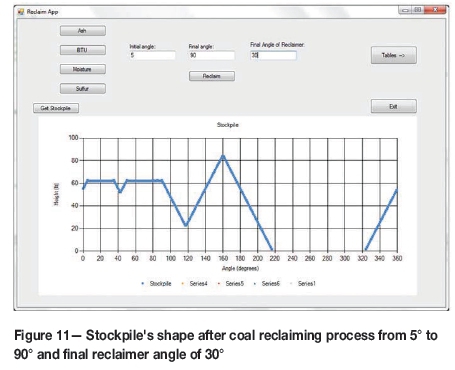
Once the operator decides what portion of the stockpile will be reclaimed - either using a graphical (Reclaiming application) or numerical (Forecast tool) approach - the reclamation process is performed. After finishing reclaiming coal, the Reclaimer application retrieves the required inputs from the DS-CQMM and DCS databases and displays the remaining shape of coal stockpile inside the dome. This is shown in Figure 11, where the reclaimed coal has been removed from the dome starting at angle 5° and ending at angle 90° and where the final angle of the reclaimer (φ)is 30°.
The Forecast tool is used for a more accurate approach and for an interactive way of calculating the average quality of a specific portion of coal. This tool displays an expandable menu where the quality tag tables are contained. Each table consists of cells that show the calculated average of quality within the range of angle and height that are shown on the headers of rows and columns. There is also a table for the summation of the tonnage using the same range division.
By selecting one of the tables, the Forecast tool queries the Dynamic table in the DS-CQMM database and retrieves the average of the quality within the ranges if the option chosen is a quality tag, and retrieves the summation of the tonnage within the range if tonnage is chosen.
The division ranges of the rows and columns of the tables are performed as follows: angle divisions (every 20°) and height divisions (every 1.5 m (5 ft)). These values could be changed internally in the program code.
There is an essential difference between the graphical and numerical approaches. The highest height value shown in the charts for the stockpile is different, as shown in the tables. This situation is explained as follows lines. Recall that the GUI in two dimensions is developed in a plane that corresponds to a constant radius coincident with the stockpile's peak radius (i.e. ρ= ppeak), and given that the reclaiming process is performed in a perpendicular plane, it cannot be completely reflected in the charts. However, this is avoided in the tables where the database is queried for the entire content of the dome. For this reason, the heights of the stockpile in the charts and in the tables are not consistent due to the existence of remaining coal 'behind' the charts' plane. That coal is stacked to a greater height than that shown in the graphical approach.
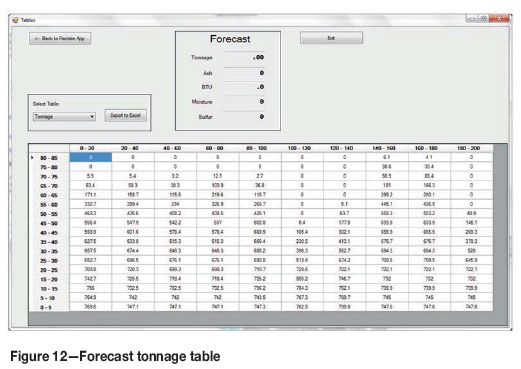
The Tonnage table uses a different concept. Figure 12 shows that it shares the same layout as the Quality-tag tables; the difference is that the queries against the DS-CQMM database are different. The value displayed in cells is a total summation of the tonnage contained in the ranges shown in the headers of the rows and columns.
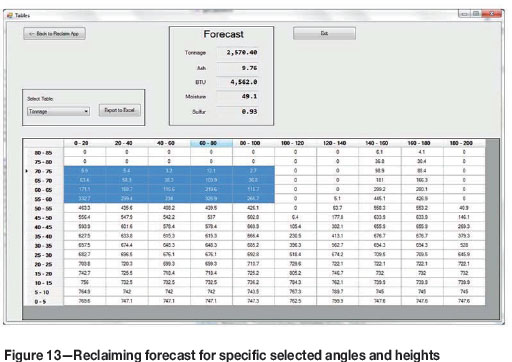
Assume that the operator needs to forecast a given portion of coal for reclaiming and its location inside the dome based on the quantity of coal. The Tonnage table should be selected for starting the process. By selecting which part of the dome's coal will be reclaimed, the Forecast tool returns the total value of tonnage and the average of the four coal quality tags within the selected cells. Figure 13 shows a forecast process (in the 'Forecast' square) by selecting a range of cells.
The Live Stockpile application is a specific part of the dome that covers the area from angle of 200° to 360°. The emergency reclaimer is installed at ground level at angle of 290°. The live stockpile is characterized by its dynamic behaviour of continuous stacking and reclaiming processes, which increase and decrease its height regularly.
When the Live Stockpile application is launched, the stockpile's actual shape is displayed for the operator. Suppose that coal has been stacked at angle 240° up to 26 m (85 ft). Its height is measured by the ultrasonic sensor located at the boom of the stacker and stored in the DCS database. At this point, the blocks containing the tonnage and quality tags created by stacking part of the Live Stockpile application are stored in the Dynamic and Stacker tables in the DS-CQMM database.
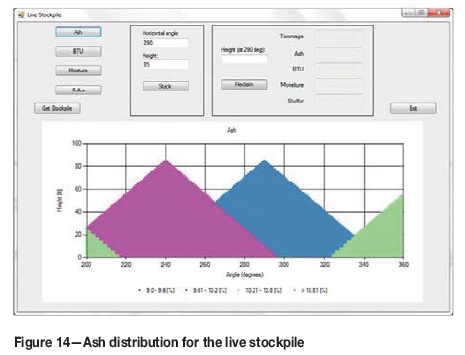
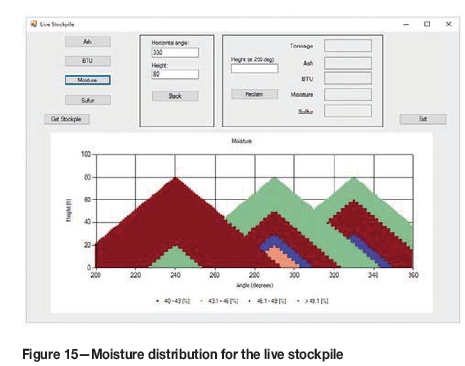
If one assumes that the boom of the stacker moves to angle 290° (which is the position where the emergency reclaimer is installed) and stacks up to 26 m (85 ft), which is the maximum height designed to be stacked inside the dome, the shape of the stockpile is created and its quality tags are as shown in Figure 14. The quality distribution display part of this application is similar to the previous Reclaimer application; it shows the distribution of the coal quality inside the dome by selecting quality tags buttons. An example of moisture distribution is shown in Figure 15.
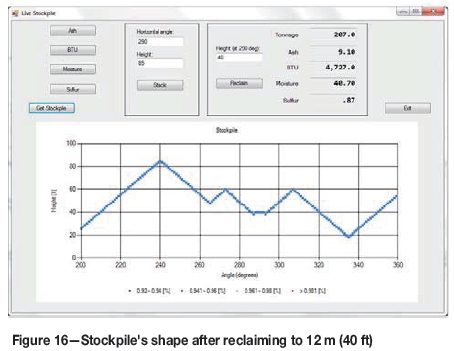
This stockpile behaves dynamically, increasing and decreasing its height constantly. An ultrasonic sensor is installed above the emergency reclaimer at the dome for measuring the live stockpile's height, even if the boom of the stacker is not located at this angle. If the operator activates the emergency reclaimer, the stockpile will decrease in height due to reclaiming process. The ultrasonic sensor provides the height and the Live Stockpile application builds the stockpile. Figure 16 shows the shape of the stockpile after being reclaimed to 12 m (40 ft). It has a flat zone due to the width of the emergency reclaimer. The slope of the reclaimed part has the same slope as the rest of the stockpile, which is the angle of repose of coal (a).
Coal quality management model for dome storage (DS-CQMM)
It is important to note that, along with the final shape of the stockpile, the numerical values of the average of the quality tags and the total summation of the tonnage of the reclaimed coal are shown.
Conclusions
The coal quality management for dome storage (DS-CQMM) model developed through this research provides a graphical and numerical distribution of coal quality and its relative position inside the dome by integration of a variety of technologies. Mathematical models for different DS-CQMM applications were developed and interaction between these applications and databases was established. Algorithms for three-dimensional assignment of coal properties during the stacking process and reclaiming process based on the reclaimer's operations were developed, and a useful tool to forecast coal reclaiming process was designed.
This model can be helpful in the process of managing coal quality as follows:
► Storing coal inside the dome is an advantage for reclaiming purposes. If the mine needs a specific tonnage with a specific quality in a relatively short time-frame, then a dome with an appropriate quality management system is enormously helpful
► If we know the quality of the coal stored inside the dome and, most importantly, where it is stored and how many tons are available, then the process of blending the coal incoming from the mine and retrieved from the dome can be accomplished.
References
Arnold, B.J. and Smith, D.B. 1994. Coal blending - meeting specifications. SME Preprint no. 94-83. SME Annual Conference, Albuquerque, New Mexico. [ Links ]
Blankenship, C.K. 1995. The coal quality impact model, on-line analysis and linear programming for SO2 compliance optimal utility fuel planning in the competitive 1990s. SME Preprint no. 95-47. SME Annual Conference, Denver, Colorado. [ Links ]
Foster, S. and Heger, M. 2014. Using on-line nuclear elemental analyzers to optimize boiler operation at Choctaw Generation Station in northeast Mississippi. https://www.researchgate.net/publication/237482736_Using_On-line_Nuclear_Elemental_Analyzers_to_Optimize_Boiler_Operation_at_Choctaw_Generation_Station_in_Northeast_Mississippi [ Links ]
France, G. 1999. The utilization of on-line analyzers at the Blair Athol Coal Mine, Queensland, Australia. SME Preprint no. 99-124. SME Annual Conference, Denver, Colorado. [ Links ]
Ganguli, R., Yingling, J.C., Zang, J., Sottile, J., and Kumar, R. 1998. Optimal control of coal segregation using on-line quality analyzers. SME Preprint no. 98-187. SME Annual Conference, Orlando, Florida. [ Links ]
Keleher, P, Cameron, D., and Knijnikov, M. 1998. Improving fundamental stockpile management procedures. Proceedings of the Coal Operators' Conference, Wollongong, Australia. pp. 422-28. [ Links ]
Laurila, M.J. 1995. Preparation plant control using on-line ash analyzers. High Efficiency Coal Preparation: An International Symposium. Chapter 33 - Plant Studies and Optimization. pp. 379-388. [ Links ]
Oman, J., Senegacnik, A., and Dejanovic, B. 2001. Influence of lignite composition on thermal power plant performance. Part 1: theoretical survey. Energy Conversion and Management, vol. 42. pp. 251-263. [ Links ]
Reeves, R. 1995. Update on automated blending using on-line coal analyzers. SME Preprint no. 95-109. SME Annual Conference, Denver, Colorado. [ Links ]
Schott, D.L. 2004. Large-scale homogenization of bulk materials in mammoth silos. Doctoral dissertation, Technische Universiteit Delft, Netherlands. [ Links ]
Snider, K., Woodward, R., and Evans, M. 2005. Online coal analizer reduces slagging. POWER Magazine, vol. 149, no. pp. 24-27. [ Links ]
Wolpers, F.M. 2014. Homogenization of bulk material in longitudinal and circular stokpile arrangements. www.saimh.co.za/beltcon/beltcon8/paper818.html [ Links ]
Paper received Dec. 2014
Revised paper received Oct. 2015.
© The Southern African Institute of Mining and Metallurgy, 2016. ISSN 2225-6253.

