


Services on Demand
Article
 English (pdf)
 Article in xml format
 Article references
Indicators

Related links
-
 Cited by Google
 -
 Similars in Google
Share

 Permalink
Journal of the Southern African Institute of Mining and Metallurgy
On-line version ISSN 2411-9717
Print version ISSN 2225-6253
J. S. Afr. Inst. Min. Metall. vol.116 n.7 Johannesburg Jul. 2016
http://dx.doi.org/10.17159/2411-9717/2016/v116n7a2
PAPERS - DANIE KRIGE GEOSTATICAL CONFERENCE
A test of the appropriateness of the LUC technique in high-nugget Birimian-style gold deposits
E. Maritz
AngloGold Ashanti
SYNOPSIS
The localized uniform conditioning (LUC) technique was proposed by Marat Abzalov in 2006. The technique converts conventional uniform conditioning (UC) grade-tonnage curves into single grade values attached to each smallest mining unit (SMU). This is achieved by ranking the SMUs within a panel in increasing order of their grade (based on the direct kriging of SMUs). This ranking is then used to localize the conventional UC grade-tonnage curves for each panel by dividing them into classes and computing their mean grades, which are assigned to the SMUs. The quality of this localization process will depend heavily on the validity of the grade patterns predicted by the direct kriging of the SMUs. Abzalov noted that where the distribution of data available for the direct kriging of the SMU is characterized by strong short-range variability, the advantages of using the LUC approach may be more limited. Consequently, a study was undertaken to determine how valid the predicted grade patterns of a typical Birimian-style gold deposit (with high nugget effect and strong short-range variability) might be expected to be. This was determined by comparing the direct SMU kriging ranking (based on sparse data) with the grade control model ranking (based on close-spaced data and the best available estimate of the deposit). The results showed a satisfactory correlation between these rankings and it was concluded that, although the grade patterns predicted by the direct kriging of the SMUs may be less meaningful for deposits exhibiting strong short-range continuity, there is nevertheless a convincing relationship with the actual (or best available) rankings. Therefore, the LUC technique is still considered to be useful for this style of deposit.
Keywords: localized uniform conditioning; geostatistics; recoverable resources
Introduction
For adequate technical and financial evaluation of a project, attempts should be made to estimate the recoverable resources -the portion of the in situ resource that can be economically extracted by mining. To achieve this, the estimates of the tonnage and grade of the mineralization should be produced above a given economic cut-off and should take into consideration the proposed mining selectivity.
At the early stages of exploration, we often have only broad-spaced sample data to estimate with. Ordinary kriging (OK), a commonly used linear interpolator, may be used to estimate grades into larger panels (estimation into smaller panels that are not adequately supported by dense data may result in smoothed and conditionally biased estimates). These larger panels, which are suitable for the broadly spaced data, often do not adequately represent the selectivity expected at the time of mining. The mining selectivity (represented by the smallest mining unit or SMU) is based on the deposit type and the chosen mining equipment.
Nonlinear techniques, such as uniform conditioning (UC) and multiple indicator kriging (MIK), are commonly used to generate estimates at SMU scale reflecting the proposed mining selectivity. With these techniques, the portion of the mineralization that can be economically extracted is estimated by determining the distribution of SMUs within each panel based on a change-of-support model. Estimates of the grades and proportions extractable above a given cut-off are provided for each panel without specifying precise spatial locations for this recoverable mineralization. A better understanding of the actual spatial locations of the SMUs would significantly simplify the manipulation of the results for mine planning purposes and would enhance the technical and financial evaluation of the project.
In 2006, Marat Abzalov (Abzalov, 2006) proposed a method called localized uniform conditioning (LUC) for predicting the spatial locations of the economically extractable mineralization by assigning a single grade to each SMU-sized block. LUC enhances the UC approach by localizing the model results. The grades of the SMUs are derived from the conventional UC grade-tonnage relationships. For each panel, the UC grade-tonnage function is divided into grade classes and the mean grades of the grade classes are assigned to the SMUs in the panel. The method of mean grade assignment is based on a predicted grade pattern within each panel. The grade pattern is determined by OK of the SMUs from the sparse data-set and is used to rank the SMUs within each panel in increasing order of their grade before assigning the mean grades of the UC grade classes.
Abzalov (2006) noted that spatial grade distribution patterns are often recognized by geoscientists in deposits even when drill spacing is still too broad for direct accurate modelling of small block grades, but sufficient for identification of the major distribution trends. He suggested that, even when drill spacing is too broad to avoid a smoothed SMU grade estimate, direct kriging of the small blocks can be used to obtain reliable grade patterns and the resultant SMU ranking within the panels. Abzalov deemed that this was particularly applicable to continuous mineralization characterized by a low nugget effect, such as disseminated base-metal sulphides, bauxites, and iron oxide deposits. He cautioned that where the data is sparse and not close to a panel, or its distribution is characterized by strong shortrange variability, there could be less of a meaningful pattern. Accordingly, if the predictions of the SMU rankings by OK (or any other technique) are inadequate, the advantages of using the LUC approach will be more limited, or LUC may even be entirely unsuitable. A basic assumption of the conventional UC approach is that the locations of ore and waste within the panels are unknown (the SMUs are distributed randomly within the panels). The LUC method aims to overcome this theoretical constraint by attempting to predict the spatial locations of the SMUs, but its validity is strongly dependent on the ability to confidently estimate the rankings of the SMUs within the panels.
As a result of this, a study was undertaken to determine how meaningful the predicted grade patterns of a typical Birimian-style gold deposit (with high nugget effect and strong short-range variability) might be expected to be. This was determined by investigating the relationship between the LUC ranking (based on the direct kriging of the SMUs from sparse data) and the grade control model ranking (based on close-spaced data and the best available estimate of the deposit).
Case study
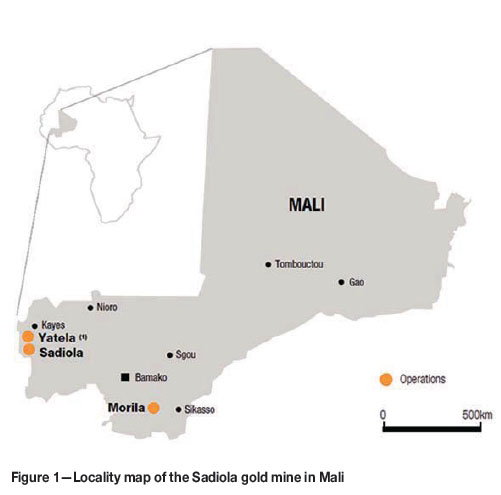
The northern pit of the Tambali gold deposit was chosen for the case study. The deposit forms part of the Sadiola gold mine located in Mali close to the border with Senegal and approximately 440 km northwest of the capital Bamako (Figure 1).
The Sadiola gold deposits lie within the Kenieba Kedougou Birimian greenstone belt of southwestern Mali (2.17-2.18 Ga). The deposits are hosted by the Kofi Formation - a dominantly metasedimentary unit. At Tambali, the host rocks consist of moderately-sorted meta-sandstone with minor meta-siltstone interbeds and a finely bedded siltstone-shale unit with minor sandstone interbeds. These metasedimentary units are north-trending, but are intruded by numerous NNE-trending quartz-feldspar porphyry (QFP) dykes and plugs. The mineralization is developed in all host rocks and the mineralization trends are associated with structural corridors (shear zones) marked by veining, alteration, and weathering. The dominant ore mineral is arsenopyrite, although pyrite, and to a lesser extent pyrrhotite, have also been observed in drill core. Antimony-bearing minerals are present in trace to minor amounts. The pathfinder element association of the ore typically comprises As-Au-Sb ± Ag-Bi-Mo.
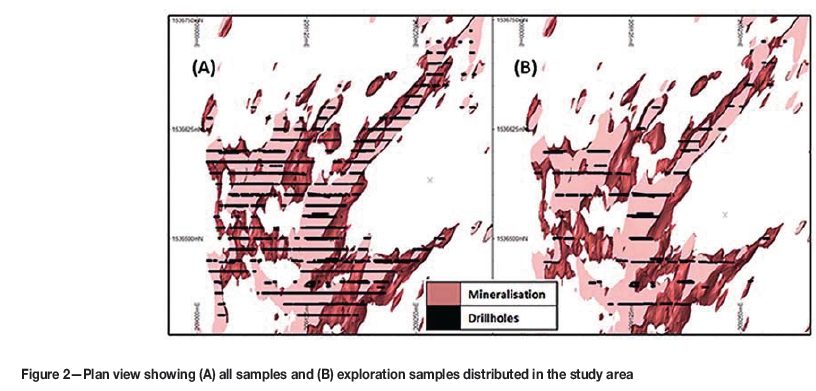
Gold grade and structural trends were used to interpret the mineralization using Leapfrog© software. The interpretation was generated using the implicit Leapfrog© Grade Interpolation technique, which involves the 3D contouring of grades while taking into account a chosen grade threshold and defined structural trends. The output envelope based on a threshold (or lower grade limit) of 0.35 g/t was selected as it was deemed to best represent the mineralization. Before finalizing, it was adjusted by a few manual edits where required. The domain used for the study included all material occurring within the mineralization envelope and represented the north- to northeast- trending shear fabric to which the mineralization is related (Figure 2).
All available exploration and grade control data from the mined-out portion of the Tambali North pit informed the study. The exploration drill-hole spacing was approximately 25 m E by 25 m N and the grade control drill-hole spacing approximately 6.25 m E by 12.5 m N (Figure 2).
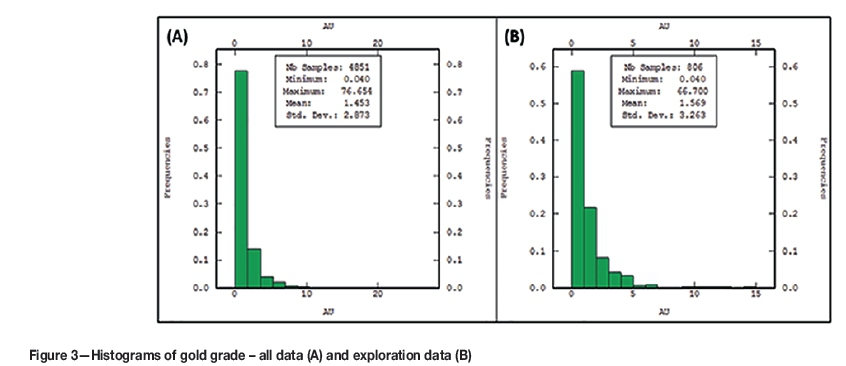
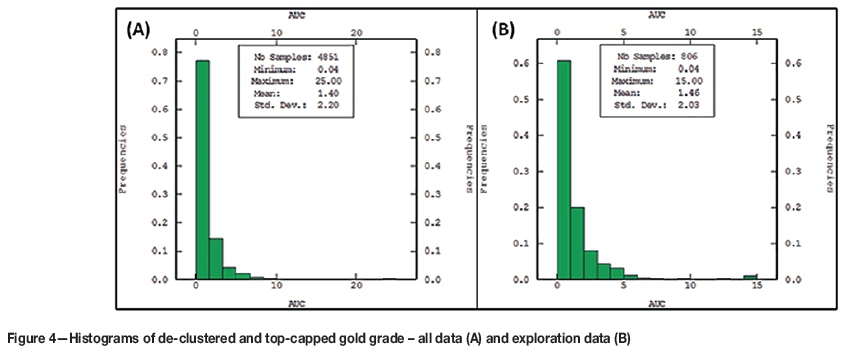
The study area contained 4851 composited grade control plus exploration samples (all available data, i.e. the dense data-set) and 806 composited exploration samples (the sparse data-set). All composites were approximately 2 m long (Figure 3).
LUC estimation
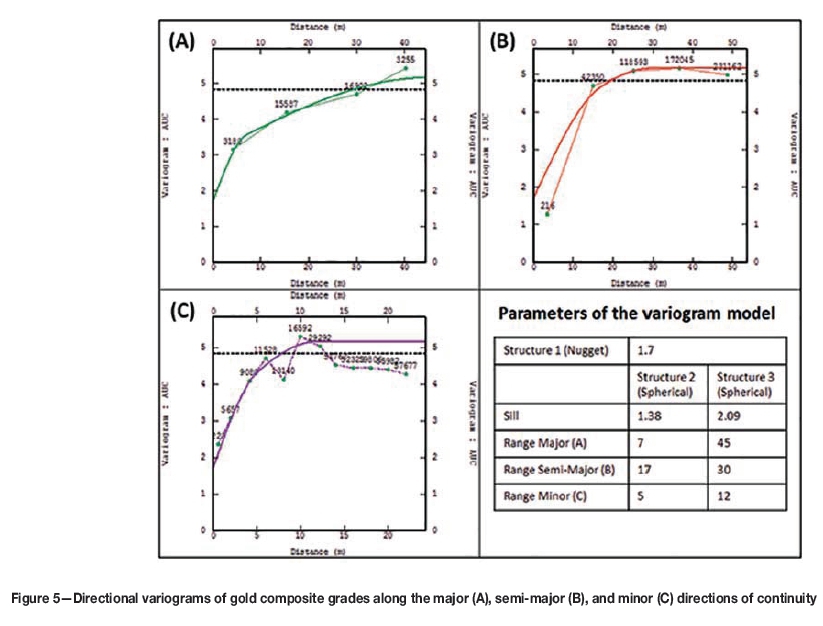
A grade capping exercise showed that capping the exploration data-set to 15 g/t and the total data-set to 25 g/t would be appropriate for estimation. The investigation of histograms, log probability plots, and mean and variance plots was used to determine suitable grade cap values. A total of four values were capped for the exploration data-set (representing about 0.5% of the data-set) and eleven values for the total data-set (representing about 0.2% of the total data-set). The two data-sets were de-clustered with the ISATIS© software, which makes use of a moving window to assign de-c1 (perpendicular to the major and semi-major planes). The experimental variogram was modelled with a nugget effect and two spherical structures (Figure 5). The relative nugget effect of this variogram, calculated as a ratio of nugget to the global sill, is approximately 33%. This variogram model has been used further in this study for all the block grade estimation using OK and UC techniques.
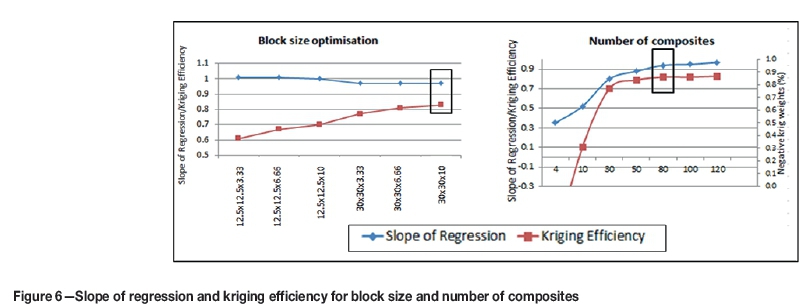
The optimal set of estimation parameters was determined by a kriging neighbourhood analysis (KNA). The kriging efficiency and slope of regression were used to investigate conditional bias for a given set of estimation parameters (Figure 6). At the chosen block size of 30 m N by 30 m E by 10 m RL and a maximum number of composites of 80, the slope of regression and kriging efficiency were satisfactory at about 0.95 and 0.82 respectively.
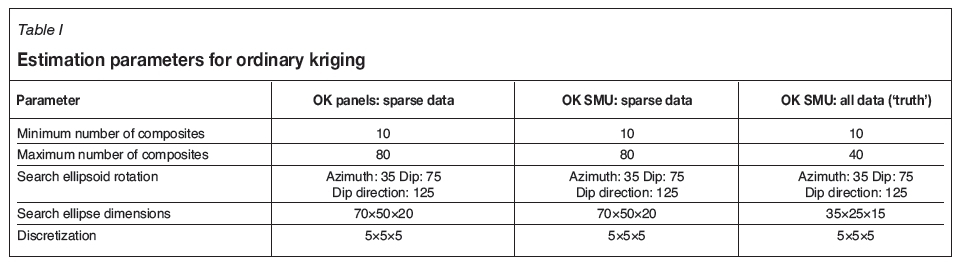
The final set of estimation parameters used for kriging are summarized in Table I.
The Tambali mining equipment supports selectivity (SMU size) of 10 m N by 10 m E by 3.33 m RL (mining of 10 m benches in 3.33 m flitches). In total, 27 SMUs fit within each panel of size 30 m N by 30 m E by 10 m RL.
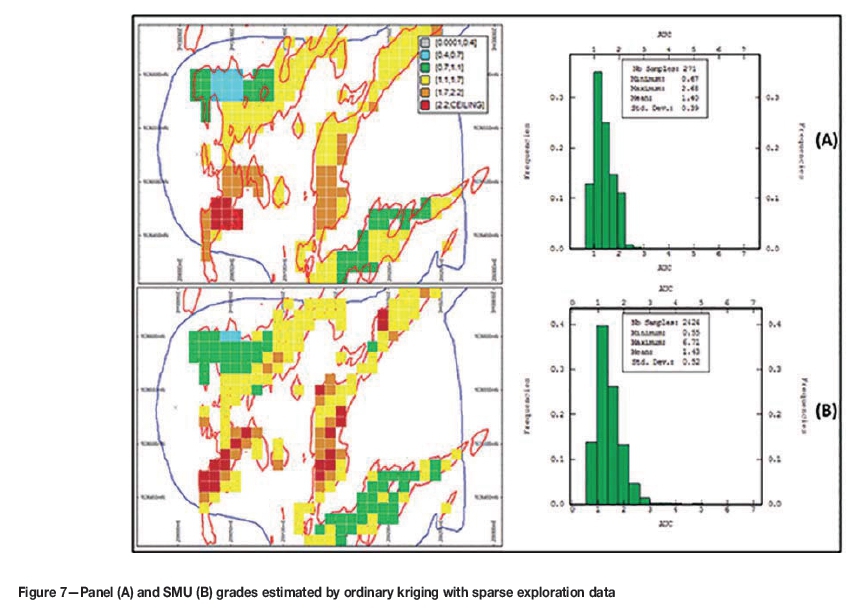
The sparse data-set (early stage/exploration) was used for kriging both the SMUs and the panels. The same variogram model and the same search neighbourhoods were used for both kriging runs (Table I). The distributions of the OK grades of the SMU and panels are compared in Figure 7 (represented by a 3.33 m horizontal slice through the block models).
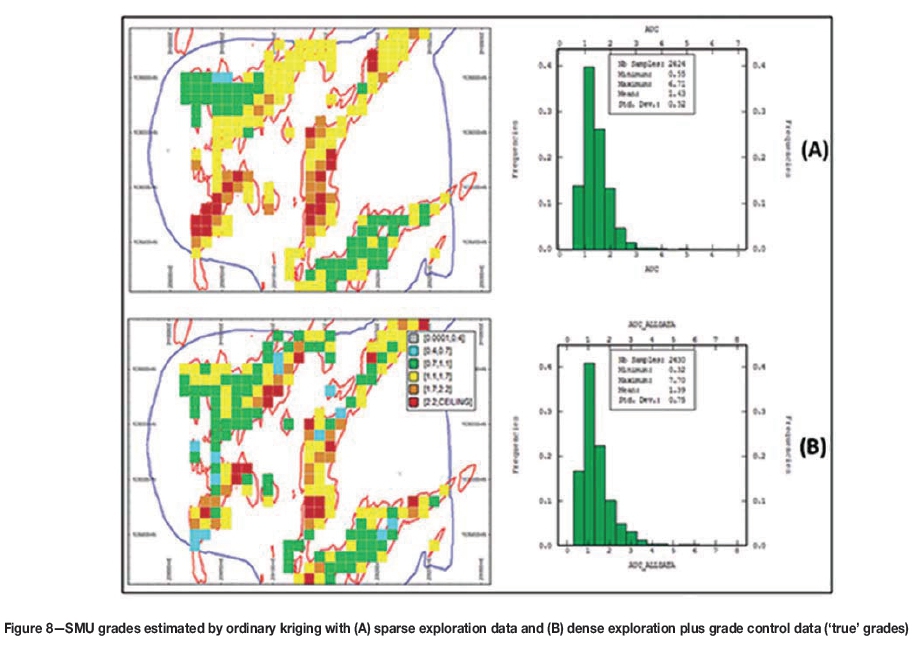
Ordinary kriging estimates of the SMUs based on all available data (dense data-set: grade control plus exploration samples) were also generated and were considered to represent the best available estimate of the SMU grades. For the purposes of this study; they are referred to as the 'true' SMU grades. The SMU estimates from sparse data were excessively smoothed in comparison with these 'true' SMU grades, as shown in Figure 8. The global mean grades were similar, but the variances differed markedly with the 'true' grade standard deviation of 0.75 much greater than the standard deviation of the sparse data estimates (0.52). As noted by Abzalov (2006), an attempt to use SMU grades obtained by kriging with the sparsely distributed data can lead to very inaccurate assumptions regarding the optimal mining scenarios.
ISATIS© software was used to model the recoverable resources from the sparse data using the conventional UC method. Correction for the information effect was made during the change of support procedure. The information effect takes account of the fact that the SMUs will ultimately be selected on an estimated grade (based on the grade control samples) instead of the real grade. Hence, some ore blocks will be misclassified as waste and vice versa. In order to obtain a more realistic recoverable estimate that takes account of this misclassification, a correction for the information effect was made by assuming that the final sampling mesh will be 6.25 m E by 12.5 m N by 2 m RL (i.e. the production or grade control sample spacing).
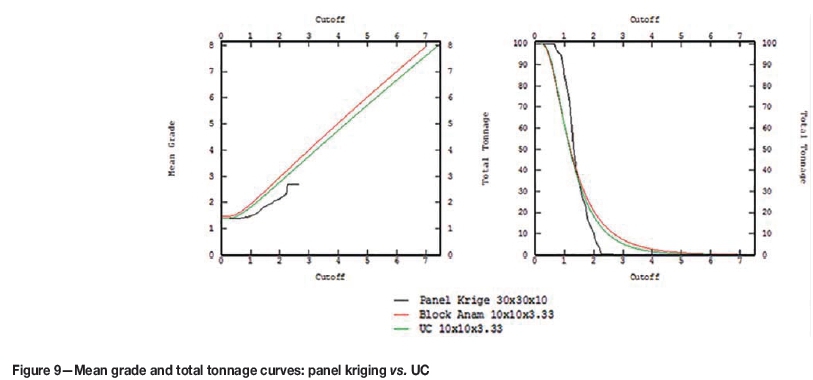
The grade-tonnage curves of the OK panel grades, the block anamorphosis function (at SMU support), and the UC grades are shown in Figure 9. Compared with the panel estimate, the block anamorphosis and the UC estimate showed greater selectivity (initial lower tons at higher grade).
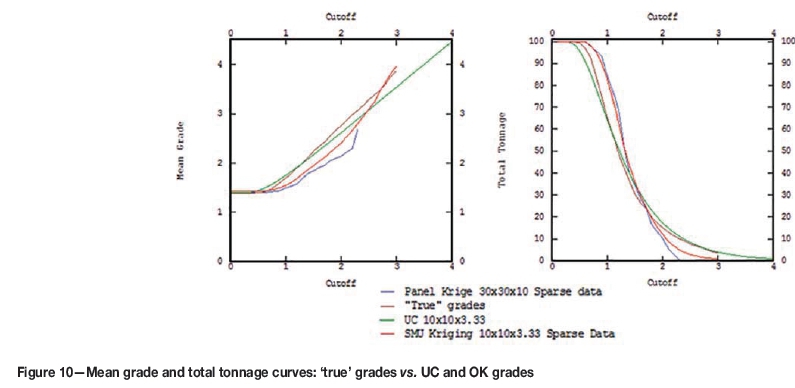
The conventional UC grade-tonnage relationships corresponded significantly better with the grade-tonnage relationships of the 'true' SMU grades than that obtained with the OK estimates from sparse data (Figure 10). The UC model represents a significant improvement in comparison with the 'unconditioned' OK estimates from sparse data.
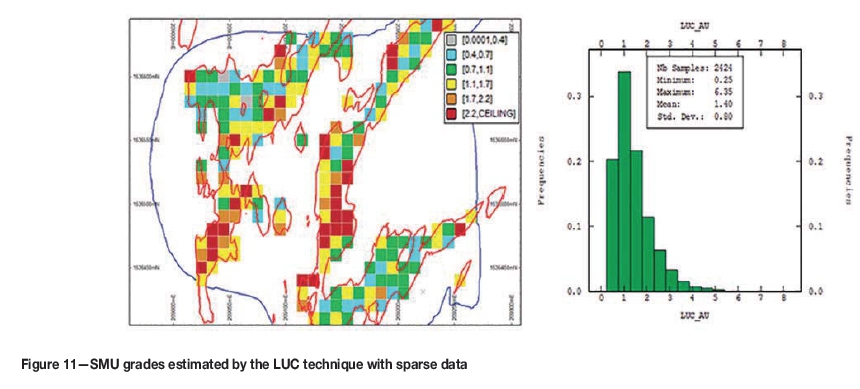
The conventional UC results were localized by the LUC technique, which involved ranking the SMU blocks within each panel (based on the OK SMU grades from sparse data) and deriving the grades of the SMU ranks from the UC model and assigning them to the corresponding SMU blocks (Figure 11).
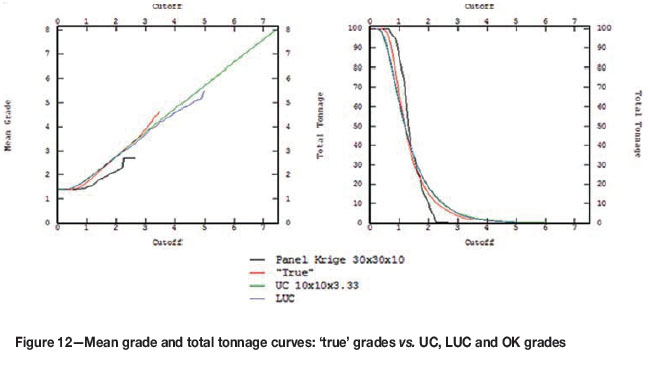
The grade-tonnage curves of the LUC estimate were very similar to those of the UC estimate (Figure 12). The good match between the grade-tonnage curves derived from UC and LUC is expected as the LUC algorithm simply localizes the UC results, maintaining the grade-tonnage relationships predicted by the conventional UC model.
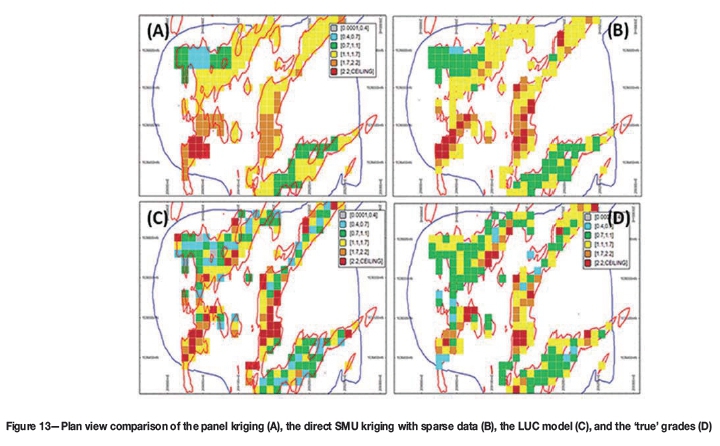
The grade distribution of the LUC estimates was less smoothed than that of the sparse data OK estimates and, compared with the 'true' SMU grades, it better represented the variability of the deposit (Figure 13). The standard deviation of the SMU grades modelled by the LUC method (SD = 0.80) was closer to that of the 'true' grades (SD = 0.75) and significantly larger than that obtained by kriging from a sparse data grid (SD = 0.52).
It is evident that the LUC estimate is a significantly better estimate of the recoverable resources than the OK estimates (from sparse data) and better represents the variability expected at the time of mining. The LUC estimate is still noticeably different from the 'true' grades. The technique itself does not make up for the fact that the LUC estimate is based on sparse (incomplete) data and that the LUC result depends heavily on the grade pattern predicted by the direct SMU kriging (also from sparse data).
Quality of the localization
The quality of the LUC localization is dependent on the meaningfulness of the grade pattern predicted by the direct kriging of the SMU (Abzalov, 2006). The resultant grade pattern is used for ranking of the SMUs into increasing order of their grade, which determines the order in which the mean grades of the UC grade classes are assigned to the SMUs.
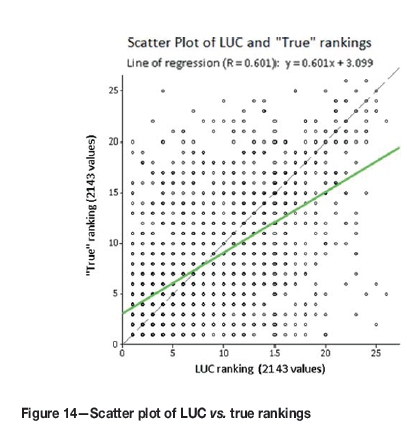
For the case study, the quality of the localization was assessed by comparing the rankings of the 'true' grades with the LUC rankings. For both data-sets, the 27 SMUs within each panel were sorted in increasing order of grade. Thus, each SMU was assigned a 'true' ranking as well as a 'predicted' (or LUC) ranking between 1 and 27. The SMUs that fell outside of the estimation domain were disregarded (the affected panels therefore had fewer ranking pairs). A scatter plot showed a reasonable correlation between the 'true' and LUC rankings with a correlation coefficient of 0.6 (Figure 14).
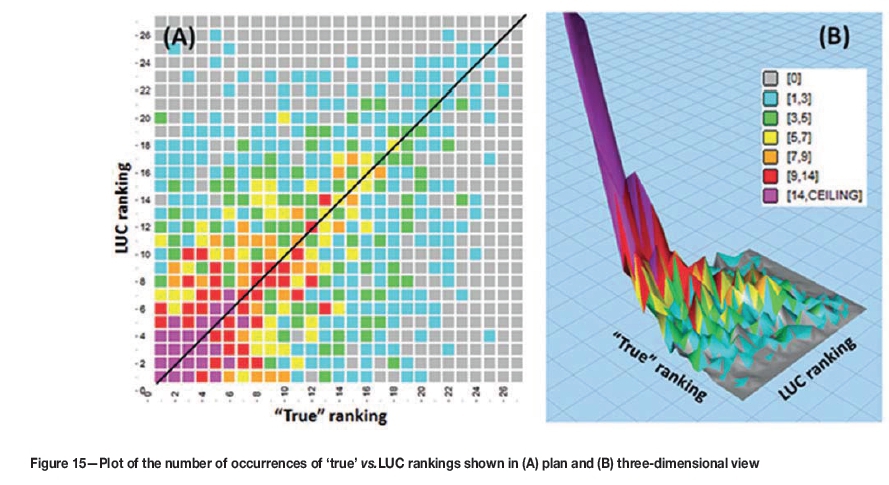
The number of occurrences of each ranking combination ('true' vs. LUC) was subsequently counted across all panels. For example, counting the number of instances where the actual and predicted ranks were both 1; then the number of instances where the actual rank was 1, but the predicted rank was 2; and so forth. The result is presented in Figure 15 and shows all possible ranking combinations for up to 27 SMUs.
The actual (or 'true') ranking is shown on the X-axis and the predicted (or LUC) ranking on the Y-axis. The colouring is based on the number of instances that a rank pair occurred.
Overall, the results showed a reasonable relationship between the actual and predicted rankings, with a significantly greater amount of predicted SMU rankings being closer to the actual rankings than further away. It can be concluded that, even though we are dealing with a deposit exhibiting high nugget effect and strong short-range variability, there nevertheless appears to be some confidence in the local positioning achieved by the LUC technique, i.e. it does not appear to be random, but shows a relationship with the 'true' positioning.
Ordinary kriging versus inverse distance weighting for SMU ranking
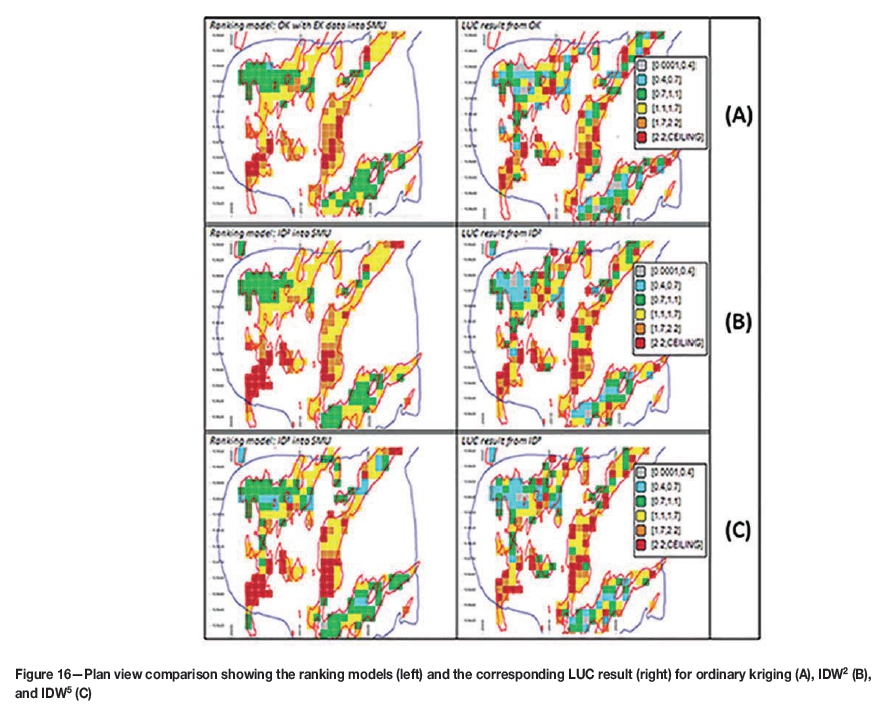
LUC can easily incorporate external information such as high-resolution geophysical data or other estimation techniques, as pointed out by Abzalov (2006). The LUC ranking determined by OK was compared with rankings obtained by inverse distance weighting (IDW) to evaluate the robustness of the OK estimation technique for determination of the rankings (Figure 16). Two IDW estimates were produced - one to the power of 2 (IDW2) and one to the power of 5 (IDW5).
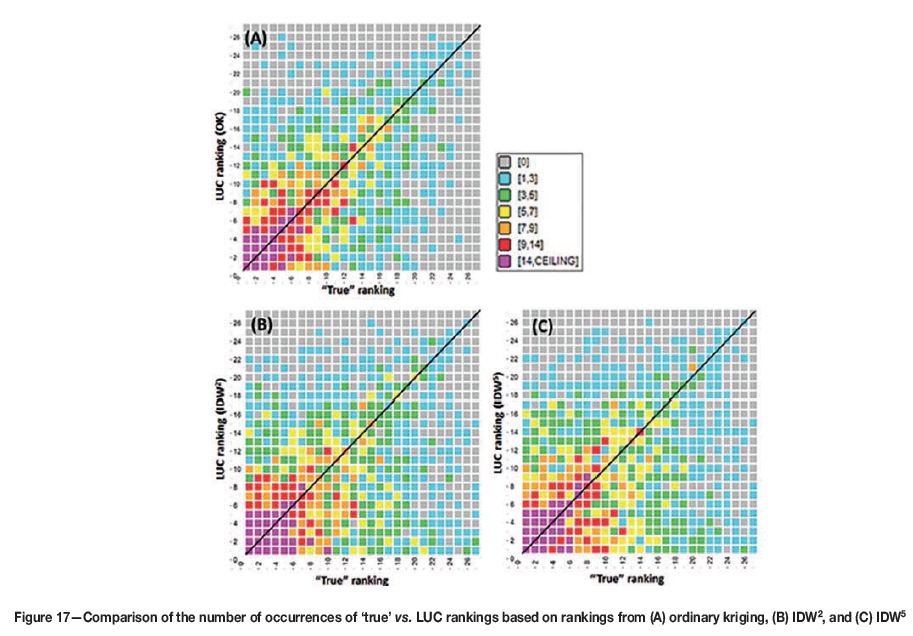
Visually, the LUC results from the OK and IDW rankings look similar, with the LUC model based on IDW rankings slightly more smoothed in comparison with that based on OK rankings. However, when comparing the rank count plots for the three scenarios (counting the number of occurrences of each ranking combination) the LUC ranking based on OK appears to be better correlated with the 'true' rankings than those based on IDW2 and IDW5 (Figure 17). In turn, compared with the IDW2 rankings, the IDW5 rankings show a better relationship with the 'true' rankings.
Grade control reconciliation
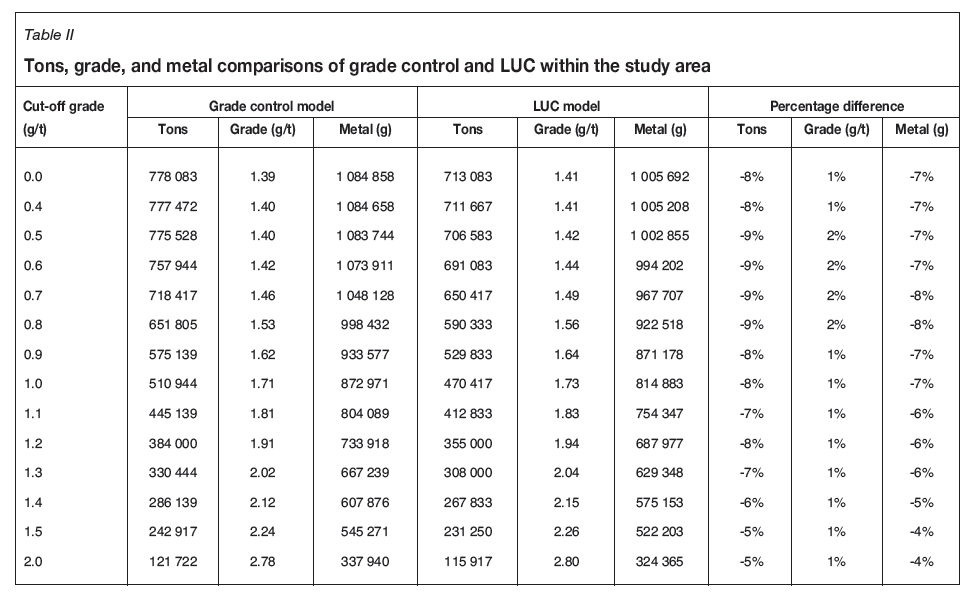
As a last check of the reliability of the LUC estimate, it was compared with the grade control model estimate over the study area (Table II). For confidentiality purposes, the grades have been factored with a constant value.
The grade control and LUC models compared well, with tons and metal within about 4-9% of each other and grades within 1-2%.
Summary and conclusions
A basic assumption of the conventional UC approach is that the locations of ore and waste within the panels are unknown. The LUC method aims to overcome this theoretical constraint by attempting to predict the spatial locations of the SMUs, but its validity is strongly dependent on the ability to confidently estimate the rankings of the SMUs within the panels.
Since 2006, the LUC method has been implemented in commercial software and has been commonly used for the estimation of recoverable resources. The LUC technique is an enhancement of the conventional UC technique and it reproduces the conventional UC grade-tonnage relationships. Even though this is the case, the validity of the localization is heavily reliant on the ability to reasonably predict SMU rankings from sparse data and the accuracy of this localization depends on the techniques used for the SMU ranking (Abzalov, 2014). It is considered that, when using direct kriging of the SMU for ranking, the presence of a high nugget effect and strong short-range variability could potentially result in inadequate localization. Accordingly, if the predictions of the SMU rankings by OK (or any other technique) are inadequate, the advantages of using the LUC approach will be more limited or LUC may even be entirely unsuitable. It is therefore deemed necessary to assess the quality of the localization before accepting a LUC result. In the mined-out area of an active open pit, one could achieve this by comparing the rankings of the SMUs based on close-spaced grade control data with the rankings based on sparse exploration data (as was done in this study). In an unmined pit with no close-spaced data, it is more difficult to assess the quality of the localization. However, one could attempt to improve the rankings from the direct kriging of the SMUs by integrating them with auxiliary data such as geophysical or geochemical information as proposed by Abzalov (s2014).
In the current study, the LUC technique was implemented for the mined-out portion of a typical Birimian-style gold deposit (mined by open pit methods) to model the grades of SMU-sized blocks from sparse, early-stage data. The LUC grade-tonnage relationships closely matched the conventional UC grade-tonnage relationships and better predicted the grade-tonnage relationship of the 'true' grades than those derived from ordinary kriging. In order to assess the quality of the LUC localization, the direct SMU kriging rankings (based on sparse data) were compared with the grade control model rankings (based on close-spaced data and the best available estimate of the deposit). The results showed a reasonable relationship between the actual and predicted rankings and it was concluded that, even though the grade patterns predicted by the direct kriging of the SMUs may be less meaningful for deposits exhibiting strong short-range continuity, there nevertheless appears to be some confidence in the local positioning achieved by the LUC technique. Therefore, it is considered that the use of the LUC technique may be useful for this style of deposits.
References
Abzalov, M.Z. 2006. Localised uniform conditioning (LUC): a new approach for direct modelling of small blocks. Mathematical Geology, vol. 38, no. 4. pp. 393-410. [ Links ]
Abzalov, M.Z. 2014. Localised uniform conditioning (LUC): method and application case studies. Journal of the Southern African Institute of Mining and Metallurgy, vol. 114, no. 3. pp. 205-211. [ Links ]
Abzalov, M.Z. and Humphreys, M. 2002. Resource estimation of structurally complex and discontinuous mineralisation using non-linear geostatistics; case study of a mesothermal gold deposit in northern Canada. Exploration and Mining Geology Journal, vol. 11, no. 1-4. pp. 19-29. [ Links ]
Assibey-Bonsu, W. and Deraisme, J. 2011. Localised uniform conditioning in the multivariate case: an application to a porphyry copper gold deposit. Proceedings of the 35th International Symposium on Computer Applications in the Mineral Industries (APCOM 2011), Wollongong, Australia, 24-30 September 2011. Baafi, E.Y., Kininmonth R.J., and Porter, I. (eds.). Australasian Institute of Mining and Metallurgy, Melbourne. pp. 131-140. [ Links ]
Assibey-Bonsu, W. and Krige, D. 1999. Use of direct and indirect distributions of selective mining units for estimation of recoverable resources/reserves for new mining projects. APCOM '99, Proceedings of the 28th International Symposium on Computer Applications in the Mineral Industries, Colorado School of Mines, Golden, CO., 20-22 October 1999. Dagdelen, K. (ed.). Colorado School of Mines. pp. 239-244. [ Links ]
Assibey-Bonsu, W. and Krige, D. 2001. Valuation of recoverable resources by kriging, direct conditioning or simulation. Proceedings of the 29th International Symposium on Computer Applications in the Mineral Industries, Beijing, 25-27 April 2001. AA Balkema. pp. 3-8. [ Links ]
Geovariances. 2015. Localized multivariate uniform conditioning: estimate recoverable resources at mining unit scale. http://www.geovariances.com/en/resources-white-papers-ar967 [Accessed 19 May 2016]. [ Links ]
O'Connor, M., Bertoli, O., and Titley, M. 2012. Estimating recoverable uranium resources using uniform conditioning - a case study on the Mkuju River uranium project, Tanzania. Proceedings of the 2012 AusIMM International Uranium Conference, Adelaide, South Australia, 13-14 June 2012. Australasian Institute of Mining and Metallurgy, Melbourne. [ Links ]
This paper was first presented at, The Danie Krige Geostatistical Conference 2015, 19-20 August 2015, Crown Plaza, Rosebank.

