


Serviços Personalizados
Artigo
 Inglês (pdf)
 Artigo em XML
 Referências do artigo
Indicadores

Links relacionados
-
 Citado por Google
 -
 Similares em Google
Compartilhar

 Permalink
Journal of the Southern African Institute of Mining and Metallurgy
versão On-line ISSN 2411-9717
versão impressa ISSN 2225-6253
J. S. Afr. Inst. Min. Metall. vol.114 no.8 Johannesburg Ago. 2014
Designing an advanced RC drilling grid for short-term planning in open pit mines: three case studies
J.M. Ortiz; E.J. Magri
ALGES Laboratory, Advanced Mining Technology Center, Department of Mining Enginnering, University of Chile, Santiago, Chile
SYNOPSIS
This paper shows the usefulness of geostatistical conditional simulation combined with the quantification of sampling errors obtained from the analyses of fundamental errors - validated from duplicate data - to assess the relevance of the quality and quantity of the information, for short-term mine planning purposes.
Traditional blast-hole drilling equipment has been designed for efficient drilling, but not for obtaining high-quality samples. Furthermore, blast-hole sampling interferes with production, and thus usually produces poor-quality results. These results are the basis of short-term plans, where the grades of selective mining units are estimated and used for distinguishing between ore and waste. Under these conditions, misclassification (ore blocks sent to the waste dump and waste blocks processed at the plant) is inevitable, leading to significant hidden losses that can amount to millions of dollars per annum.
Reverse circulation drilling with the latest automated sampling technology improves significantly the quality of the information used for short-term planning, and thus reduces misclassification, improving the financial returns of the operation.
In this paper, we present the general methodology for assessing the effect of poor blast-hole sampling, as compared to advanced reverse circulation drilling grids at several spacings, in order to arrive at the most appropriate grid for short-term planning. This plan can be prepared well in advance using several additional variables that are usually not available when the plan is based on blast-hole samples. Furthermore, blending options can be analysed in order to optimize plant recovery, minimize the use of sulphuric acid, etc.
Three case studies are presented, namely a typical porphyry copper deposit, an exotic oxide copper deposit, and a complex gold deposit, where mineralization is controlled by structures and lithology. This paper shows that in all cases, advanced reverse circulation drilling grids provide good-quality information that, coupled with the use of geosta-tistics for short-term mine planning, significantly improve the financial returns of the operation.
Keywords: geostatistics, conditional simulation, misclassification, grade control, sampling error.
Introduction
Short-term decisions in mining operations are related to defining the destination of material blocks, either to the processing plants, low-grade stockpiles, or the waste dump. These decisions are usually based on the grade control estimates built from information gathered from samples taken specifically for this, from blast-holes (Deutsch et al., 2000; Ortiz et al., 2012). However, it is well known that the quality of these samples is poor due to many reasons. Firstly, blast-hole samples are taken within the production cycle, with significant time and space constraints, since this must be done before charging the blast-holes with explosives. Chemical analysis results, in some cases, are not returned in time to build the short-term plan, and the destination of the blocks may be defined without having the analytical results at hand, with a significant risk of misclassification. Secondly, sampling is done by a variety of methods, such as using a radial bucket placed under the drilling rig platform; taking a number of increments from the cone by means of a tube in order to complete the weight of the required sample; or taking a channel sample from the cone, among others. A correct sample must comply with the requirements of sampling theory. Experience has shown that this seldom occurs; in fact, most of these methods suffer from severe delimitation and extraction errors, not to mention segregation-related biases.
It is well known that sampling is an essential part of the resource modelling process, since if samples are of poor quality, the entire model is weak (Rolley, 2000). Furthermore, sampling operators are in many cases poorly trained and do not really understand the importance of applying a rigorous procedure during sampling. Night shifts make things worse, as little control is possible during these shifts, and there is frequently insufficient light for the operators.
The significance of poor blast-hole sampling has already been demonstrated (Magri and Ortiz, 2000). A random error around the true block values affects the decision regarding the destination of such blocks: to either the processing plants, to a stockpile, or to the waste dump. Furthermore, a systematic bias may have large economic impacts on a project and due to the nature of blast-hole drilling and sampling, bias can originate from multiple sources. Therefore, sampling theory must be followed with as much care as possible to reduce the losses due to poor sampling (Francois-Bongarcon, 1983; Pitard, 1993; Assibey-Bonsu, 1996; Magri, 2007; Pitard, 2009).
Poor samples lead to poor short-term plans. Furthermore, short-term plans should incorporate as many variables as possible that are relevant for ore processing, and estimation techniques that satisfy some requirements such as global and conditional unbiasedness and precision. The effect of all economic and detrimental elements must be taken into account to arrive at the best decision as to whether a block is profitable or not. Thus, a precise estimation of all the relevant variables is required in order to obtain a proper assessment of the best destination of each block. In addition to this already challenging setting, when different variables are correlated, and they all have an impact on the process, their spatial distributions should be co-simulated so as to consider the cross-correlations in space for the best assessment of the blocks' value. In summary, in order to maximize profits, the final models built for deciding the destination of the blocks must be globally and conditionally unbiased and as precise as possible. Unfortunately, misclassification is not directly reflected in the company's books since it leads to hidden losses: some ore blocks end up in low-grade stocks or in the waste dump, while some waste blocks are processed and do not pay for their treatment.
The following section contains a brief review of geostatistical techniques and presents the methodology for performing conditional simulations to assess the economic benefit of improving sampling quality and determine the best advanced drilling spacing to improve the financial returns of the mine, in addition to determining the best grade control approach to achieve this goal.
The geostatistical framework
Geostatistics was originated to solve prediction problems in gold mines in South Africa (Krige, 1952). The apparent random, yet structured, behaviour of gold grades triggered the formulation of a probabilistic approach, where the grade value at an unsampled location, z(u), is related to a random variable, Z(u), characterized by a probability distribution. The structured behaviour is accounted for by relating random variables at different locations by means of a random function, {Z(u), u-D}. This random function is in turn characterized by its statistical moments, which must be inferred from the available data, that is, the values gathered at sample locations {z(uα), α = 1, ..., n}. The spatial distribution of actual values of the variable within the domain is interpreted as a realization of this random function.
The geostatistical paradigm consists of estimating the expected value of the random variables at every location to obtain a map suitable for local optimum prediction or constructing other realizations of the random function to characterize the uncertainty associated with unsampled locations, preserving the spatial relationships between locations. This is achieved through estimation and simulation techniques respectively. Results of these estimation and simulation processes are controlled by the definition of the domains where the random functions are defined. These domains are established by understanding the geology, and integrating this knowledge to the statistical analysis done during the exploratory data analysis. Poorly defined geological domains for estimation and simulation will inevitably lead to poor estimates and inaccurate uncertainty quantification.
Estimation is done by considering a linear estimator that depends on the surrounding information available. In geostatistics, this estimator is called kriging in honour of Danie Krige, who proposed this approach in the early 1950s. Kriging is the best linear unbiased estimator (Journel and Huijbregts, 1978; Isaaks and Srivastava, 1989). The kriging estimator is constructed by successively imposing these features (linearity, unbiasedness, optimality). Variations of the estimate are achieved by imposing a known or unknown mean, and allowing local variations of it (Goovaerts, 1997). Kriging is the best estimator in the least-squares sense that is, it imposes the minimization of the error variance. The simple kriging estimate assumes the mean known and constant, and is at the heart of simulation procedures:

The estimation variance results in:

where σ is the variance of the population, which is estimated from the sample data, C(uα, u0) is the covariance between the data located at ua and the location of interest u0, and
  are the optimum weights to minimize this error variance. This variance gives a basic measure of uncertainty of the estimated value. However, as seen in Equation [2], this does not depend on the sample values themselves, but only on their locations. Therefore, the kriging variance measures the uncertainty at the estimation location due to the spatial configuration of the available data for its estimation, rather than based on the dispersion of the values.
The kriging weights are obtained from solving the following linear system of equations, which arises from imposing the minimization of the error variance:
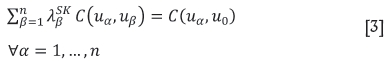
In practice, simple kriging is not used, but rather, the mean of the random variable is assumed unknown, but constant within the neighbourhood where samples are searched to be used in the estimation. This is a convenient choice, since it provides a robust estimator to changes in the local mean. This estimator is known as ordinary kriging. Its derivation follows the same steps as in simple kriging (linearity, unbiasedness, optimality), but owing to the assumption that the mean is unknown, it requires the kriging weights to add up to unity, to ensure unbiasedness. The estimate and estimation variance for ordinary kriging are:
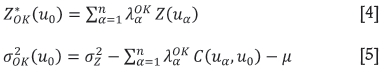
The system of equations requires an additional constraint over the weights, to prevent a weighting bias:
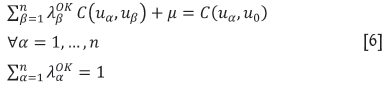
In these equations, µ is the Lagrange multiplier required to impose the constraint over the weights.
Ordinary kriging is commonly used to estimate block grades for long-term planning, using the samples from the exploration drilling campaign, and also in the short term to build the grade control model (although other geometric estimation techniques may also be used, such as inverse distance weighting). When blocks are estimated, average covariances are used to obtain the point to block relationship in Equations [5] and [6], instead of the point-to-point covariances presented. These average covariances are computed numerically by discretizing the block into points and averaging the covariances between these points and the sample location. Additionally, the block variance must be used in Equation [5], which can be calculated by volume-variance relations.
Estimation allows obtaining the best prediction in terms of precision. The idea of simulation is to provide alternate realizations of the random function, in order to quantify the uncertainty over a transfer function that acts over different locations on the domain. The actual values are interpreted as one possible realization of this random function, therefore each resulting realization performs like the actual deposit and can be used for risk assessment and uncertainty quantification. The main difference between estimation and simulation is that the former looks for the best local estimate, while the latter is concerned with reproducing the spatial characteristics that relate multiple locations.
There are several approaches to simulating a random function; most of them are based on a multigaussian assumption that relieves the inference of the probability distribution characterizing every location. Under this assumption, the random variable can be linked to a Gaussian-shaped probability distribution, whose expected mean and variance are identified with the simple kriging mean and kriging variance (Equations [1] and [2]). Simulated values are drawn directly from this local distribution and the spatial correlation is imposed through a Bayesian framework, by sequentially conditioning the inference of the probability distribution at a given location on the previously simulated values at other locations (Journel, 1974; Deutsch and Journel, 1998). Since most variables are non-Gaussian, this approach is implemented after a transformation of the distribution into a standard Gaussian distribution. This calls for the representative grade distribution, which sometimes requires declustering to compensate for spatial redundancy and preferential sampling. The steps required in sequential Gaussian simulation are:
1. Transform the sample values to their corresponding normal scores. This requires having a representative reference distribution that may have been obtained after declustering the available data.

where φ is the quantile transformation from the reference (representative) Z distribution to a standard Gaussian distribution Y, and N is the total number of samples
2. Define a random path over the M locations [ui, i = 1,...,M} where the variable is simulated.
3. At every location, compute the simple kriging estimate and kriging variance of the transformed grade Y, using Equations [1] and [2]. These allow the exact estimation of the conditional expectation and conditional variance of the random variable under the multigaussian assumption. Note that the mean of the normal scores is 0. The conditioning information is composed by the normal scores of the sample data and the Gaussian values of the previously simulated nodes within the search neighbourhood.
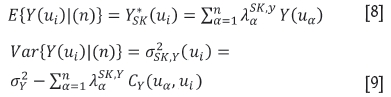
where the index Y has been added to emphasize that these are the estimate and variance of the transformed variable; the covariance function is also inferred from the normal score sample data. The variance of the point support distribution.
is 
4. Draw a simulated value from the conditional distribution characterized by a mean equal to the simple kriging estimate, a variance equal to the simple kriging variance, and Gaussian shape. This is done by Monte Carlo simulation, that is, a uniform random value between 0 and 1 is generated and the corresponding quantile of the conditional distribution is taken as the simulated value of the Y variable. The simulated value is used as conditioning for all subsequent nodes in the random path.
5. Back-transform the Gaussian simulated values to the grade distribution by reversing the transformation on step 1.

Note that the result of this process is a conditional realization of the random variable at the simulation locations {ui, i =1,...,M}. New realizations can be obtained by changing the random path, and by changing the values drawn from the conditional distributions at the Monte Carlo simulation step.
Other methods to simulate multigaussian random functions exist and could also be used (see for example Chiles and Delfiner, 1999).
Simulation trades off the local precision obtained in kriging to reproduce the spatial continuity of the variable. The distribution of simulated values at every unsampled location provides a measure of uncertainty and, contrary to the kriging variance, this uncertainty is data-value dependent. This is highly convenient in most applications where some relationship is seen between variability and local mean. More importantly, each realization can be treated jointly to compute the output to any transfer function, where the joint distribution at different locations has an impact on the final output. This occurs on flow, mine planning, and pollution problems.
Once each realization has been processed to infer a given response to a process, the set of responses over the suite of realizations provide a quantification of the distribution of this response, which is useful for risk assessment (Glacken, 1997; Journel and Kyriakidis, 2004).
Methodology
Evaluating the financial output of a given drilling grid requires understanding the spatial variability of the grades within the deposit. Conditional simulation helps create possible realizations of the true distribution. Each one of these realizations can be used to compare the performance of a given combination of drilling density and sample quality.
The process is demanding, since the economic performance assessment must be repeated for each of the realizations built with conditional simulation. In order to obtain realistic financial outputs, several input parameters must be known: economic parameters such as mining and processing costs, drilling, sampling and assaying costs, sale price of the elements of interest, as well as metallurgical parameters in order to assess the short-term performance, etc.
The general methodology is as follows.
Determine the current and expected sample quality considering the drilling equipment available
Sampling errors emanating from blast-hole data can be assessed by QA-QC analysis of field duplicates and fundamental error calculations. This error becomes the current value and is added to the simulated grades that represent exact values, since they are obtained from exploration data which has very small errors. However, the blast-hole drilling recovery, which is very poor at the top of the bench already broken up, cannot be assessed by QA-QC, therefore the value computed from field duplicates can be considered lower than the actual error.
Additionally, sampling errors from more sophisticated RC equipment can be assessed. The use of sampling theory and the design of the sampling and sample preparation protocols will provide the calculation of the fundamental error of the new procedure. This value can be seen as the achievable improved situation. These errors will also be added to the simulated grade values that represent exact values.
Build multiple dense conditional realizations of the distribution of grades within the domain, considering all relevant short term planning variables
A set of dense conditionally simulated realizations of the grades within the geological units of the deposit must be built using simulation techniques and appropriate software. If significant cross-relationships exist between variables, then co-simulation should be tried, in order to preserve those relationships. Conditioning is provided by the exploration drill-hole samples, which may be diamond drill-holes and reverse circulation holes.
The sampling, sample preparation, and assaying error of these samples must also be assessed, although this error usually is significantly lower than the one associated with blast-hole drilling recovery and blast-hole samples, and could be considered negligible, except when coarse gold is present.
The goal of having dense realizations is to be able to sample them at several spacings, each representing a drilling spacing for advanced RC drilling, and evaluating the economic benefit of using that information and a given grade control methodology to select blocks to be processed, assessing their metallurgical performance and final revenue.
Furthermore, these dense realizations are block-averaged to obtain a representation of true block grade distributions, which in turn will be used to evaluate the short term plan performance.
Sample the dense realizations at different spacings emulating the blast-hole grid as well as the advanced reverse circulation drilling grids and add the corresponding sampling error to each of them
By sampling from each of the realizations, simulated values are obtained for locations representing regular sampling grids. The spacing of these grids represents the different drilling grids. The values obtained from this 'sampling procedure' over the dense realizations can be considered as the exact true grade at the corresponding locations. However, in practice, samples carry error. Therefore, a random Gaussian error is added to these exact values, to reflect the information quality, which can vary from minimum error samples obtained through high-technology RC equipment to large errors for traditional blast-hole sampling. It should be mentioned that blast-hole samples also carry non-random errors which may have significant consequences. These errors are hard to quantify, thus they have not been accounted for in this analysis. However, final results should be discussed considering this issue.
The simulated value with sampling error is obtained by Monte Carlo simulation from a Gaussian distribution with mean equal to the original simulated value at the location of the blast-hole sample: Zl(ui), where l represents one of the realizations; and variance equal to the fundamental error relative variance computed in the previous step multiplied by the sample value squared:  · (Zl(ui))2.
For each realization l =1,...,L, multiple sample data-sets are obtained, one for each drilling grid spacing and sampling error evaluated.
Emulate the short-term plan strategy over each of the realizations
Each of the sample data-sets obtained in the previous step, which represent a combination of information quantity (sample spacing) and quality (sampling error), can be used to predict the block grades, using the short-term planning strategy that is to be assessed. Different estimation procedures (inverse distance weighting, ordinary kriging) and parameters (minimum and maximum number of samples to be used in estimation, minimum number of samples per octants, number of octants informed, search radii, etc.) can be considered at this stage.
The result of this step is a model of estimated block grades similar to the one used for grade control, which will be more precise when more information is available and when this information is of higher quality, but this will come at a higher cost due to the additional drilling required for dense grids. Accuracy, however, is not necessarily better than in the original model if the multiple potential biases that occur during blast-hole drilling and sampling are not accounted for. This suggests much more research is required to understand, quantify, and model all the sampling errors present in blast-hole sampling.
Compute the revenue for each combination of sample quantity, sample quality, and estimation procedure, and compare to the maximum unachievable profit that could be obtained without misclassification i.e. using the true block grades stored in step 2
For each drilling grid spacing and sampling error considered, the block grades can be estimated and the profit of processing those that are considered ore and dumping those that are considered waste (based on the estimated block grades, which are obtained with the samples with error) can be calculated. Revenue considers the following components:

where
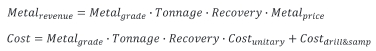
In these equations, Royalties depends on the mining tax laws of each country, Recovery is usually a function of the Metalgrade and other detrimental elements, as well as the type of process considered. Costunitary is the cost per weight unit of the commodity under consideration. This cost will usually be composed of several items:

The cost of drilling and sampling (includes sample preparation and analysis) is added to the equation to account for the additional cost required to acquire the information given by a specific drilling grid.
The ideal (unachievable) case where all true block grades are known can also be assessed for each realization and can serve as an upper bound of the profit. This case can be evaluated because the 'true' block grades can be obtained from averaging the densely simulated points without adding any sampling error (step 2).
The best drilling grid with respect to the maximum revenue can be defined by comparing revenues obtained from the grade control model based on the blast-hole samples (with large sampling error), and those based on the RC sampling grids (with minimum error), for each of the grid spacings considered.
Three case studies
In this section, the methodology is applied to three case studies.
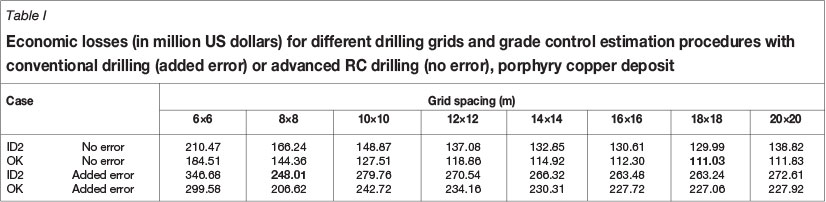
Case 1: Large porphyry copper deposit
The first application is performed on a porphyry copper deposit operated by open pit mining and producing both oxides and sulphides. The deposit shows a fairly typical configuration of lithology, including andesite, porphyry, and breccia, covered by ignimbrites and gravel. Mineralization units are characterized by a sequence of barren gravels at surface, followed by a leached cap, oxides, secondary sulphides, and a hypogene zone. Alteration zones are mainly due to the presence of clay, which defines ore types that have different behaviour during leaching.
The long-term geological model is used as a reference to identify the estimation units. Total and soluble copper are the relevant variables. Since their relationship is complex due to the mineralogical constraint (total Cu ≥ soluble Cu), solubility ratio and total copper are simulated at point support, on a 2 W 2 W 10 m grid, over a domain representing the next 5 years of production. For each of these realizations, soluble copper is deduced and block averaging is performed over the grades (not over the solubility ratio) to 10 W 10 W 10 m blocks. Global relative errors for total and soluble copper are obtained from duplicate blast-hole sampling data. These are 14% and 15% respectively. These numbers are optimistic, since they do not account for recovery problems.
Sampling grids ranging from 6 W 6 m to 20 W 20 m are assessed and relative errors are added to emulate the blast-hole sample quality. Also, the case of advanced RC drilling is considered by not adding error. It is assumed that the RC error is negligible and already included in the realizations since these were obtained from exploration data that had a high proportion of RC drill-holes.
Short-term planning is currently done with inverse distance squared estimation with few samples (minimum 1 and maximum 6). An estimation plan based on ordinary kriging is assessed considering a larger number of samples (minimum 4, maximum 16).
Revenue and profits were calculated using actual costs and the two short-term planning methodologies mentioned earlier. Several sensitivity analyses were performed to evaluate the robustness of the proposed advanced RC grid spacing. In particular, the decision was tested by changing the commodity price, the drilling cost, by adding a systematic underestimation bias to all blocks, and by considering a reduction in the geological classification of each block, from 5% to 2% over the entire domain.
The current situation, that of blast-holes on an 8 W 8 m grid, can be improved by considering the increased cost of RC drilling and the increased profit due to the better geological classification of the blocks and higher precision in the estimation of the grades. Results are shown in Table I, where the economic losses in eight cases of drilling grids are presented, as well as the four main grade control estimation cases: inverse distance squared weighting and ordinary kriging, with no added error (emulating an advanced RC drilling system dedicated to obtaining samples for short-term planning) and with added error (emulating conventional blast-hole sampling). It should be noticed that for the 8 W 8 m grid, losses of inverse distance and kriging when considering the added error situation are low because they do not require additional drilling other than that already considered in the mine cost for blasting. If the error is to be reduced by advanced RC drilling, then these holes have to be drilled specifically for this purpose, incurring additional cost.
The final recommendation was to move from the current blast-hole sampling on an 8 W 8 m grid, to drilling with the RC system on an 18 W 18 m grid, which carries a reduction in losses due to misclassification of ore blocks that reaches US$130 million over a 5-year period.
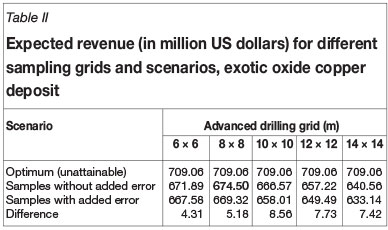
Case 2: Exotic oxide copper deposit
In this case study, the procedure was applied to an exotic copper deposit, which is mined by an open pit operation using 7.5 m high benches. The ore is processed through heap leaching, solvent extraction, and electrowinning to produce copper cathodes. Drilling is done by conventional DTH drilling since the presence of moisture and clay impeded the use of the advanced RC drilling system that was in place. In this case study, a production period of 5 years was evaluated.
Ten realizations were built respecting the geological domains, which are based on grade shells for the case of total copper grades, and on clay-controlled units, for carbonates. These realizations were built in a 2 W 2 W 7.5 m grid. The short-term model consists of blocks 6.25 W 6.25 W 7.5 m in size. Estimation of the selective mining units is done by ordinary kriging with a minimum of 3 and a maximum of 12 samples.
Sampling errors are assessed from duplicate data, resulting in 16% relative error for total copper and 20% relative error for carbonates.
Advanced sampling grids at 6 W 6 to 14 W 14 m centres in increments of 2 m were analysed.
The economic performance of each combination of advanced sampling grid and sampling error was analysed using the grade control estimation parameters as well as the mining and economic parameters provided by the operations and metallurgy teams. These include acid consumption estimation based on the total copper and carbonate grades, and copper recovery, which also depends on these grades.
Results in Table II show that the current sampling error obtained with the conventional DTH drilling rig costs about US$5 million for the 5-year period and the 8 W 8 m drilling grid, which is the closest to the unattainable optimum (highlighted in bold). This money could be used for improving the sampling system, to move towards a more sophisticated RC drilling rig that can deal with the moisture encountered.
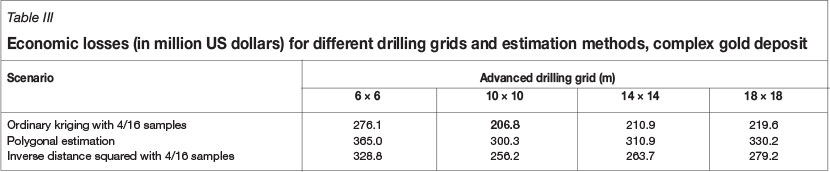
Case 3: complex gold deposit
The third case study involves a structurally controlled gold and silver massive deposit. Estimation units were defined based on the orientation of the controlling structural trends, which generated vertical mineralized volumes with widths ranging from about 10 m to 30 m. In addition to these structures, a central breccia contains disseminated mineralization. Bench heights of 8 m and 16 m were considered for the structurally controlled and disseminated mineralization areas respectively.
Automated sampling procedures were recommended for this operation due to the climatic conditions under which drilling is to be done. High winds and low temperatures hinder the possibility of obtaining good blast-hole samples, especially during the winter months. Therefore, a dedicated RC drilling rig with an automated sample capture system was considered in order to improve the quality of the information used to build short-term models and to ensure representative samples free of segregation error due to loss of fines and particle size segregation. Inclined RC drilling (60°) produces relative errors lower than 8% using sampling ratios of 4% and 2% in 8 m and 16 m benches respectively.
In this particular case, since blast-hole sampling is not feasible, the advanced drilling grid spacing optimization is reduced to balance out the advanced RC drilling, sampling and assaying costs versus block misclassification. Thus, a dense RC grid reduces losses due to misclassification but is more expensive; on the other hand, a sparse drilling grid is inexpensive but increases the losses due to misclassification.
The procedure was applied over the two distinct areas of the mine, producing slightly different results, due to the different bench heights and grade continuity in each zone. Sensitivity analysis was performed to assess the effect of changing the short-term estimation parameters to obtain the block grades from the samples obtained from the advanced drilling grids. Ordinary kriging with a minimum of 4 and a maximum of 16 samples outperformed all other estimation methods (inverse distance, nearest neighbor estimation and kriging with fewer samples).
Results in Table III show an improvement of US$50 million over a 5-year period when using ordinary kriging over inverse distance estimation on a 10 W 10 m advanced RC drilling grid.
Conclusions
Simulated models of the distribution of grades and geological units can be built with conventional geostatistics software. Dense simulated models can be used to represent the true distribution of grades within a deposit. Several procedures can be emulated over these dense realizations, to evaluate the cost and benefit of many decisions. In this paper, we show that these models can be used to assess the cost of changing the drilling technology for short-term planning, and improving the sampling and sample preparation errors.
Three case studies are presented, showing that moving away from blast-hole sampling, which is well known for producing poor-quality drilling recovery and poor-quality samples, provides significant economic benefits that reach millions of dollars per annum.
The change in drilling and sampling technology for short-term planning results in better drilling recovery and better samples, without loss of fines, with increments that correctly represent the lot, and with improved health and safety conditions for drilling rig operators. The benefits of this change can be evaluated by processing the geostatistical realizations built (which represent the spatial variability of the orebody) in order to emulate the sampling procedure, sample quality, and estimation procedure. Grid optimization is carried out by quantifying the costs and revenues related to the different sampling grids.
The three case studies reveal that when operating conditions allow for a dedicated drilling rig, it is worth considering investing in a sophisticated sampling system mounted on an RC drilling rig to operate well in advance, thus providing timely data for building short-term models that can include several additional relevant variables.
Once validated dense simulations are available, sensitivity analyses can be easily performed in order to ensure that the recommended drilling spacings are robust with respect to changes in the economic and metallurgical conditions.
The results presented in this paper are optimistic in the sense that they do not account for additional errors due to poor recovery, and thus can be considered as a minimum in terms of the losses that the mines actually experience due to sampling problems.
Acknowledgements
The authors would like to acknowledge the Department of Mining Engineering at University of Chile, particularly the ALGES laboratory, as well as the Advanced Center for Mining Technology at Universidad de Chile. Comments and corrections made by Dr Francis Pitard and an anonymous reviewer are greatly appreciated by the authors.
References
Assibey-Bonsu, W. 1996. Summary of present knowledge on the representative sampling of ores in the mining industry. Journal of the South African Institute of Mining and Metallurgy, vol. 96, no. 6. pp. 289-293. [ Links ]
Chilès, J.P. and Delfiner, P. 1999. Geostatistics Modeling Spatial Uncertainty. John Wiley & Sons, New York. 696 pp. [ Links ]
Deutsch, e.V. and Journel, A.G. 1998. GSLIB: Geostatistical Software Library and User's Guide, 2nd edn. Oxford University Press, New York. [ Links ]
Deutsch, e.V., Magri E., and Norrena, K. 2000. Optimal grade control using geostatistics and economics: methodology and examples. SME Transactions, vol. 308, February 2000. pp 43-52. [ Links ]
Francois-Bongarcon, D.M. 1983. The practice of sampling of broken ores. CIM Bulletin, vol. 86, no. 970. pp. 75-81. [ Links ]
Glacken, I.M. 1997. Change of support and use of economic parameters for block selection. Geostatistics Wollongong '96. vol. 2. Baafi, E.Y. and Schofield, N.A. (eds.). Kluwer Academic Publishers, Dordrecht. [ Links ]
Goovaerts, P. 1997. Geostatistics for Natural Resources Evaluation. University Press, New York. [ Links ]
Isaaks, E.H. and Srivastava, R.M. 1989. An Introduction to Applied Geostatistics. Oxford University Press, Oxford. [ Links ]
Journel, A.G. and Kyriakidis, P.C. 2004. Evaluation of Mineral Reserves - A Simulation Approach. Oxford University Press. 216 pp. [ Links ]
Journel, A.G. 1974. Geostatistics for conditional simulation of orebodies. Economic Geology, vol. 69. pp. 673-687. [ Links ]
Journel, A.G. and Huijbregts, C.J. 1978. Mining Geostatistics. Academic Press, London. 600 pp. [ Links ]
Krige, D.G. 1952. A statistical analysis of some of the borehole values in the Orange Free State goldfield. Journal of the Chemical, Metallurgical and Mining Society of South Africa, September. pp. 47-64. [ Links ]
Magri, E. 2007. Some experience in heterogeneity tests and mine sampling. Proceedings of the Third World Conference on Sampling and Blending, Porto Alegre, Brazil, 23-25 October 2007. Costa, J.F. and Koppe, J. (eds.). pp. 329-348, [ Links ]
Magri, E. and Ortiz, J. 2000. Estimation of economic losses due to poor blast hole sampling in open pits, Geostatistics 2000. Proceedings of the 6th International Geostatistics Congress, Cape Town, South Africa, 10-14 April 2000. Kleingeld, W.J. and Krige, D.G. (eds.). vol. 2, pp. 732-741. [ Links ]
Ortiz, J.M., Magri, E.J., and LIbano, R. 2012. Improving financial returns from mining through geostatistical simulation and the optimized advance drilling grid at El Tesoro Copper Mine. Journal of the Southern African Institute ofMining and Metallurgy, vol. 112, no. 1. pp. 15-22. [ Links ]
Pitard, F.F. 1993. Pierre Gy's Sampling Theory and Sampling Practice -Heterogeneity, Sampling Correctness and Statistical Process Control. 2nd edn. CRC Press, Boca Raton, FL. [ Links ]
Pitard, F.F. 2009. Pierre Gy's Theory of Sampling and C.O. Ingamells' Poission Process approach - pathways to representative sampling and appropriate industrial standards. Doctoral Thesis, Aalborg University, Campus Esbjerg, Denmark. [ Links ]
Rolley, P. 2000. Geologic uncertainty in the development of an open pit mine: a risk analysis study. MSc thesis, University of Queensland. 164 pp. [ Links ]

