


Servicios Personalizados
Articulo
 Inglés (pdf)
 Articulo en XML
 Referencias del artículo
Indicadores

Links relacionados
-
 Citado por Google
 -
 Similares en Google
Compartir

 Permalink
Journal of the Southern African Institute of Mining and Metallurgy
versión On-line ISSN 2411-9717
versión impresa ISSN 2225-6253
J. S. Afr. Inst. Min. Metall. vol.114 no.1 Johannesburg ene. 2014
SAMPLING AND ANALYSIS PAPERS
Mine to metal: a practical balance for a large platinum producer
H.E. BartlettI; M.J. LiebenbergII
IHugh Bartlett Consulting
IIImpala Platinum Ltd
SYNOPSIS
This paper deals with the sampling and mass measurement for ore delivered from a shaft to a processing plant and the contribution of the data from these measurements to the metal balances from shaft deliveries to final metal production.
Accurate measurement of the grade and tonnage of run-of-mine ore is important for four main reasons;
► It enables the measurement of the production from different profit centres to within statistically determined confidence limits for daily, monthly, or annual averages. The profit centres could be individual shafts within a mining complex or ore treated on a toll basis
► The monthly production at shaft head is compared to the grades and tonnage determined from underground sampling and mass measurement in terms of a shaft call factor
► The sum of the production from the shafts is the input to concentrators. This input is a major part of the total input into a complex with concentrators, smelters, and refineries. In terms of the Codes of Practice for Metal Accounting the inputs are compared to outputs and inventory changes to assess the efficiencies and unaccounted losses or gains at the various stages in the flow of metal from source to market
► On a daily or daily moving average basis, the grades and tons from shafts are monitored and compared against these quantities from underground measurements. This acts as a control on off-reef mining, dilution, and other factors underground.
Accurate measurement of grade of ore at the shaft head has been a challenge because of the large particle size. The conventional wisdom has been that ore can be sampled accurately only after it has been milled to give a slurry that is sampled as feed to a flotation process. However, when the ore fed to a flotation plant comes from multiple sources each source has to be sampled separately. So, relying on the grades determined using the sampling of concentrator input with cross-stream slurry samplers is not an option for determining the grade from an individual shaft.
Impala has developed a system for sampling and weighing run-of-mine ore from multiple shafts. The system involves sampling the inputs to the plants using cross-belt (hammer) samplers and weighing the deliveries using in-motion railway weighing systems. Many samples are taken. Individually they have a high variance but, as a consequence of the averaging effect of large numbers and as shown by statistical analysis, the mean results are fit for the purposes of daily grade control for shafts and for monthly accounting of production from individual shafts.
In the metal accounting systems at Impala, the measurement of input, including ore and toll-treated material is compared to the output in the form of final metal and tailings losses, as well as any inventory change that takes place, in order to determine a final metal balance from mill feed to product. The calculated inventory is compared to that measured, and the difference, or unaccounted- for metal, is then reported as a percentage of input. The balances obtained over several years yields balances for platinum that are below 1% imbalanced.
Keywords: metal balancing, platinum mines, AMIRA codes of practice, metal accounting, sampling, run-of-mine ore, statistical analysis.
Introduction
For the metal balances at Impala, the first principle of the AMIRA P754 Metal Accounting Code of Practice (Amira International, 2007) is applied. This principle is: 'The metal accounting system must be based on accurate measurements of mass and metal content. It must be based on a full check-in check-out system'.
The balances across the process units were calculated on the basis of this principle. All data was analysed using classical statistical techniques and procedures as described in many textbooks (Moore and McCabe, 1998).
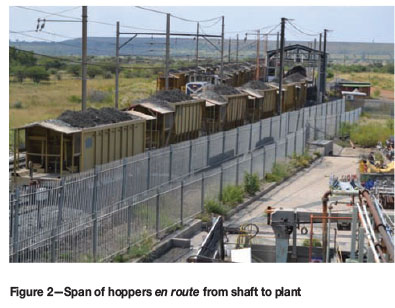
At Impala Platinum's Rustenburg operation, ore from both underground UG2 and Merensky reefs, as well as opencast mining material, is transported by rail in 30 t rail hoppers to the processing plants. These hoppers are weighed using six in-motion rail weighing systems, which are calibrated using bridge scale units in order to achieve accurate mass measurements.
The run-of-mine ore is unloaded via transfer bins onto conveyors which, in turn, feed jaw crusher units, producing an ore with a typical top size of 200 mm. As the ore is transported to ore silos in the plants, primary samples are taken using three Multotec hammer samplers. The primary samples are crushed and split in stages to give samples that are sent to the laboratory for analysis.
The mass and grade of ore from each shaft is thus determined daily in order to monitor shaft performance.
The composite of all the shafts is compared to the mill circuit product samples, which are taken using a cross stream cutter as a primary sampler, and a secondary Vezin sampler rig to collect shift samples.
The content of precious metal treated is then compared to the content called for by the shafts and a shaft call factor is determined on a monthly basis.
The measurement of input is compared to the output in the form of final metal and tailings losses, as well as any inventory change that takes place, in order to determine a final metal balance from mill feed to product. The calculated inventory is compared to that measured, and the difference, or unaccounted metal, is then reported as a percentage of input.
Process flow from ore deliveries-flow chart of ore movements
Figure 1 gives a broad overview of the process flow from the ore delivered by train from the shafts to the matte produced from the smelter. The matte is transported to the refineries, where the base metals and individual platinum group metals are produced.
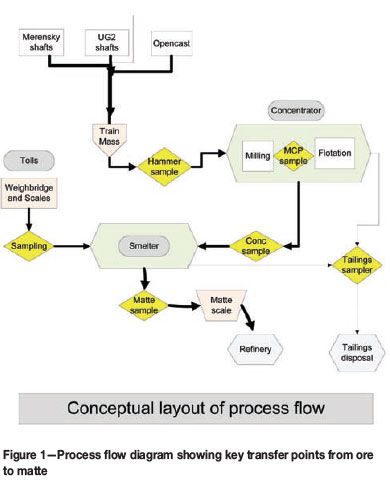
The key transfer points at which the metal contents are measured by determining the mass and by taking samples, for analysis:
►The output from each shaft's determined from the mass of ore measured on the train weighing system and the grade determined from hammer sampling as the ore is fed to the treatment plants
►The composite of the output from the shafts after milling is sampled as input into the flotation plants (the so-called MCP samples)
►The outputs from the flotation plants as concentrate and flotation tailings
►The inputs to the smelter consisting of the flotation concentrates from both Impala and from third parties, and other toll treated products
►The outputs from the smelter, consisting of the matte product which is sent for refining, and slag plant tailings. The slags from smelting are retreated to produce concentrates which are recycled and a final discard tailing.
There are many other sampling and mass measurement points within the different processes for internal control, but these have not been included for the overall monthly and annual accounting.
Mass and grade of ore delivered from the shafts
The metal content of an ore flow stream is the product of the dry mass of the ore and the grade of the ore as determined from analysis of samples.
The ore is transported in train hoppers from the shafts to the treatment plants. The net mass of every hopper is measured using the 'weighline' in-motion train weighing system. The wet mass is converted to a dry mass using historical moisture contents.
The grade of ore from the shafts is determined from assays of samples taken with cross-belt hammer samplers after being crushed to about 200 mm top size.
Description of the weighline system
The ore is loaded by conveyor from the shaft bins into 30 t rail hoppers. The mass of ore is measured on the belt with belt weighers but the official mass is that measured on the weighline system. There are in-motion train weighing systems at the entrances to the plants. Every hopper going to the plants is individually weighed and the total masses accumulated per train, which has a span of eight hoppers. Each train comes from a single shaft.
Once a week the system is calibrated by weighing a hopper of known mass, and once every six months the system is calibrated by an outside agency. The static weighbridge against which the in-motion system is compared is assized every eighteen months, the period for which the assize certificate is valid. Static calibrations are also performed if the known weight is beyond known limits.
By these means, the accuracy of tonnage measurement is within ±100 kg per 30 t hopper.
A constant 5% moisture factor is used to correct wet mass to dry mass. This factor is checked periodically by sampling campaigns using a reverse function on the hammer sampler to collect a single increment for moisture measurement. Although there is some variation in the moisture factor on a sample by sample basis, the 5% average utilized appears to be sufficiently representative of the monthly tonnage treated.
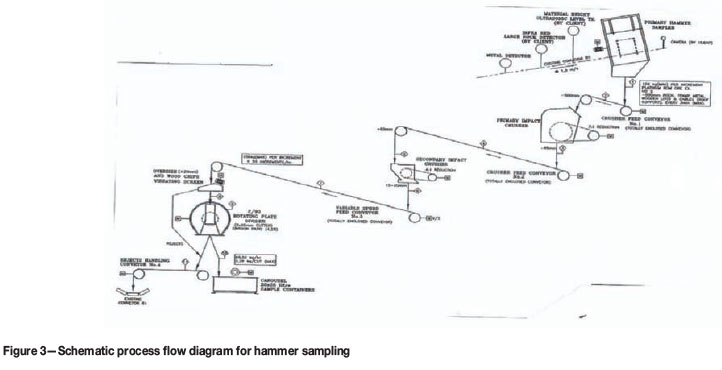
Description of hammer sampling
A schematic diagram of the process flow for the hammer samplers is given as Figure 3.
After offloading from the hoppers the ore is crushed to a top particle size of 200 mm. The output from the crushing plant provides a steady feed on the 1.35 m belts to the mill silos.
Multotec hammer samplers, fitted on elevated sections of the belts, have cutters 0.45 m wide and sweep increments off the belts at right angles to the belt (Figure 4).
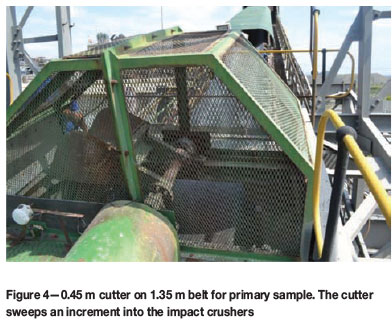
The increments, which weigh between 150 kg and 200 kg, are fed by gravity into two stages of impact crushing to reduce the top particle size to about 8 mm.
Rotating plate dividers are used to collect 4.25% of this crushed material, with the reject being discarded onto an existing conveyor.
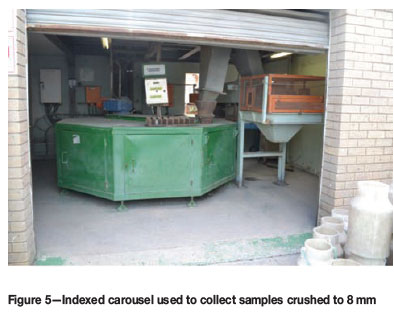
When the hammer sampler operator is radioed information on a particular locomotive, one hammer increment is taken to clean out the system. Then five hammer increments are taken per span of hoppers over a 15 to 20 minute time period as the locomotive is discharging. These hammer increments are random and there is no reason to suppose that there is a systematic grade variation within. The five increments are collected into buckets on 20 position indexed carousel which moves to a new position when the next train of ore is sampled (Figure 5).
The buckets of sample, weighing approximately 27 kg, are passed through a vertical spindle pulverizer to reduce the particle size to 100 µm before splitting out samples for the laboratory weighing approximately 2,2 kg on a 12-way rotary divider.
Further splitting and pulverizing takes place in the laboratory before the samples are analysed using their standard procedures.
The nominal particle size of the ore being sampled is 200 mm, but on occasion larger particles occur. There is a possibility that the cutters would be damaged if they were to operate while a large rock was on the belt. To obviate this, large rock detector systems are in place to prevent the hammer from operating at that instant, and the sample action is slightly delayed.
Accordingly, very large particles will not be sampled. This could give rise to bias if there were a substantial proportion of very large rocks and they were of lower grade than the general run-of-mine. This is not believed to be a material problem because there are few large rocks.
Other potential sources of bias are:
►The cutters not cleaning off fine material from the belt. Regular inspections and the fitting of rubber strips on the cutter arms help control this problem
►Loss of dust during the crushing and splitting of the increments. The crushers and their associated belts are enclosed to prevent dust loss, and water sprays are used to minimize the environmental hazard of dust.
There is no evidence to suggest that fine material left on the belts or dust lost is substantially different in grade from the bulk of the ore. Also, the masses are low relative to the mass of the increments, 150 kg to 200 kg, so if there were a bias it would be small.
Moisture measurement of run-of mine ore
The masses of ore determined by the weighline system are corrected for moisture content using a 5% factor which is the long-term average moisture content for both Merensky and UG2 ore. This content is checked by taking belt samples that are measured for moisture using the hammer sampler in reverse mode to discharge an increment on the opposite side of the belt to the crushing and splitting tower. The checks are run at the beginning and end of the wet season. It has been found that the moisture content could be between 4.7% 5.3% as compared to the 5% used. The difference of 0.3% and would cause an error of about this magnitude in the dry mass calculations. This is within the confidence of the measurement of wet mass and can therefore be ignored. If it is found that the moisture content varies substantially from 5%, the factor is adjusted accordingly.
Precision and accuracy of belt sampling
Precision
The precision of sampling is a measure of the reproducibility of sampling and is expressed as RSD%, which is the standard deviation of repeated measurements divided by the mean and expressed as a percentage.

The RSD%s for five increments with the hammer sampler for the Merensky and UG2 ores over a period of over a year were determined by regression modelling and are presented in Table I.
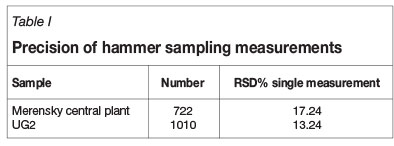
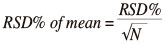
These RSD% values are high, which shows that a single hammer sampling result is not of much use. However, with many measurements the RSD% reduces in the ratio of the square root of the number N measurements of.
In transferring ore to the plants there is usually more than one span of hoppers per day per shaft, meaning that there is more than one hammer sample result per day.
For the monitoring and control of shaft operations, 5-day moving average results are used. The 5-day moving averages consist of variable numbers of hammer sample results.
The monthly average results are used for reconciliations between shaft and plant.
The RSD% values for daily, 5-day moving average, monthly per shaft, and monthly for all the shafts are given in Table II using estimates of the numbers of hammer samples per period.
Table II shows that the precision of the 5-day moving average is better than 5%, which is acceptable for shaft monitoring. The monthly precisions of 2% for Merensky and 1% for UG2 for single shafts are adequate for monthly shaft accounting.
Because of the large numbers of hammer samples taken for all shafts, the average grade of ore from all shafts is within 1%. This is compared to the flotation feed grades as measured with cross-stream samplers.
Accuracy of hammer samplers compared with cross-stream samplers of flotation feed
The accuracy of sampling can be assessed only by comparison with samples which are deemed to be accurate or free from bias. This is provided by comparing the averages for all the hammer samples for all the shafts feeding into the flotation plants to the results from cross-stream samples of pulp after milling.
The ore that has been sampled with hammer samplers (the feed to the flotation plants) is measured with cross-stream samplers followed by secondary Vezin samplers. The cross-stream cutters take an increment every 5 minutes and the secondary samples are filtered, dried, and then split before submission to the laboratory.
Considerable effort was put into the design of these samplers and there has been much work done over the years to optimize their operation in terms of cutting frequencies and sub-sampling procedures (Bartlett, 2002). Accordingly, these samplers are considered to be accurate.
Comparisons are made between the averages of the hammer samplers and flotation feed samplers over two different periods
The differences between flotation feed and hammer samples are given in Table III.
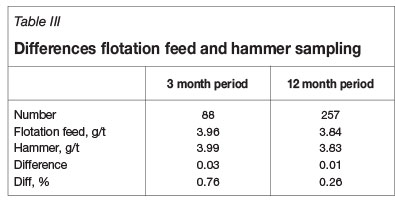
Table III shows that any bias between the flotation feed and hammer grades, is less than 1% which is within the accuracy of the analytical methods. For all practical purposes there is little, if any, bias between the MCP and hammer sampler.
Overall metal balances
There is an ongoing programme to measure all inputs, outputs, and stockpile changes at the processing plant.
Inputs
The major inputs into the concentrator at Impala are from underground Merensky and UG2 ores. As previously discussed, these ores are weighed using the weighline, which is known to be accurate to ±0.3% and sampled using the hammer samplers.
Toll materials are another major input into the processing plant, and are treated at the smelter complex. These materials are sampled and weighed on receipt at Impala using state-of-the-art sampling methods and are fed to different sections in the processing plant.
The concentrates from all the concentrators are sent to the smelter thickeners. The grades of concentrate are measured by sampling and assay. The masses are calculated using the two- product formula.
Inputs
Matte
The only valuable output from processing is the converter matte.
This is weighed in trucks as it is transported to the BMR in Springs, where the matte is weighed by scale and sampled using an appropriately designed sampling plant.
Flotation tailings
The only losses from the operations are in the form of flotation tailings, which are sampled with cross-stream samplers. The converter and furnace slags are recycled within processing, yielding flotation tailings.
Stockpiles and accumulations within the processes are measured on a monthly basis.
A metal balance is based on:
Output (Product at refinery+Residues)
= Input(Merensky,UG2, toll, and other) ± Stock change.
On the basis of all the measurements, a metal balance is constructed and this is compared to the output from the refineries.
The annual balances for the previous 5 financial years are given in Table IV. These balances are audited by PWC and the imbalances are within the target range set by Impala.
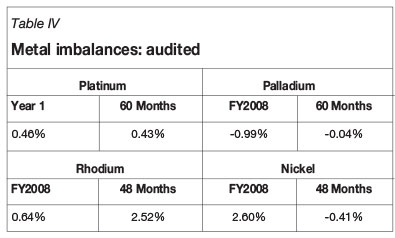
The overall imbalances for platinum and palladium are less than 1%.
Concluding remarks
Impala has developed a system for sampling and weighing platinum ores with a particle size of 200 mm. Traditionally it has been considered that material of this nature could not be sampled accurately and that is necessary to crush or mill it to a smaller particle size before sampling. However, this is not an option for ore from multiple sources all feeding a common treatment plant.
The Impala system for ore involves hammer samplers taking increments from the feed belts into the flotation plants as ore is being unloaded from rail hoppers. These individual increments are crushed in two stages from the 200 mm particle size to about 8 mm and a sub-sample extracted using a rotating plate divider. The sub-samples for daily ore deliveries for each shaft are accumulated in separate cans on a carousel collector. The sub-samples are prepared and sent to the laboratory for analysis.
This system differs from the system used for sampling run-of-mine gold ore at Harmony (Bartlett, Korff, and Minnitt, 2014). At Harmony, bulk samples consisting of multiple increments taken with cross-belt samplers are transported to a central sample preparation plant where they are treated to give the final samples for analysis in the laboratory.
With both systems the individual results are highly variable and one has to use averages. For both systems the average results, as demonstrated by statistical analysis of operating data, are fit for the purposes of daily grade control, monthly shaft accounting, and measurement of monthly total input into processing plants to statistically determined confidence limits.
At Impala, the imbalances, or unaccountability, for the 5-year period that was considered between the input of ore and toll material and output of metal from the refineries and changes in stock was less than 1%, as audited by an auditing company. This attests to the excellence of the measurement and accounting systems.
References
AMIRA International. 2007. P754 Metal Accounting: Metal Accounting Code of Practice: Release 3. Fe. Melbourne, Australia. [ Links ]
David, S. Moore G., and McCabe, P. 1998. Introduction to the Practice of Statistics. Freeman New York. [ Links ]
Bartlett, H.E. 2002. Design of primary samplers for slurries in concentrators and statistical methods for measuring components of variance in concentrators. Journal of the South African Institute of Mining and Metallurgy, vol. 102, pp. 485-490. [ Links ]
Bartlett, H.E, Korff, L., and Minnitt, R.C.A. 2014. The allocation of gold production from multiple shafts feeding a common treatment plant using run-of-mine sampling of ore deliveries. Journal of the South African Institute of Mining and Metallurgy, vol. 114, no. 1, pp. 109-120. [ Links ]

