


Services on Demand
Article
 English (pdf)
 Article in xml format
 Article references
Indicators

Related links
-
 Cited by Google
 -
 Similars in Google
Share

 Permalink
Journal of the Southern African Institute of Mining and Metallurgy
On-line version ISSN 2411-9717
Print version ISSN 2225-6253
J. S. Afr. Inst. Min. Metall. vol.112 n.11 Johannesburg Nov. 2012
Evaluation of the behaviour of high-density tailings deposition CODELCO pilot plant
J. EngelsI; G.I. McPhailII; R. JamettIII; C. PavissichIV
ITailpro Consulting, Chile (previously Knight Piésold S.A., Chile)
IIKnight Piesold S.A., Chile
IIISLR Consulting Australia, (Pty) Ltd, Australia
IVCODELCO-VP, Chile
SYNOPSIS
CODELCO is considering the implementation of high-density tailings management at the Chuquicamata mine in northern Chile for its long term disposal plan. To achieve this, CODELCO commissioned the design, construction, and operation of a 70 t/d pilot plant, fed by existing tailings. The testing programme was completed in May 2011, and consisted of laboratory rheological and characterization assessments, pipe loop testing, beaching trials, and analyses of deposition behaviour for solid contents ranging from 57-68% (w/w).
This paper describes the characteristics of the pilot plant, the testing programme, the beach trial analyses, and the resulting beach profile predictions based on the stream power theory.
CODELCO also used other predictive beach slope methods, such as the equilibrium slope concept, which are not discussed in this paper. The final beach profile for design will be selected after an expert analysis of all methods has been completed.
Keywords: high-density tailings, tailings management, beaching, deposition behaviour, flume tests.
Introduction and objectives
Overview of the pilot plant
A pilot plant for testing high-density thickened tailings was commissioned in January 2011 for the Chuquicamata Project in northern Chile, owned and operated by CODELCO. The pilot plant was designed and operated by a joint venture consisting of Knight Piesold (KP), Paterson & Cooke (P&C,) and EIC Ingenieros (EIC). The objectives of the pilot plant were to determine the design parameters for implementing a high-density thickened tailings discharge system within Tranque Talabre, the existing and active tailings storage facility.
The long-term plan for tailings storage within Talabre is to minimize water losses, and optimize storage capacity and life of the facility, while at the same time reducing operating costs. Due to the size of Talabre (5 000 ha), it is feasible to reduce retaining wall heights by increasing the beach slope and in situ density and applying a high-density thickened tailings discharge system.
The fundamental objectives of the pilot plant were to determine the deposition behaviour of the tailings at concentrations of 57% (as currently produced), 63, 65, and 68% solids (w/w) and to assess thickener performance to achieve these concentrations. The key components of the pilot plant are summarized as follows and identified in Figure 1.
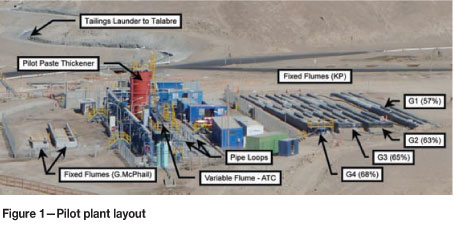
Pilot paste thickener (2.5 m diameter, 11 m highDesigned and operated by Outotec, with a maximum capacity of 70 t/d
All installed distribution pumps for the thickened tailings were peristaltic style (Bredel SPXs) feeding high-density polyethylene (HDPE) pipelines and flexible mine hoses.
Based on laboratory testing by Outotec, a maximum concentration of 71% solids was proposed, but during commissioning and operation of the pilot plant a sufficient volume of tailings at this concentration could not be achieved to feed all the flumes. As a result, 68% solids was the maximum that could be considered for testing purposes. The thickener produced paste of up to 76% solids in batches, but could not maintain consistency in discharge concentrations over 68% solids (not paste).
This paper presents the key results of the fixed flumes of KP and Gordon McPhail, with their subsequent laboratory analyses (Engels et al., 2011; McPhail, 2011). Other predictive beach slope methods, such as the equilibrium slope concept (variable flume), the results from the pipe loops, and details of the pilot paste thickener are not discussed in this paper.
Fixed flumes (KP) and KP laboratory
The concept behind the fixed flumes (KP) was to determine changes in the deposition characteristics of tailings when discharged sub-aerially in an open channel for a range of solids concentrations. The focus of the operation of these fixed flumes was to determine the effects of drying, the potential water recovery, and the changes in density. Beach slopes were also measured in the fixed flumes, but the methodologies of ATC Williams and Gordon McPhail were considered more reliable for determining design beach slopes for the full-scale operation. Samples were collected to determine segregation of the tailings along the flume and consolidation effects when each layer had dried.
Figure 2 shows the typical deposition methodology used for discharging tailings in the fixed flumes. Both flumes of one group were filled immediately after one another, discharging at an average rate of 5 l/s with a total deposited volume of between 7 and 10 m3 in each flume per layer. A Marcy balance and oven drying techniques were used to confirm the solids concentrations of all layers discharged in each flume.
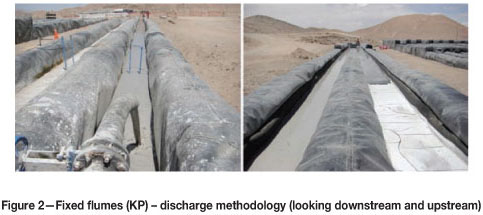
Tailings were allowed to discharge past the end of the flumes, to ensure adequate layer depth formation and achieve the equilibrium beach slope and a more uniform layer thickness. A concrete collection channel was installed at the downstream end of the flumes to return overflow tailings to the main tailings discharge launder leading to Tranque Talabre.
As an addition to the field trial experiments, laboratory testing was carried out to verify the results obtained in the fixed flumes and to determine additional tailings parameters important for the purposes of final design. These included the following:
Classification testing was performed to confirm that the properties of the tailings were similar for all laboratory samples and for each layer deposited in both the fixed flumes (KP) and the flumes of Gordon McPhail. The tailings characteristics varied slightly during operation of the pilot plant, having a P80 of 210-350 µm and a P50 of 60-150 µm. The material was non-plastic with a USCS classification varying from SM to ML.
Based on the topics discussed in this paper relating to the fixed flumes (KP), only laboratory results relative to drying and density are presented, which consist of data from the sedimentation tests and air dry tests. Rheology results are discussed as part of the investigations of beach slope prediction based on the stream power approach.
Fixed flumes of Gordon McPhail
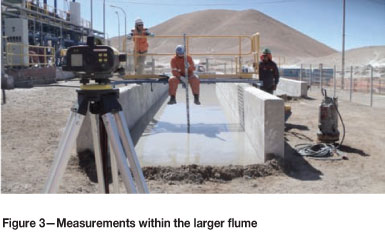
Discharge rates into the two flumes of Gordon McPhail were regulated to 8.5 l/s in the larger flume and 2 l/s in the smaller flume. The purpose of constructing and using two flume sizes was to be able to assess the influence of discharge rate and flume geometry on the results derived from the beaching tests. Figure 3 shows the larger flume undergoing survey measurement following deposition. The smaller flume is visible on the right of the picture.
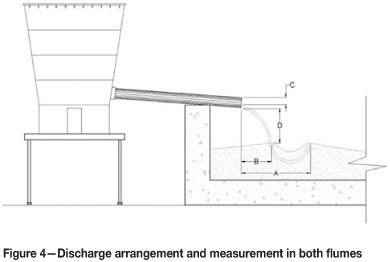
The discharge arrangement used at the head of each flume is shown in Figure 4. Slurry is pumped from the thickened tailings feed tank to a small header tank, which ensures that the discharge head remains as steady as practicable. Measurements of the discharge and the resulting plunge pool are taken during active deposition, as indicated in Figure 4 (A to D).
Samples of slurry were taken during the course of the trial and used to determine the slurry density, rheological properties using vane and Couette viscometers, and particle size distribution. Once the tailings had advanced to within 1.5 m of the end of the flume, the rate of advance of the tailings front was measured and the dimensions of the front and the elevation of the tailings at the discharge were taken. Deposition was terminated when the tailings front was within 0.5 m of the end of the flume.
As soon as deposition was stopped and the header tank disassembled, the surface of the tailings along the centreline of the flume was surveyed so as to obtain a longitudinal profile of the deposited tailings.
The measured data was processed by:
Water release and loss derived from fixed flumes (KP)
Sufficient time for drying in order to achieve density and strength gain is an important design consideration, primarily to optimize the storage capacity within a tailings facility and improve stability during seismic events. To measure this parameter, a series of instruments was employed to evaluate the surface and subsurface movements of water within the tailings mass during subsequent layer deposition. These are described as follows:
An evaporation pan (Class A) was installed next to the fixed flumes to record daily evaporation.
Pore pressure variations
The tensiometers and piezometers were connected to electronic logging devices that recorded pressure and temperature readings within the first layer of tailings every 10 minutes for the duration of all testing in the fixed flumes. The results indicated that for higher tailings solids concentrations, lower negative pore pressures were measured, indicating that the release of water is slower within the tailings mass. Figures 5a and 5b show the negative pressure readings recorded for G1 (57%) and G4 (68%) plotted using the same scale axes for comparison purposes.
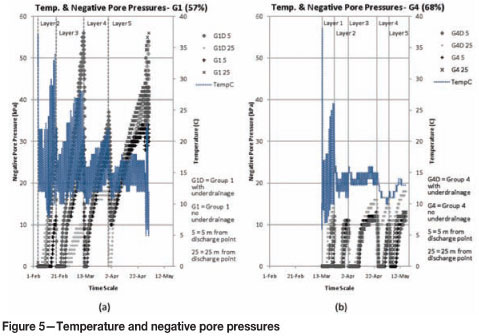
The tailings are, by definition, saturated when there is zero (or positive) pressure and negative readings commence when pore water suctions develop. If these suctions exceed the air entry value of the tailings, air will enter the voids and desaturation will occur. During discharge of each subsequent layer the tailings in the first layer (where the instrumentation is installed) are re-saturated and therefore zero pressure is observed. However, with each subsequent layer, the duration of saturation reduces to the extent that after deposition of the topmost layers 100% saturation in the lowermost layer does not occur, indicating that the wetting front does not penetrate to the drainage/base of the flumes.
Generally, with increased solids concentration a higher moisture content is maintained over time as the tailings take longer to release water (as noted by the gradual up-sloping of the 68% solids negative pressure curves in Figure 5b). This indicates that the vertical movement of water within the mass of tailings (towards the surface of the layer through capillarity or migration to layers below) is reduced. The daily temperature variations as measured at depth are also much more stable for higher solids concentrations, possibly as a consequence of differences in degrees of saturation of the tailings as retained water stabilizes the daily temperature variations.
Surface tailings evaporation and prolonged moisture content
The results from the lysimeters show that, as the tailings solids concentration increases, the evaporative losses from the tailings surface are initially lower and prolonged as water release is slower in comparison to lower concentrations. This is evident from the changes observed in pore pressures presented previously and the results of the in situ density tests. Figure 6a presents the averages of the lysimeter data collected for all concentrations.
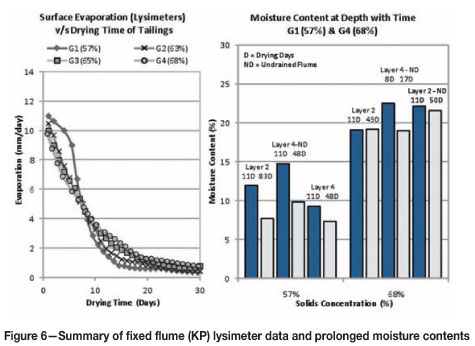
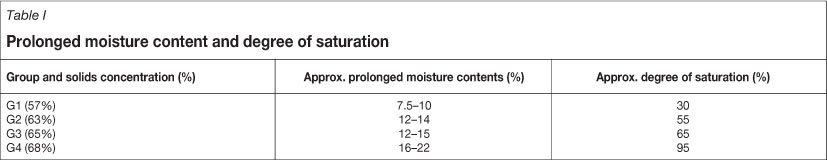
On completion of all deposition trials in the flumes, a series of excavations was made along each flume to determine densities and moisture contents at depth. The moisture contents were compared to data collected from the same layers after deposition and following drying to understand how the tailings were retaining moisture after future layers were deposited. Due to the prolonged drying time between measurements, the results at depth are a good approximation of prolonged moisture contents for the various concentrations for the full-scale operation. Figure 6b is a comparison of approximate prolonged moisture contents at depth over time between G1 and G4.
For higher solids concentrations, the approximate prolonged moisture contents were observed to be higher, with little variation over extended periods when compared to lower solids concentrations. Table I is a summary of the approximate prolonged moisture contents for all concentrations, together with the corresponding degrees of saturation, as determined in the laboratory.
Liberation of water
Estimations of the potential recovery of supernatant were determined in the laboratory for both drained and undrained conditions. A final estimation of the different percentages of recovery using data from the laboratory and the fixed flumes is presented in Figure 7. This data presumes an approximate layer thickness of 300 mm as determined in the laboratory. The lysimeter data has been used to separate losses due to evaporation from the surface of the tailings.
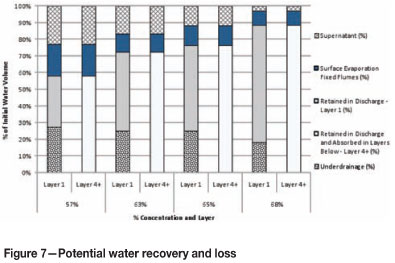
The results from the fixed flumes with installed underdrainage flow meters were consistent with laboratory data for G2 and G3, where recovered underdrainage water ran clear. However, results from G1 and G4 were elevated due to small tears in the geotexile allowing supernatant water and slimes to enter the drainage system (evidenced by dirty water). Underdrainage in all flumes was recovered only in the first and second deposited layers. In subsequent discharges, infiltration water was absorbed in the previous layers after drying. From these observations, the water collected in the underdrainage and the water absorbed by underlying layers in Layer 4+ has been combined in Figure 7, based on the observations of zero underdrainage measurements and the reduced degrees of saturation as measured by the pore pressure data.
In situ density and drying time derived from fixed flumes (KP)
Density
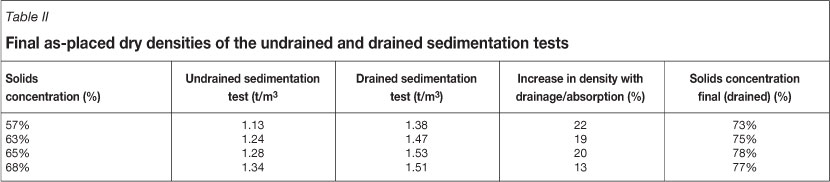
Initial and final in situ density varies depending on the solids concentration of the tailings deposited within a storage facility. Different ranges of densities were measured in each group of the fixed flumes (KP) and compared with laboratory testing (air dried) using samples of the same deposited tailings. The drained and undrained sedimentation tests were used to determine the as-placed densities (saturated density) before consolidation and drying effects occurred (initial density). The optimum dry densities for each solids concentration were then obtained to determine potential final (maximum) in situ dry densities (the point when there are no further changes in volume with time). The changes in densities between the as-placed to optimum for each solids concentration were measured every two to three days after discharge of each layer deposited in the fixed flumes, using in situ density techniques.
Table II shows the as-placed dry densities for each concentration considered. The drained test is specific to sub-aerial deposition of tailings, which is relevant to Talabre and the tests in the fixed flumes. During this test the free surface water was continuously recovered to simulate supernatant runoff, while drainage water collected via the base to simulate absorption to underlying tailings or flow to installed drainage. The undrained sedimentation tests indicate typical densities of sub-aqueous deposition or densities in areas of ponded water.
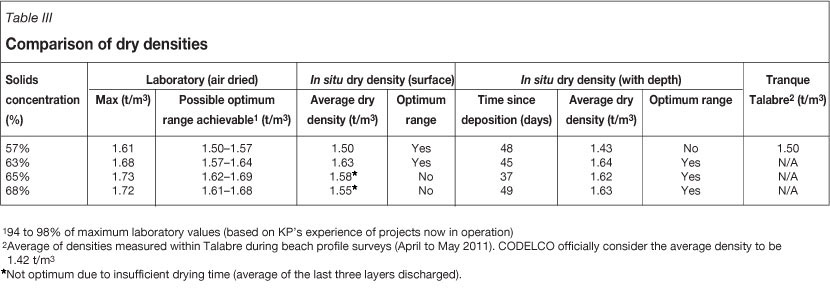
Table III summarizes the optimum dry densities obtained in the laboratory and the in situ dry densities achieved in the fixed flumes after drying and before discharge of subsequent layers. From the excavations through the tailings, as mentioned earlier, the densities of the initial layers discharged were measured and are presented to show how changes are occurring within the mass of tailings due to prolonged consolidation effects. In situ densities were also measured within various dry zones of the Talabre deposit (originally discharged at 57% solids), away from single flow channels, which confirm the results obtained from G1 for the same concentration.
An important note is that the optimum dry densities for G3 (65%) and G4 (68%) of the fixed flumes were not achievable due to insufficient drying time before discharge of the next layer (time restraints of operation). However, estimates for the drying times needed can be projected based on initial drying behaviour, laboratory results, and observed density changes. Optimum densities were obtained in G1 (57%) and G2 (63%) of the fixed flumes.
Drying time
As shown by the pore pressure variations and lysimeter data, the higher the solids concentration, the slower the release of water from the tailings mass. Therefore, it is important to determine drying times for each concentration to ensure optimum (or near optimum) dry densities can be achieved before successive layers are deposited within a tailings storage facility.
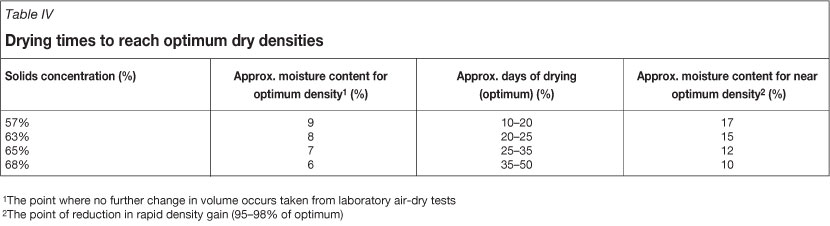
Based on the results of the fixed flumes and laboratory drying tests, the following time frames were observed to reach optimum dry densities for the various solids concentrations tested (ranges for 100 mm to 200 mm layer deposition).
It can be seen from Table IV that the drying times for 57 to 68% solids increase notably, even when the differences in layer thickness are taken into account. This will influence the filling plan of the tailings facility to allow inactive zones sufficient time to dry and increase towards optimum in situ dry density. The near optimum dry density values are presented for comparison (approximate point of reduction in rapid density gain), taking approximately 5 to 15 days less time (57 to 68% solids respectively) than required to achieve optimum density.
Rheological properties derived from beach trial analyses
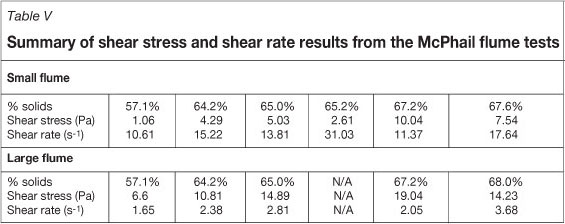
Shear stress and shear rate data developed from stream power-entropy based analyses of the Gordon McPhail fixed flume tests and the interpolated rheology are presented in Table V and plotted in Figure 8, together with flow diagrams derived from Couette viscometer testing.
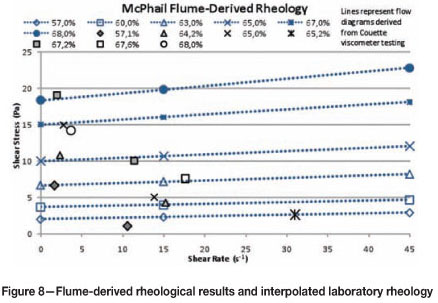
The following points are noteworthy with respect to Figure 8:
In interpreting Figure 8 it is important to take into account a number of points:
Full-scale beach profile predictions have been calculated for each of the crests using the interpolated shear stress and shear rate results, as well as the following percentage solids and spigot numbers:
Flow rates in the full-scale operation will be controlled by regulating the number of spigots through which the slurry will be discharged onto the beach. It has been assumed in the analyses documented below that the flows from the spigots do not combine down the beach.
Calculation of the beach profile entails the following iterative process:
Rheological properties derived from pipe loop testing
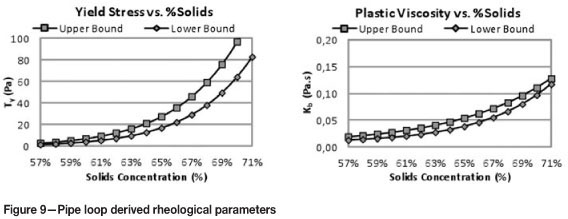
Pipe loop testing results, analysed by P&C, yielded estimates of the rheological properties of the future tailings. Upper and lower rheological boundaries were derived for various blends of ore that are likely to be discharged in Talabre in the future (from Codelco's Ministro Hales and Radomiro Tomic mines). These results show significantly higher yield stresses and stress-shear rate behaviour compared with the current tailings, as determined from laboratory and beach trial testing. Figure 9 shows plots of the yield stress versus percentage solids and the Bingham viscosity versus percentage solids for rheology data from the pipe loop testing.
Derived results
This paper is focused on the behaviour of high-density thickened tailings once deposited within a storage facility for the Chuquicamata project in northern Chile. The fundamental objectives were to determine the deposition design appropriate to optimize density and therefore storage capacity while estimating full-scale beach slopes for a range of solids concentrations from 57-68% solids. This was completed during a five-month operation of a 70 t/d pilot plant commissioned in January 2011. The following sections present additional results derived from the data given in this paper.
Water recovery
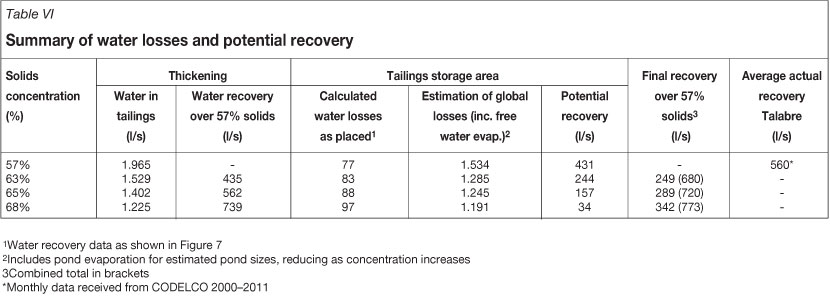
The liberation of water within a tailings facility is an important consideration when determining the potential recovery for high-density thickened tailings deposition. The results of the fixed flumes and laboratory testing indicate that the probability of recovering water from tailings deposited at 68% solids is likely to be very low to zero, whereas for 63-65% solids, some water recovery from the tailings facility could be expected. Table VI presents an estimate of overall potential recovery volumes that could be expected based on the observations and data collected from the pilot plant and the Talabre deposit.
The actual average monthly water reclaim within Talabre is 28% (average solids concentration of 56.6%) from 2004 to 2011 data, whereas 23% was calculated during the operation of the fixed flumes and the laboratory. The difference is most likely due to higher layer thickness in Talabre, as tailings are currently deposited using the single-point discharge technique, designed to maximize water recovery but reduce in situ density. Increasing the tailings concentration will reduce this variation in recovery (less water discharged).
In summary, water recovery from increased thickening will naturally recuperate higher volumes of water prior to deposition, with reduced final recovery from the tailings facility. This final recovery is an important consideration when analysing concentrations of high-density thickened tailings discharge, as overall water recovery for increased solids concentrations may be only marginally higher. This may not be economically feasible when considering the higher capital and operational costs that are generally associated with higher rates of thickening and pumping, particularly paste.
Density and cycle times
The results from the fixed flumes and laboratory tests show that the in situ densities (as-placed and final) will increase with solids concentration, as expected. However, as shown in Table III the in situ densities for 63-68% are similar, with results for 65 and 68% solids almost identical. Therefore, from the exclusive point of view of in situ density gain, there is no advantage to increasing the tailings concentration beyond 65% solids and only a slight advantage to thickening higher than 63% solids. As identified in Table IV, 65% solids will yield reduced drying times in comparison to tailings deposited at 68% solids, allowing faster rates of rise and reduced intensity for discharge management, which is a significant advantage, even when considering higher layer thicknesses.
Beach slope predictions (stream power)
The predicted beach profiles for 63% and 68% solids for the top final beach location and using the laboratory-based parameters are indicated in Figures 10a and 10b.
The average beach slopes have been calculated in two ways, yielding identical numbers:
The predicted slopes are summarized in Table VII, together with the maximum height differential between the predicted concave beach profile and a profile of single slope equal to the average slope. This provides an indication of the degree of concavity of the profile. It is evident from Table VII that there is a significant increase in the beach slope as the flow rate per spigot is reduced.
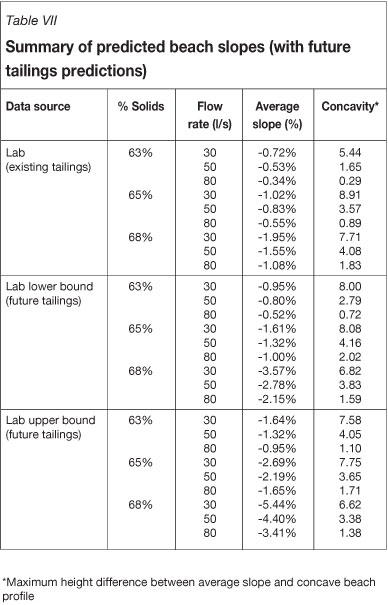
Table VII also presents the data for future ore variations, where beach slope predictions were made. There is a significant difference between the slopes for parameters derived from laboratory testing of existing tailings (pilot plant) and those derived from future tailings testing at higher concentrations.
It is also of interest to note that the predicted degree of concavity increases between 63 and 65% solids but decreases from 65-68% solids, while the average beach slopes increase steadily over the range. This is in line with observations by pioneer researchers such as Robinsky, that as the percentage solids increases the beach profile becomes steeper but more linear. In this case this transition is predicted to begin after 65% solids.
Closing comments
Based on the observations of the fixed flumes (KP) and laboratory testing (KP), there are differences in the behaviour of the Chuquicamata tailings when deposited at concentrations above 57% solids. One important observation is that increasing the concentration increases the time taken to reach optimum dry density. Between 57-63%, there is a point where this optimum in situ dry density is similar to values observed for 63-68% solids, but is achieved in shorter time frames. Obtaining optimum dry densities is preferable due to the high throughput of Chuquicamata, and therefore the ability to extend the life of the Talabre storage facility.
In addition to density behaviour, the water recovery and beach slope observations will assist with recommendations for future tailings discharge within Talabre. At this stage, increasing the concentration of tailings from the current thickener and revision of the existing transport system will be advantageous to optimize storage capacity before tailings from two other nearby CODELCO mines (Ministro Hales and Radomiro Tomic) require storage. At this time, future water costs are likely to dictate the selected high-density thickened tailings disposal concentration, due to the capital and operating costs associated with seawater make-up. A tradeoff study will determine capital and operating costs prior to a conceptual design stage for Talabre. It is envisaged that the KP suite of laboratory-scale testing will be carried out to verify the predicted changes in the deposition behaviour of these new tailings compared with the current tailings, and if necessary, further pilot plant testing.
Tailings properties are naturally different between mining projects, influencing the deposition behaviour and water recovery that could be achieved. It is therefore important to understand these properties in the early stages of project development by first considering laboratory-scale trials to determine thickening and pumping limitations, as well as in situ densities and potential water liberation that could be expected within the tailings storage area. Knight Piésold's experience has shown that the suite of tests performed in the laboratory provide a good indication of potential full-scale tailings deposition behaviour within a tailings storage facility (based on actual facilities now in operation). For the CODELCO pilot plant, the addition of testing in the fixed flumes (KP) has helped to verify observed deposition behaviour on a larger scale. The comparability between the two testing techniques questions the need to operate the fixed flumes in the future. This is especially true when considering the ease of duplicating required conditions in the laboratory when compared to larger scale field conditions where operational challenges exist to produce, transport, and discharge high-density thickened tailings, even on a pilot scale. However, it is likely that the fixed flumes will be modified in the future to run deposition testing in cells, in order to have more control over layer thickness for depths that cannot be achieved on a laboratory scale.
A comparison of rheological parameters derived from laboratory and fixed flume tests (McPhail) shows a relatively poor correlation. The degree of correlation is also influenced by the scale of the flume. Based on the results of this programme, it seems evident that the benefits of avoiding the issue of settling out of the slurry (as occurs in the laboratory testing) by adopting pilot-scale flume tests are offset by issues such as scale of the pilot test and stratification of the tailings as they flow down the flume. It needs, however, to be recognized that the issue of stratification occurs in the full-scale operation and a method for adequately accounting for stratification will be essential for beach profile prediction going forward.
Acknowledgements
The authors would like to thank CODELCO for the opportunity to be involved with the Chuquicamata Pilot Plant and for granting permission to prepare and present this paper.
References
ENGELS, J.M., JAMETT, R.F., ALBORNOZ, J.M., ARENAS, M.R., DUARTE, S.A., AND RAMÍREZ, R.R. 2011. Informe Operación Planta Piloto-Ensayos Canaletas de Pendiente Fija. created for CODELCO-VP. Unpublished report, Knight Piésold S.A., Chile. 371 pp. (Cited with permission). [ Links ]
MCPHAIL, G.I. 2011. Beach profile predictions for high density tailings at Chuquicamata Mine. created for Knight Piésold s.A. and CODELCO-VP. Unpublished report, SLR Consulting Australia (Pty) Ltd, Perth. 58 pp. (Cited with permission). [ Links ]
© The Southern African Institute of Mining and Metallurgy, 2012.ISSN 2225-6253. This paper was first presented at the, 15th International Seminar on Paste and Thickened Tailings (Paste) 2012, 16-19 April 2012, Sun City, South Africa.

