


Services on Demand
Article
 English (pdf)
 Article in xml format
 Article references
Indicators

Related links
-
 Cited by Google
 -
 Similars in Google
Share

 Permalink
Journal of the Southern African Institute of Mining and Metallurgy
On-line version ISSN 2411-9717
Print version ISSN 2225-6253
J. S. Afr. Inst. Min. Metall. vol.112 n.11 Johannesburg Nov. 2012
Important considerations in the testing of high-density tailings for beach profile prediction
G.I. McPhailI; M. BecerraII; S. BarreraIII
ISLR Consulting Australia (Pty) Ltd, Australia
IIASMIN, Chile
IIIARCADIS, Chile
SYNOPSIS
The authors have conducted several investigations into the prediction of the beach profile of high-density tailings and have found that there are a number of important considerations that need to be taken into account over and above the reliability of the beach profile prediction methodology. These considerations relate to the chemistry of the slurry and specifically the influence of pH and flocculation, both of which have a significant influence on the rheology of the slurry at the discharge point. A number of examples are discussed and a potential testing protocol that will assist in assessing the influence of chemistry ahead of the beach profile predictions is presented. A methodology for assimilating the results of the testing into the likely field situation is discussed, and suggestions are made on application of the results in beach profile prediction. The suspected influence of residual flocculation on the stratification of the tailings slurry as it flows down the beach is also discussed.
Keywords: high-density tailings, beach profile estimation, slurry chemistry, rheology testing, yield stress
Introduction
Beach profile prediction methodologies currently being applied to tailings slurries generally make use of the rheological properties of the slurry as determined by laboratory testing, large-scale flume testing, pilot-scale beach trials, and pipe loop testing. Laboratory testing mostly involves shear testing, using a vane rheometer to derive an estimate of the yield stress of the slurry, and viscometer testing to derive a relationship for the flow diagram beyond the yield stress. The laboratory testing methods have their limitations in terms of settling out of slurries, a particular problem in slurries of high sand content, and/or slippage during the tests, and focus on the derivation of rheological parameters only; i.e. they do not attempt to simulate the processes occurring during beaching itself. The tests are also of very limited sample size. However, they have an important advantage in that they are relatively inexpensive and quick, which means that tests can be repeated and a range of samples can be tested in a single programme.
Flume tests, pilot-scale beach trials, and pipe loop tests, on the other hand, are conducted at a scale and using a methodology specifically designed to be as representative of the slurry behaviour as possible. However, they have costly equipment requirements. The size of the tailings sample, and the effort required to prepare it to the required slurry density, limits the number of tests that can be conducted and therefore limits the flexibility, and ultimately the representativeness, of the testing programme. The question soon becomes one of whether the sample size and scalability of the pilot-scale results justifies the lack of flexibility and, indeed, whether this flexibility is even required.
Over the course of a number of projects requiring the prediction of the beaching characteristics of high-density tailings at a range of percentage solids, the authors have observed the influence of a number of factors that affect the reliability of the estimates of the rheology of a slurry. Specifically, the interaction of reagents, flocculants, and extraction chemistry ultimately determines the chemistry of the slurry and the chemistry has a strong influence on the rheology. This observation is important because it is not always possible to fully simulate the chemistry of the full-scale processing situation when doing limited-scale tests. Indeed, in the case of a greenfield operation, it is impossible to fully simulate the full-scale chemistry. The authors have also observed the beaching characteristics of high sand content slurries. An obvious example is hydrocyclone underflow. These slurries exhibit very low yield stresses and, from pipe loop tests, appear to behave as Newtonian, yet they present beach slopes of the order of 20-30 per cent. It is therefore clear that particle size distribution also plays a very significant role in the determination of the beaching profile. These considerations are over and above the issues of sample representativeness in terms of mineralogy and particle size distribution.
A number of examples illustrating the influence of slurry chemistry, as well as a number of other considerations, are set out below together with an approach that attempts to bring them into consideration in the beach profile prediction process. But first, it is of interest to note the influence of rheological test methodology.
Influence of rheological test methodology
Figure 1 shows a plot of yield stress versus percentage solids of a tailings slurry. The yield stresses have been estimated three ways, namely:
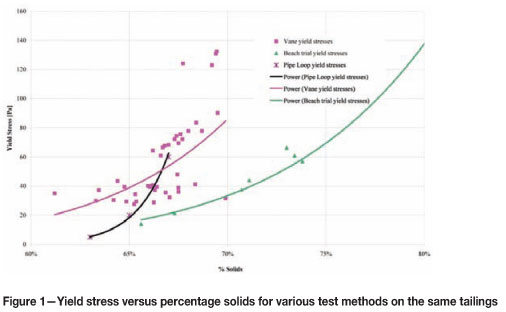
Using a vane rheometer
None of the methods specifically determines the yield stress, which by definition occurs at zero shear rate. Indeed, this is an issue with all rheological testing methods. In the case of the vane rheometer, the shear rate is indeterminable, so the measured yield stress is an estimate. In the case of the pipe loop tests and the beach trials, both of which involved the preparation and application of 3 m3 of slurry, the yield stress has had to be estimated by extrapolating back to the yield stress axis on the flow diagram.
It is evident from Figure 1 that there is considerable variability in the estimated yield stress between the methods. In this case, the vane rheometer and the beach trials have been conducted on exactly the same batch of slurry, but the pipe loop tests have been conducted on a separate batch of slurry. The tailings solids are from one sample set and therefore it is likely that differences in the preparation of the batches are also playing a role in the scatter. Since the tailings are from the same set of samples, which have been ground and blended, the differences are most likely related to slurry chemistry.
Influence of pH
The influence of pH on the rheology of a slurry is generally well appreciated, although not necessarily fully understood by thickener designers, and it is not always taken into consideration during testing for the purpose of beach profile estimation. Figure 2 shows a plot of yield stress versus percentage solids from vane testing on a tailings slurry. It is evident that there are two points that plot well below the trend line. These two points were from tests conducted on a slurry at a pH of 8, whereas the slurries on the trend line were all tested at a pH of 9.
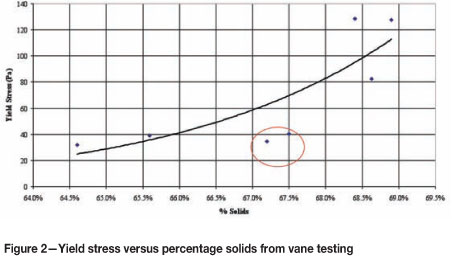
It is evident from Figure 2 that, in this case, the pH difference could result in a 30-40 per cent under- or over-estimation of the yield stress, depending on whether neutralization in the full-scale operation was taken into consideration in the testing programme.
Influence of flocculant type and dose
Testing of high-density slurries has a strong focus on the type and dose rate of flocculant to optimize thickener performance. There are many flocculants available on the market and it is normal for thickener vendors to conduct tests on a range of flocculants to determine which brand is the most effective for the specific tailings. But if the flocculant test results are not available at the time of testing for the beach profile prediction, the testing laboratory has no other option but to generate tailings at the appropriate density, using process plant liquor or, if this is unavailable, as in the case of greenfield projects, using tap water.
If pilot-scale testing is being carried out, the laboratory generating the tailings will generally have a pilot-scale thickener on site. Unless the testing is being done adjacent to an operating plant, so that large sources of process liquor are available, the slurry has to be mixed up with tap water and the pH adjusted. Then, in order to generate the slurry at the correct density for the testing, a flocculant is added to the slurry in the thickener. Very likely the flocculant dose will be elevated so as to minimize the sample preparation time.
Figure 3 shows a plot of yield stress versus per cent solids measured, using a vane rheometer on the same slurry but with and without flocculant dosage. The samples are taken directly from the base of the thickener and are therefore unsheared.
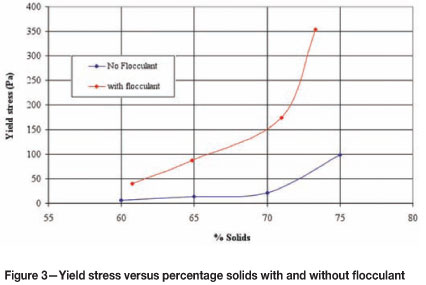
It is evident from Figure 3 that flocculant has a very significant effect on the yield stress of the unsheared slurry, potentially increasing it by a factor of three or more.
Influence of shear thinning
Just as the addition of flocculant increases the yield stress, so shearing of the slurry breaks down the flocc and induces shear thinning with a concomitant reduction in yield stress. Indeed it is common to build shear thinning into the design of a high-density slurry transport system.
Figure 4 indicates the effect on the yield stress, at a range of per cent solids, of shear thinning induced by longer agitation, and therefore longer shearing.
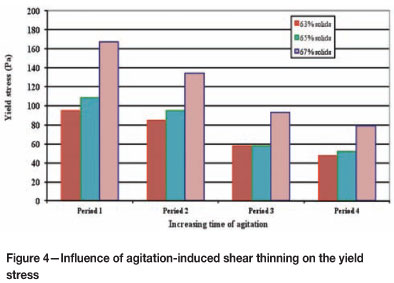
It is evident from Figure 4 that the yield stress reduced by more than 50 per cent in the case of the slurry tested. More important is the fact that, in order to estimate the yield stress on discharge onto the beach in the full-scale operation, it is necessary to estimate the degree of shearing up to the time of discharge. Conversely, if a higher yield stress is required it is necessary to estimate the extent to which it is practical to minimize the degree of shear thinning up to the time of discharge.
Because these considerations have a very significant impact on the testing of the slurry rheology, it is evident that when testing the slurry it will be important to either:
Influence of shear thickening
Tailings that possess a clay fraction such as montmorillonite may exhibit shear thickening behaviour. Figure 5 shows the change in yield stress of a shear thickening slurry at 66 per cent solids with increasing agitation duration. It is evident from Figure 5 that in the case of the slurry tested, the yield stress could more than double depending on the duration of shearing.
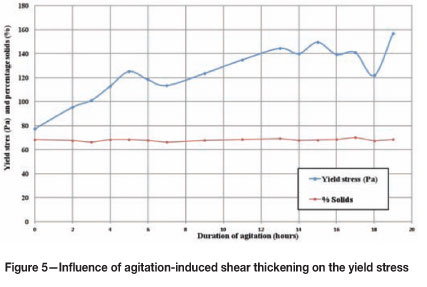
As in the case of a shear-thinning slurry, it is essential to give consideration to the likely degree of shear thickening at the point of discharge in the full-scale operation and then ensure that laboratory and small-scale beaching trials provide data that will cover the range of anticipated shear thickening.
Influence of stratification of the slurry stream
Tailings slurries at conventional consistencies of 35-50 per cent solids commonly undergo gravitational segregation during flow down the beach. For these tailings it is generally observed that the coarser particles in the slurry settle out early on the beach, causing the deposited tailings to become finer with distance down the beach.
Pinto and Barrera (2002) present beach slope data for copper tailings from seven copper mines where there are variations in particle specific gravity, particle size distribution, and slurry per cent solids. It is shown that even for tailings of similar specific gravity and density, there can be significant differences in the beach slope of the tailings.
It is generally observed that gravitational segregation reduces as the slurry per cent solids increases. The authors have worked with tailings that even at 57 per cent solids, do not show significant segregation into coarse and fine tailings down the beach. However, for these tailings there is significant difference in the full-scale beach slopes, as indicated in Table I. Also indicated in Table I are the yield stresses applicable to each slurry based on back-analysis of the full-scale beach profile using the stream power-entropy methodology (McPhail, 2008; Simms et al., 2011). There is a significant difference in the estimated yield stress.
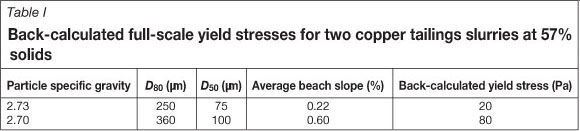
Mineralogical differences between the slurries, as well as the difference in grind, will contribute to the difference in beach slopes. However, it is the principal author's contention that, based on observation of high density slurries as these flow down the beach in both small-scale flumes as well as in full-scale operations, the difference relates also to density stratification of the slurry as this flows down the beach. It is argued that the slurry flowing closest to the bed is at a higher percentage solids than the average percentage solids of the slurry and therefore possesses a higher yield stress than the slurry as a whole. Moreover, it is contended that the extent of stratification is related to the degree of shear thinning and residual flocc characteristics of the flocculated slurry. Since the beach slope is determined by the rheology of the material at the bed face where the deposition of solids takes place, and given the relatively small differences in particle specific gravity and grind, it is considered likely that density stratification accounts for the majority of the differences set out in Table I.
Influence of sand content
Slurries with high sand content, such as those generated when the run-of-mill tailings stream is split into fine and coarse particles using hydrocyclones are, in the authors' experience, generally of low to negligible yield stress. This is because cohesive forces responsible for generating yield stress in slurries are more active between fine particles. In such cases the beach profile is generally steep, whatever the percentage solids of the slurry. At conventional percentage solids, the sands rapidly migrate to the base of the flow stream after discharge and the upper part of the flow stream is dominated by water flow. In high-density slurries there is less separation of water and sands. As a result, most sand slurries beach steeply at 20-30 per cent. These slopes are achieved in the absence of a yield stress and the beaching behaviour appears to be dominated by viscosity.
It would seem logical, therefore, that run-of-mill tailings that have a high sand content will have their beaching characteristics determined by both the yield stress generated by the fine fraction in the tailings, as well as by the sand fraction, which will tend to influence the apparent viscosity of the slurry.
Sensitivity of beach profile predictions to the yield stress
The net effect of the factors discussed so far is to introduce uncertainty into the estimate of yield stress. The question is whether the range will have a significant effect on the beach profile predictions. To assess this, consider a typical tailings operating scenario:
The stream power-entropy method of analysis (McPhail, 2008; Simms et al., 2011) has been used to predict the beach profiles for yield stresses of 20, 40, 60, 80, and 100 Pa. To ensure that the influence on beach profile is confined to variation in the yield stress, the slurry is taken as a Bingham plastic with a constant Bingham viscosity of 0.05 Pas. In reality, the factors discussed also have an influence on the apparent viscosity, with the changes in viscosity most likely emulating the changes in yield stress.
Table II shows the resulting average beach profiles, as well as a measure of the concavity of the profile, where the measure is calculated as the maximum vertical height difference between the predicted beach profile and a straight line profile at the average slope.
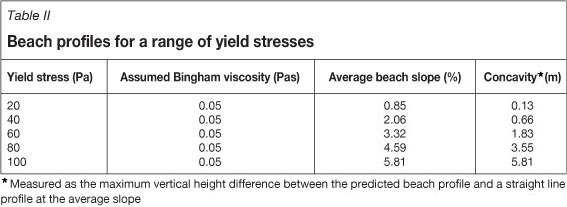
It is evident from Table II that yield stress has a very significant impact on the beach profile predictions.
Sensitivity of the beach profile to viscosity
To assess the importance of viscosity on the beach profile prediction, consider the example mining situation applied in the previous section but assume the yield stress is a constant 20 Pa, the flow diagram linear, and the resulting Bingham viscosity to vary from 0.02-0.5 Pas. Table III sets out beach profile results predicted, using the stream power-entropy method (McPhail, 2008; Simms et al., 2011).
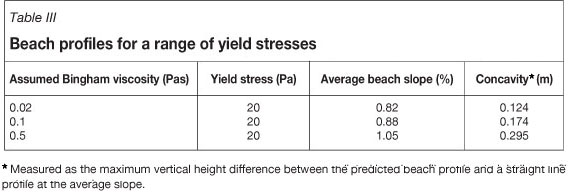
The Bingham viscosity is shown to have a relatively minor influence on the beach slope compared with the yield stress, but is an important factor nonetheless.
Suggested rheological testing approach
In light of the observations set out previously, it would seem prudent, in developing and implementing a rheology testing programme for the purposes of beach profile prediction, to ensure that the following points are observed:
When conducting pilot-scale testing, it will be vital to ensure that the pH, flocculant addition, and other chemical parameters are known at the time of testing. In fact, as far as is practicable, the pilot-scale testing should be conducted with liquor that is representative of the proposed operation; i.e. testing should proceed after decisions on flocculation type and dose.
Since, other than for operating processing plants, it will be nearly impossible to ensure that the chemistry and the flocculant addition are precisely the same as the full-scale operation, it is suggested that laboratory testing should be used to develop a sensitivity analysis of the estimated yield stress to variations in pH, flocculant, and other chemical parameters. Then, when interpreting the results of the test work, cognisance should be taken of the laboratory-derived sensitivity analysis as well as the sensitivity of the yield stress to testing method.
When comparing laboratory-determined flow diagram parameters with those derived from pilot-scale or full-scale trials, cognisance must be taken of the well-known Moody-Rabinowitch correction to derive the bulk shear rates.
Application of rheology to beach profile prediction
Having ensured that the rheological testing is as representative as possible, all that remains is to select parameters that will enable calculation of the most probable profile. At this stage it is appropriate to take note of the accuracy of the current methods of beach profile estimation. It is the authors' opinion that, based on the current state-of-the-art with regard to beach profile prediction, the statistical uncertainty of the yield stress at the discharge onto the beach, together with the issue of stratification, is likely to introduce uncertainty and variability in the predictions of a similar order of magnitude to the uncertainty associated with the beach profile prediction methods, as they currently stand. It will therefore be vital to conduct a sensitivity analysis and apply probabilistic methods to analysis of the answers, so that profile predictions are presented with confidence bands.
Conclusions
This paper has documented rheological data measured and collated over a number of mining projects, some of which are greenfield and some of which are in operation. The data presented has shown that the following factors significantly influence the yield stress of a slurry:
The data shows that each of the factors listed above can affect the yield stress by between 30 and 300 per cent. It has been demonstrated, using the stream power-entropy beach profile prediction approach, that the yield stress has a significant impact on the beach profile prediction. While yield stress has been the focus of this paper, it should be borne in mind that the full rheological flow diagram has an impact on the beaching predictions and it is therefore important to track the variability of slurry rheology over the full range of shear rates.
It is concluded that it is vital, when carrying out rheological testing and profile prediction that, in addition to ensuring that the slurry is made up of tailings of representative particle size distribution and mineralogy, the slurry must be as representative as possible of the full-scale slurry having regard to the factors listed above. Where practical, rheological tests should be repeated until consistent results are obtained between tests.
When developing beach profile predictions it is vital to carry out a sensitivity analysis and present the results on a probabilistic basis with confidence bands. A rheological testing protocol has been suggested that will assist in the development of the sensitivity analysis and confidence bands.
Acknowledgements
The authors would like to acknowledge all mining companies that are braving the bleeding edge of the beach profile prediction technology in their quest to improve the efficiency and effectiveness of tailings management through the adoption of high-density tailings. It is these companies that are enabling the accumulation of data and experience that will ultimately mature the technology and benefit the industry as a whole.
References
MCPHAIL, G. 1995. Prediction of the beaching characteristics of hydraulically placed tailings. PhD dissertation, University of the Witwatersrand, Johannesburg, South Africa. [ Links ]
MCPHAIL, G. 2008. Prediction of the beach profile of high density thickened tailings from rheological and small scale trial deposition data. Paste08. Proceedings of the 11th International Seminar on Paste and Thickened Tailings, Kasane, Botswana, 5-9 May 2008. Fourie, A.B., Jewell, R.J., Slatter, P., and Paterson, A. (eds.). Australian Centrefor Geomechanics, Perth. pp. 179-188. [ Links ]
PINTO, M. AND BARRERA, S. 2002. Tailings beach slope forecasting - copper tailings. Tailings and Mine Waste '02. Proceedings of the Ninth International Conference on Tailings and Mine Waste, Fort Collins, colorado, USA, 27-30 January 2002. pp. 87-94. [ Links ]
SIMMS, P., WILLIAMS, M.P.A., FITTON, T,. AND MCPHAIL, G. 2011. Beaching angles and evolution of stack geometry for thickened tailings - A review. Paste2011. Proceedings of the 14th International Seminar on Paste and Thickened Tailings, Perth, Australia, 5-7 April 2011. Jewell, R.J. and Fourie, A.B. (eds.). Australian Centrefor Geomechanics, Perth. pp. 323-338. [ Links ]
SOFRA, F., FISHER, D.T., AND BOGER, D.V. 2007. The bucket rheometer for thickened tailings and paste flow curve determination. Paste07. Proceedings of the Tenth International Seminar on Paste and Thickened Tailings Perth, Australia, 13-15 March 2007. Fourie, A.B. and Jewell, R.J. (eds.). Australian Centrefor Geomechanics, Perth. pp. 249-258. [ Links ]
©The Southern African Institute of Mining and Metallurgy, 2012.ISSN 2225-6253. This paper was first presented at the, 15th International Seminar on Paste and Thickened Tailings (Paste) 2012, 16-19 April 2012, Sun City, South Africa.

