


Services on Demand
Article
 English (pdf)
 Article in xml format
 Article references
Indicators

Related links
-
 Cited by Google
 -
 Similars in Google
Share

 Permalink
Journal of the Southern African Institute of Mining and Metallurgy
On-line version ISSN 2411-9717
Print version ISSN 2225-6253
J. S. Afr. Inst. Min. Metall. vol.112 spe Johannesburg Jul. 2012
TRANSACTION PAPER
Gas-phase fluorination kinetics of Ta2O5 with elemental fluorine
A.D. Pienaar; B.M. Vilakazi
South African Nuclear Energy Corporation Ltd. (Necsa)
SYNOPSIS
The aqueous chemistry of niobium and tantalum compounds with hydrofluoric acid is a mature field of investigation. In contrast, very little attention has been paid to reactions of these compounds in non-aqueous environments. Similarly, reactions of elemental fluorine with niobium and tantalum compounds have received little more than cursory attention in literature. This work discusses the isothermal reaction kinetics derived from thermogravimetry, using a less redundant approach than is currently the standard. We also discuss the most likely kinetic models for this reaction.
Keywords: Fluorination, tantalum, Ta2O5, thermogravimetry, reaction mechanism.
Introduction
Tantalum is present in the earth's crust at 2 χ 10-4 weight per cent, and occurs mostly in minerals such as tantalite and columbite1. Classically, the extraction of tantalum takes place via treatment with aqueous HF and liquid-liquid extraction2,3, which involves the use of organic solvents such as tributyl phosphate, cyclohexanone, octanols, and methyl isobutyl ketone (MIBK)4-6.
Processing of niobium and tantalum using this method has allowed a good understanding of the aqueous chemistry of tantalum in HF(aq) solutions'^, but there is no elegant solution for the treatment of the large amounts of organic- and HF-containing waste that is generated.
Treatment of tantalum-containing minerals with alternative anhydrous fluorine sources may prove beneficial concerning waste treatment, or even process economics, but inadequate fundamental knowledge of such reactions makes process development unlikely.
In tantalum-containing minerals, the metal is usually in pentoxide formio, and though no study has been conducted into the reaction between tantalum pentoxide (Ta2O5) and elemental fluorine (F2), Rakovii studied the chemically similar niobium pentoxide (Nb2O5). Knowledge of both these reactions will prove beneficial if mineral processing using fluorine is attempted.
Thermogravimetry is a useful technique for obtaining kinetic information on gas-solid interactions, and is employed in this study to investigate the kinetics of the reaction between Ta2O5 and F2.
Experimental
Commercially available Ta2O5 (99%+, Sigma Aldrich, Alfa Aeser) was used for all experiments.
A Perkin Elmer TGS2 thermogravimetric analysor (TGA) modified for use with corrosive gases was used in these experiments. The complete experimental set-up was located in an N2-filled glove box. Samples between 10 and 30 mg were loaded into nickel TG sample crucibles.
For the first run, the temperature was ramped up at 10°C.min-1 to 500°C under constant F2 (10% F2 in N2) flow. For subsequent runs, the temperature was equilibrated at 315, 325, 335, and 345°C before F2 was introduced.
Several runs were completed at each temperature, exposing the sample to F2 for 5, 10, 20, 60 and 120 minutes respectively.
Theory behind experimental runs
Though kinetic parameters may be calculated using a single TG run, it is accepted in modern thermal analysis that determination of kinetic parameters from a single TG programme should be avoided12. It is also accepted that when employing the scientific method, a minimum of three to five repetitions for every data point is required to ensure reproducibility of reported results.
Considering this, the time it would take to complete five runs at four temperatures for a 2 hour reaction amounts to 40 hours, excluding sample preparation and instrument cool-down time. For the experiments conducted here, reaction time is reduced to 14 hours.
During a TGA run the conversion value, a, is defined as:
![]()
with mo the initial mass, mt the instantaneous mass and the final mass after reaction.
If we assume that at a set temperature the reaction proceeds along the same pathway, the five runs at each temperature can be combined into a single data set with the α value at 5 minutes for each run equal to the conversion at the end of the 5 minute run, and so forth.
By using this method not only time is saved, but five-fold repetition becomes inherent to the data set. Any spurious data points can immediately be identified by comparison of the slopes of the TG curves.
Results and discussion
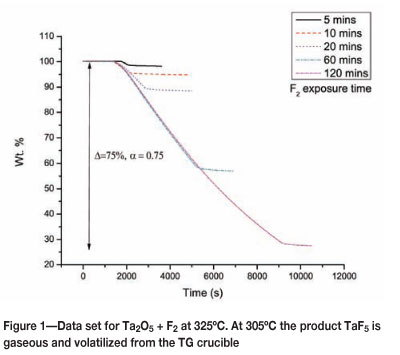
The reaction of Ta2O5 and F2 is described by the equation:
Ta205(s) + 5F2(g) - 2TaF5(g) + 2.502(g)
which should result in 100 per cent conversion if complete to TaF5, which is gaseous at 305°C, is achieved.
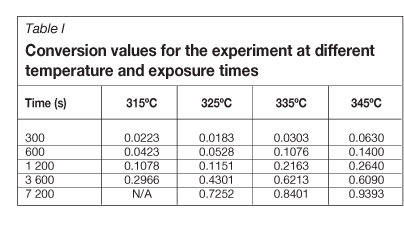
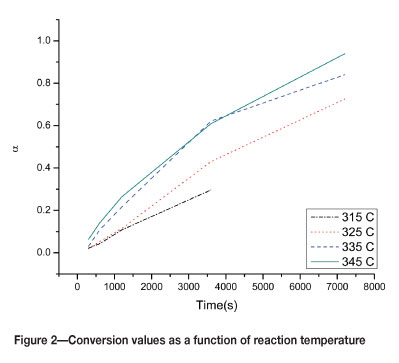
Figure 1 shows the data set for the reaction between Ta205 and F2 at 325°C, and Table I contains a complete list of conversion values at different temperatures and F2 exposure times. By plotting the values in Table I as a function of reaction time, we show that the data is consistent with the expectation of a faster reaction rate at higher reaction temperatures.
According to the kinetic equation (Equation [2]) conversion is a function of the rate constant k, the kinetic modelf(a), and pressure h(P). We will assume for this study that the effect of pressure is negligible.
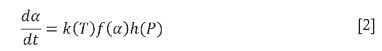
Mathematical expressions for ƒ(α) are well known13,14 and will not be discussed in any detail here. The stability of the integral function off(a), g(a), across different temperatures is an additional requirement for selection of the correct reaction models15.
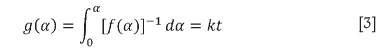
One of the quickest ways to determine the kinetic model for the reaction is by determining the linearity of a plot of g(a), the integral form off(a), against timei6, since according to Equation [3], g(a) has to equal kt.
The stability of g(a) across different temperatures, which is an additional requirement for selection of the correct reaction models, for these experiments is best satisfied by the F2 and A3/2 mechanisms. To determine the validity of each model across the different temperature ranges, we use the Boolean argument:
If (v1&v2&v3&v4) > x then Fit = True
with vi ... 4 the values of the correlation coefficient at 315, 325, 335, and 345°C respectively and the value of x the correlation coefficient limit set at 0.99 or 0.97.
The result for this test, summarized in Table II, show nine models that satisfy the criteria for x>0.97 but only one for x>0.99.
Unfortunately, it is often the case that several kinetic models fit a set of data, at which point some interpretation is needed. Specifically, it needs to be considered what type of reaction is being studied and the physical processes involved.
While the F2 model is the only one that satisfies the criteria on x > 0.99, this model indicates a second-order chemical reaction. A second-order kinetic reaction is intrinsically linked to the concentration of the reactants at any time. With F2 in excess at all times at least pseudo first-order kinetics would be expected, and with reaction rate independent of F2 exposure time (as suggested by coinciding TG curves), we consider the F2 kinetic model unlikely.
Evaluating the models for which x>0.97, there are four alternative groups of mechanisms possible.
The P1 mechanism obeys the Mampel power law, and is one of a group of acceleratory rate equations. The rate for this model is determined by a nucleation step. We could unfortunately find no reference to other gas-solid reaction proceeding along this pathway.
The A2/3 model indicates an Avrami-Erofeev mechanism, which is a phase-boundary controlled reaction that assumes nucleation occurs in such a way that the surface of each particle is covered with a layer of product17.
The R2 as well as the R3 models suggested by Rakov11 for the niobium reaction is also a phase-boundary controlled reaction based on a contracting sphere model. During a reaction following this mechanism, the rate is determined by the movement of a reaction interface at a constant velocity inwardly.
Diffusion-controlled mechanisms are shown by the symbol D, and the reaction is governed by diffusion. For the D1 mechanism, one-dimensional diffusion takes place. Three-dimensional diffusion is considered in both the D6 and D7 models.
When considering these possibilities, it is necessary to further evaluate the physical aspects of the reaction. During fluorination of the tantalum oxide species, two possibilities occur at the reaction interface.
The first of these involves formation of a solid intermediate, possibly an oxyfluoride, that covers the reaction surface. If this scenario occurs, the F2 gas needs to diffuse through the solid layer so it can reach the unreacted core. This process has been reported for the fluorination of UO2 as well as CeO2 with elemental fluorine 19,20. a D-type mechanism is expected to occur during such a process.
A second one-step possibility exists for the fluorination reaction. If fluorination occurs in a single step, no intermediate is formed and therefore diffusion of the gas will not be needed for the reaction. This may be feasible even if the lifetime of the intermediate is too short to create a significant effect.
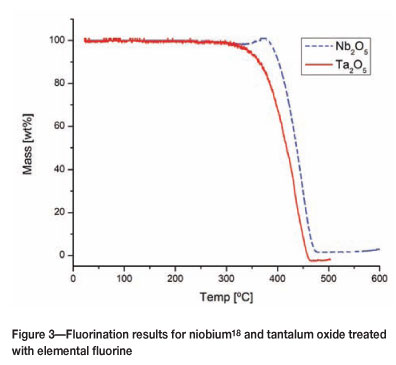
The reported fluorination of UO2 and CeO2 in both cases showed an initial increase in weight at the start of the fluori-nation reaction, corresponding to the formation of an oxyfluoride intermediate. This increase was also observed for TG fluorination experiments on niobium oxide (Figure 3), but not for the experiments on tantalum oxide, which supports the second possibility.
Even though the Avrami-Erofeev mechanism is more often associated with decomposition reactions during TG experiments, this fluorination may mimic decomposition since all product is removed into the gaseous phase. It is therefore in our opinion most likely that either the A3/2 or R3 model acts as governing mechanism for this reaction.
Calculating k for the two models that display the best correlation coefficient to linearity was then done by plotting g(a) against time and determining the slope (Table III).
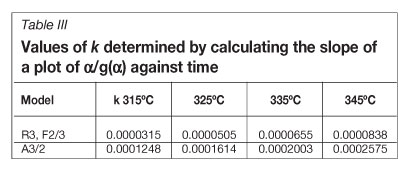
Substitution into the logarithmic form of the Arrhenius equation (Equation [4]) allows for calculation of the activation energy.
![]()
The slope of ln(k) against 1/T (Figure 5) is multiplied by -R (8.314 J/K) for the A3/2 value, to give 75.12 kJ.moK The R3 mechanism is based on a contracting sphere model, and leads to an activation energy of 96.67 kJ.mol-1.
Conclusion
From the experiments completed for this report we could see no definitive evidence of a two-step reaction mechanism as suggested by Rakovii for the Nb205 + F2 reaction. Similar to the assertion that R3 governs the fluorination of Nb205, our results indicate that either this mechanism or A3/2 fits Ta205 fluorination.
We therefore propose that if the reaction pathway for Ta205 + F2(g) proceeds along the A3/2 pathway, it has an activation energy of 75.12 kJ.mol-i. Conversely, if the R3 model governs the reaction, the activation energy is 96.67 kJ.mol-i.
The methodology employed led to significant time savings without compromising the accuracy of the results.
References
1. Agulyansky, A. The Chemistry of Tantalum and Niobium Fluoride Compounds. Elsevier, London, 2004. [ Links ]
2. Mai0r0v, V.G., Nik0laev, A.I., Skl0kin, L.I., and Baklan0va, I.V. Extractive recovery of tantalum(V) and niobium(V) with octanol from hydrofluoric acid solutions containing large amounts of titanium(IV). Russian Journal of Applied Chemistry, 2001. pp. 945-949. [ Links ]
3. Stevens0n, P.C. and Hicks, H.G. Separation of tantalum and niobium by solvent extraction. Analytical Chemistry, 1953. pp. 1517-1519. [ Links ]
4. Agulyansky, A., Agulyanski, L., and Travkin, V.F. Liquid-liquid extraction of tantalum with 2-octanol. Chemical Engineering and Processing, vol. 43, 2004. pp. 1231-1237. [ Links ]
5. Nik0laev, A.I. and Mai0R0v, V.G. New Approaches to niobium and tantalum extraction technology. Doklady Chemie, vol. 46, 2007. pp. 644-652. [ Links ]
6. Mai0r0v, V.G. and Nik0laev, A.I. Tantalum(V) and niobium(V) extraction by octanols. Hydrometallurgy, vol. 66, 2002. pp. 77-83. [ Links ]
7. G0ber, M.K., Kratz, J.V., and Zimmermann, H.P. Radiochimica Acta, vol. 57, 1992. p. 77. [ Links ]
8. Zimmermann, H.P., G0ber, M.K., and Kratz, J.V. Radiochimica Acta, vol. 60, 1993. p. 11. [ Links ]
9. Paulus, W., Kratz, J.V., Strub, E., Zauner, S., Brüchle, W., Pershina, Z., Schãdel, M., schausten, B., Adams, J.L., Greg0rich, K.E., H0ffman, D.C., Lane, M.R., Laue, C., Lee, D.M., McGrath, C.A., Shaughnessy, D.K., Strellis, D.A., and Sylwester, E.R. Extraction of the fluoride-, chloride-, and bromide complexes of the elements Nb, Ta, Pa, and 105 into aliphatic amines. Journal of Alloys and Compounds, vol. 292, 1998. [ Links ]
10. Enghag, P. Encyclopedia of the Elements. Wiley-VCH, Stockholm, 2000. [ Links ]
11. Rak0v, E.G., K0pchikhin, D.S., Sudarik0V, B.N., and Gr0m0v, B.V. Fluorination kinetics of Nb205. Atomnaya Energiya, vol. 31, 1971. pp. 137-138. [ Links ]
12. Vyaz0vkin, S., Burnham, A.K., Criad0, J.M., Pérez-Maqueda, L.A., P0pescu, C., and Sbirrazzu0li, N. ICTAC Kinetics Committee recommendation for performing kinetic computations on thermal analysis data. Thermochimica Acta, vol. 520, 2011. pp. 1-19. [ Links ]
13. Vlaev, L., Nedelchev, N., Gyur0va, K., and Zag0rcheva, M. A comparative study of non-isothermal kinetics of decomposition of calcium oxalate monohydrate. Journal of Analytical and Applied Pyrolysis, vol. 81, 2008. pp. 253-262. [ Links ]
14. Maitra, S., Pal, A.J., Bandy0padhyay, N., Das, S., and Pal, J. Use of genetic algorithm to determine the kinetic model of solid-state reactions. Journal of the American Ceramic Society, vol. 90, 2007. pp. 1611-1614. [ Links ]
15. Br0wn, M.E. Introduction to Thermal Analysis. Kluwer Academic Publishers, Dordrecht, 2001. [ Links ]
16. PtAcek, P., D. Kubâtovâ, D., Havlica, J., and BrandStetr, J. Isothermal kinetic analysis of the thermal decomposition of kaolinite: The thermo-gravimetric study. Thermochimica Acta, vol. 501, 2010. pp. 24-29. [ Links ]
17. Sharp, J.H., Brindley, G.W., and Achar, B.N.N. Numerical data for some commonly used solid state reaction equations. Journal of the American Ceramic Society, vol. 49, 1966. pp. 379-381. [ Links ]
18. Pienaar, A.D. and Wagener, J.B. Poster:Formation of oxylfuorides of Niobium and Tantalum using solid-gas reactions. 40th SACI Convention, Johannesburg, South Africa, 2011. [ Links ]
19. H0mma, S., U01, Y., Braun, A., K0ga, J., and Matsum0T0, S. Reaction model for fluorination of uranium dioxide using improved unreacted shrinking core model for expanding spherical particles. Journal of Nuclear Science and Technology, vol. 45, 2008. pp. 823-827. [ Links ]
20. Takashima, M., Fukami, S., N0saka, Y., and Unishi, T. Reaction between rare earth oxides and elemental fluorine. II. Kinetics of the fluorination of cerium dioxide. Journal of Flourine Chemistry, vol. 57, 1992. pp. 131-138. [ Links ]
©The Southern African Institute of Mining and Metallurgy, 2012. SA ISSN2225-6253. This paper was first presented at the ZrTa2011 New Metals Development Network Conference, 12-14 October 2011, Mount Grace Country House & Spa, Magaliesburg.

