


Services on Demand
Article
 English (pdf)
 Article in xml format
 Article references
Indicators

Related links
-
 Cited by Google
 -
 Similars in Google
Share

 Permalink
Journal of the Southern African Institute of Mining and Metallurgy
On-line version ISSN 2411-9717
Print version ISSN 2225-6253
J. S. Afr. Inst. Min. Metall. vol.112 n.12 Johannesburg Jan. 2012
The estimation of greenhouse gas emissions from South African surface and abandoned coal mines
A.P. CookI; P.J.D. LloydII
ILatona Consulting, Melville, South Africa
IIEnergy Institute, Cape Peninsula University of Technology, Cape Town, South Africa
SYNOPSIS
Gas samples were taken from a wide range of target areas on dumps arising from coal mining activities. Some of the dumps had largely burned out, some were still burning, some were in the process of rehabilitation, and on others rehabilitation was essentially complete.
It was found that rehabilitation was very effective in reducing emissions to tolerable levels. Even incomplete rehabilitation reduced the CO2 emissions to less than about 1 kg/m2/a, whereas some unrehabil-itated areas showed emissions of over 100 kg/m2/a. Some areas where there was active combustion taking place were also sampled, and they showed as much as 7 000 kg/m2/a, but the areas concerned were very small and their total contribution accordingly low. Analyses were also made for SOx, NOx, NH3, and CH4, but these were generally (and unexpectedly) at very low levels.
The mines sampled represented 53 per cent of all surface coal mining activity. Accordingly the estimated total emissions were scaled up, to arrive at estimates of 1 950 000 ± 350 000 t/a CO2, 2040 ± 580 t/a SOx, 306 ± 85t/a NOx, and 31 ± 9 t/a NH3 for all surface mines. Methane was detected only from burning coal, and due to the difficulty in sampling, no reliable estimate could be made of these methane emissions.
Keywords: coal mining, spontaneous combustion, emissions, carbon dioxide, sulphur oxides, nitrogen oxides, methane.
Introduction
The emission of methane from underground and surface coal mines in South Africa was reported by Lloyd and Cook (2005). The levels were significantly lower than those that had been assumed on the basis of Intergovernmental Panel on Climate Change (IPCC) default factors in the South African National Communications (Department of Environment Affairs and Tourism, 2009), but were accepted by the IPCC after review of the methodology employed.
Otter et al. (2005) characterized emissions from spontaneous combustion of coal on South African mines. Aerial monitoring showed high concentrations of PM2.5, CO2, SO2, and NO2 in the plumes arising from spontaneous combustion, and significant emissions of benzene and toluene. These were confirmed in later ground-based measurements, with SO2 levels regularly exceeding the 19 ppb limit set in the Air Quality Act. CO2 levels were as much as 400 ppm above atmospheric, and CO and O3 levels were elevated.
Coal forms when vegetable matter is converted into peat, which in turn is converted successively into lignite, sub-bituminous coal, bituminous coal, and finally anthracite by heating and pressure as the peat is buried in the earth's crust. Coal is oxidized slowly when exposed to air, and a mass such as a heap of coal can be heated by this slow oxidation until the temperature is high enough for combustion to occur. Waste coal dumps can still contain sufficient coal matter for this to occur. (Brooks, Svanas, and Glasser 1988). Combustion controlled is by restricting the ingress of air, which can be achieved by compaction of the coal mass and/or covering the coal mass with compacted soil, (Lloyd, 2002). The soil may be grassed to initiate biological rehabilitation.
Abandoned mines contain considerable quantities of coal in pillars and the floor and roof. Pillar weakening may cause collapses which allow air to enter the mine and again cause spontaneous combustion. Some fires in abandoned mines in the Emhlahleni (Witbank) area of South Africa have been burning for many years as a result of this phenomenon.
It seemed desirable to attempt to quantify the contribution of these additional sources of greenhouse gases. Some 'guesstimates' of the rate of combustion of old mine workings suggested over 1 Mt of CO2 per annum. This was clearly significant in the context of South Africa's emissions. However, it was recognized that it would be challenging to truly quantify the emissions, because the wastes subject to spontaneous combustion ranged from open heaps of low-grade coal through fully burned-out dumps to dumps that had been rehabilitated and sealed to prevent any spread of combustion. It is thus the purpose of this paper to describe the attempts to determine the contribution by the coal mining industry resulting from spontaneous combustion.
Methodology
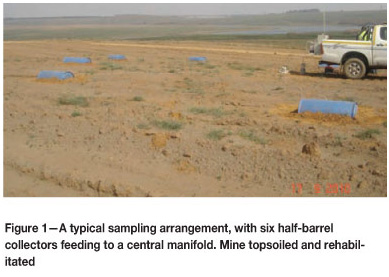
The measurement technique was adapted from that developed and tested by Carras et al. (2009). The flux meters Carras et al. had employed covered too small an area to efficiently sample emissions from some of the dump materials. Accordingly a range of collectors of different areas was tested. The tests included both rigid and soft-sided devices, of varying sizes and shapes covering from about 0.3 m2 to 9 m2. They were compared by measuring the loss of a known concentration of tracer gas inside the meter over a period of time, for different surfaces and wind conditions. The lowest loss was shown by a collector comprising half of a 220 litre plastic drum, 0.91 m high by 0.54 m in diameter, thus covering an area of 0.491 m2 and having a volume of 0.115 m3.
A collector was connected by a 6 mm diameter plastic tube, 10 m long, to a sampling manifold. Six such collectors were deployed in any one sampling campaign, arranged in a circle about 20 m in diameter with the sampling manifold at its centre. Figure 1 illustrates a typical sampling site.
Pumps pulled the gas from the collectors at a rate of 2.40 litres per minute. The volume of the sampling manifold was 2.40 litres, so the gas changed once a minute. There were four sampling ports on the sampling manifold. Three led through different absorber trains each fed at 800 ml per minute, where reactive gases NOx, SOx, and NH3 could be collected. The fourth fed via a high-pressure pump to stainless-steel U-tubes of 10 ml volume, which were filled at approximately 600 kPa.
Gas samples were taken over a period of one hour for the determination of nitrogen oxides, sulphur oxides, and ammonia using impinger trains. The liquids from the absorbers were analyzed by NECSA using ion chromatography for NOx, titrimetry for SOx, and UV spectroscopy for NH3. The gas from the stainless-steel U-tubes was analysed by NECSA for permanent gases and hydrocarbons, using a refinery gas analyser manufactured by Analytical Controls (Netherlands), in which the gases are separated chromatographically and individually detected using a combination of flame ionization and thermal conductivity detectors. The analyser was calibrated using a certified calibration mixture containing 27 individual gases.
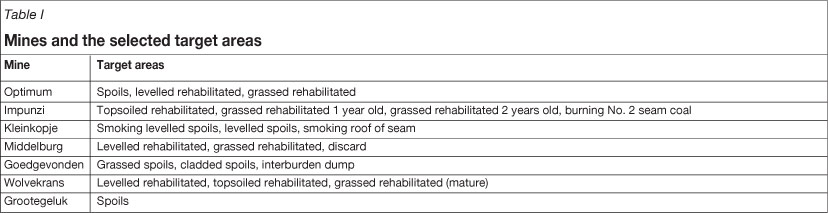
Sample sites were established on a range of target areas on six surface mines and on a large discard dump on a seventh mine. The target areas were selected to be as representative as possible for the particular mine. There were different target areas on different mines, and some areas were selected because they showed visible fire or spontaneous combustion. The various mines, and a description of the target area on each, are listed in Table I.
Figure 1 shows a typical topography of a rehabilitated site which has been topsoiled. Figure 2 illustrates the topography typical of other various target areas.
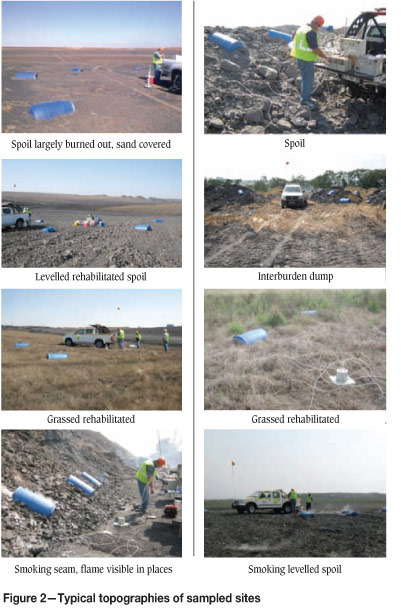
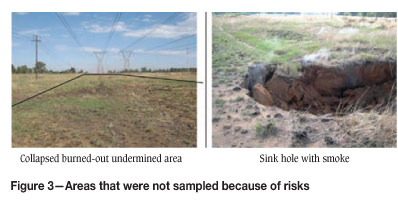
Figure 3 shows some areas that were not sampled because of the hazard that sampling presented.
The flux values were determined from the increase in gas concentrations in the samples collected over the 1 hour period, into the known volumes of the barrels, and over the known area of the barrels. The fluxes were thus reported as the mass of gas emitted per area per time, typically, kilograms per square metre per year. Each of the mines then provided an estimate of the total area of each kind of target area on the mine, and the total emissions were calculated as the flux for that type of target area multiplied by the total area of that type of target on the mine.
Results
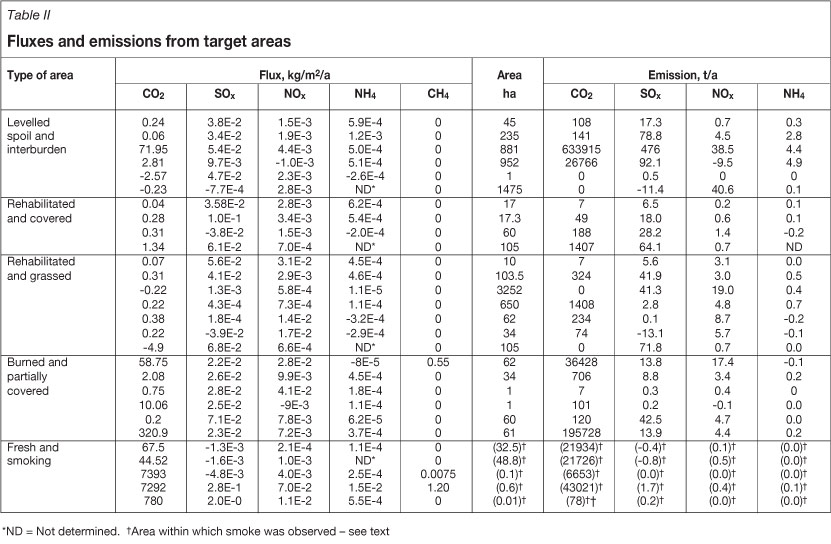
The emissions of CO2, SOx, NOx, and NH3 from the various types of areas on the various mines are summarized in Table II.
On some dumps and in some locations, there was visible smoke. Samples were taken at points of emission of smoke, but these were sporadic across the area. The area reported is an estimate of the area concerned, but the estimate was at best subjective because of the very nature of the emission. Thus the values reported in parentheses () are subject to large errors, and are probably only within an order of magnitude at best. They are therefore not included in the further analysis, but are reported here for completeness' sake.
Only three methane values were reported. A dump that had nearly burned out and which had a CO2 emission of 58 kg/m2/a had a methane emission of 0.55 kg/m2/a. Two burning areas were sampled. Both had CO2 emissions over 7000 kg/m2/a, but one had only 0.0075 kg/m2/a CH4 whereas the other gave 1.2 kg/m2/a CH4. The difference between the two sites was that one was a dump on which rehabilitation had already started, whereas the other was raw coal recently mined.
Discussion
The emissions given in Table II total 898 000 t CO2, 948 t SOx, 153 t NOx, and 14 t NH3 annually. Most of the CO2 emissions come from two large sites which emit about 200 000 and 600 000 t CO2 per annum. The distribution of emissions from the various sites is given in Figure 4.
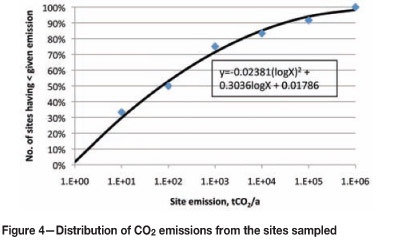
The model shown in Figure 4 is highly significant, with r2 = 0.996.
Table II is arranged in order of remediation, from essentially unremediated material at the top grading down to fully grassed material, with two sections at the bottom covering respectively old essentially unremediated dumps in which nearly all combustible material has been burned, and raw coal prior to any handling. Most of the large emissions occur at sites near the top of the table.
This shows that remediation is very effective. The maximum emission from areas that have been levelled and topsoiled is less than 1500 t CO2 per annum, and even larger areas that have also been grassed show similar low emissions. It is only material that continues to have access to the air that presents a significant risk of emissions.
This includes the material on dumps that have nearly completely burned out. In some cases an attempt was made to remediate these dumps by a sand cover, but there was no evidence that this had been effective. They have continued to burn at a rate similar to material that had not been covered by sand. The emissions have visibly become less with time, and several of the dumps are now no longer contributing to the emissions. Importantly, the mines are no longer operating to produce more of this type of waste, so the emissions are temporary and declining. In considering the totality of the industry, these legacy emissions will be ignored, and only added back in to the total emissions at the end of the analysis.
The calculation of the estimated emissions from surface mines due to spontaneous combustion of wastes from coal mining is given in Table III. The mines which were sampled produce some 53 million tons of coal annually, which is about 45 per cent of the 120 million tons produced by all surface operations. Therefore the emissions from the sampled mines were scaled up proportionately to the total tonnage produced to compute an estimate of the total emissions.
The accuracy of this estimate is determined primarily by the extent to which the area sampled was representative of the whole area. Most of the dumps appeared relatively homogeneous, and the target areas were chosen very much at random, so there is no reason to suspect gross inhomo-geneity. It seems reasonable to assume about a 20 per cent standard deviation to account for lack of representativeness.
The CO2 measurements were associated with an error of about ±0.1 kg/m2/a, as judged from the number of negative values found at low flux levels. However, there were two strongly negative values that were outside this range. There was little to suggest the source of an error of this magnitude. Examination showed that in both cases there was quite a lot of vegetation in the sampled area, and it is suspected that photosynthesis was continuing during the sampling. If so, it would have had the effect of reducing the apparent CO2 emission. The drums appeared opaque, but were in fact quite translucent.
The trace gases were at a lower level than had been anticipated, and are accordingly believed to have suffered from a larger measurement error than the carbon dioxide. A relative standard deviation of about 20 per cent seems likely.
Methane was detected only from burning coal. Due to the difficulty in sampling in this area and the huge range of values observed, no reliable estimate of these emissions can be made, and in any event they are by their very nature short-term. Previous measurements of methane emissions from surface mines coal seams were estimated by Lloyd and Cook (2005) at 3000 t/a, so total methane emissions are unlikely to exceed 10 000 t/a.
The areas that were emitting smoke when they were sampled were responsible for less than 100000 t/a CO2, so the CO2 emissions from this source for all mines were of the order of 220 000 t/a. A 20 per cent standard deviation on the 1 730 000 t/a CO2 from all other sources would amount to about 346000 t/a CO2, so the smoke-emitting areas total somewhat less than the error on the other sources. Accordingly it seems reasonable to increase the estimated total CO2 emissions by about 220 000 t/a and retain a 20 per cent error bound on this increased estimate. Accordingly the CO2 emissions amount to 1 950 000 ±350 000 t/a.
The contribution of the other gases from the smoke-emitting areas was minimal, so these emissions are estimated at 2040 ± 580 t/a SOx, 306 ± 85 t/a NOx, and 31 ± 9 t/a NH3.
Carbon dioxide is the largest contributor to greenhouse gas emission from South African surface and abandoned coal mines at 1 950 000 ± 350 000 t/a. Of this, 220 000 t/a is attributable to areas with visible smoke or fire.
Acknowledgement
This research was conducted for, and was supported by, the Coaltech Research Association, whose assistance is gratefully acknowledged.
References
BROOKS, K., SVANAS, N., and GLASSER, D. 1988. Evaluating the risk of spontaneous combustion in coal stockpiles. Fuel, vol. 67, no. 5. pp. 651-656. [ Links ]
CARRAS, J.N., DAY, S.J, SAGHAFI, A., and WILLIAMS, D.J. 2009. Greenhouse gas emissions from low-temperature oxidation and spontaneous combustion at open-cut coal mines in Australia. International Journal of Coal Geology, vol. 78, no. 2. pp 161-168. [ Links ]
Department of Environment Affairs and Tourism. 2009. Greenhouse gas inventory South Africa 1990-2000. DEAT, Pretoria. [ Links ]
LLOYD P. 2002. Coal mining and the environment. International Bar Association Annual Meeting, Durban, Oct. 2002. [ Links ]
LLOYD, P. and COOK, A. 2005. Methane release from South African coal mines. Journal of the South African Institute of Mining and Metallurgy, vol. 105, no. 7. pp. 483-490. [ Links ]
OTTER, L, PIKETH, S., DLAMINI, T., and BURGER, R. 2005. Characterization of spontaneous combustion emissions. Final Report to Coaltech 2020. Climatology Research Group, University of the Witwatersrand, Johannesburg. [ Links ]
© The Southern African Institute of Mining and Metallurgy, 2012. ISSN2225-6253. Paper received Aug. 2012; revised paper received Oct. 2012.

