


Servicios Personalizados
Articulo
 Inglés (pdf)
 Articulo en XML
 Referencias del artículo
Indicadores

Links relacionados
-
 Citado por Google
 -
 Similares en Google
Compartir

 Permalink
Journal of the Southern African Institute of Mining and Metallurgy
versión On-line ISSN 2411-9717
versión impresa ISSN 2225-6253
J. S. Afr. Inst. Min. Metall. vol.112 no.8 Johannesburg ene. 2012
JOURNAL PAPER
Linear elastic numerical modelling for failure predictionan assesment
S.K. Murphy
AngloGold Ashanti Africa Region
SYNOPSIS
A partial shaft pillar extraction project was embarked on at a mine in the West Wits mining region in South Africa. Prior to the extraction, a rock engineering assessment was conducted with the main objective being to establish which areas of the shaft pillar could be extracted without unduly affecting the stability of major infrastructure within the shaft pillar. Standard numerical modelling methods were used to conduct this assessment and several areas were identified for extraction. However, during the extraction process, it was found that the infrastructure was affected more than was originally predicted by linear elastic modelling. In addition to this, several large events resulted in far more large aftershocks than would normally be predicted.
In order to gain an understanding of this phenomenon, seismic data was integrated with numerical modelling as follows:
> The seismic data in the form of displacements was integrated in 3D space within the model to assess the effect of static stress changes associated with seismic activity
> Data from large events was integrated onto specific structures, where displacements associated with large events were integrated onto the plane of structure in question.
This paper describes the methodology and results obtained from each of the above processes and include insights into the mining process that were previously unfathomable using standard linear elastic numerical modelling. The way forward for this rock engineering assessment of partial shaft pillar extraction is also discussed.
Keywords: modelling, rock engineering, failure.
Introduction
TauTona Gold Mine is the easternmost of the three adjoining mines that formerly constituted the greater ultra-deep mining complex known as the Western Deep Levels Gold Mine, which commenced mining some 40 years ago. Currently, the Carbon Leader stopes are the deepest ore-producing excavations in the world, with a maximum depth of 3456 m below surface. Using a layout of strike-aligned stabilizing pillars that yields an extraction of 80 per cent, the very narrow 20 degree dipping Carbon Leader Reef (CLR) orebody has been mined to a working height of about 1 m over an area exceeding 5 km on strike and 3.5 km in the dip direction.
Because of the great depth and extent of mining, and because the surrounding quartzites are strong and brittle and major faults and dykes are common, large seismic events are a continuous risk, which sometimes cause severe rockburst damage. With the use of appropriate layouts based on sound rock engineering principles and careful sequencing of stoping which is guided by continuous seismic monitoring of the rock mass response, the frequency of large seismic events has reduced. Largely as a result of the full-scale introduction of backfill and improved face support, the rockburst problem in stoping has been reasonably well controlled during the past few years. This led to re-assessment of other opportunities at TauTona Mine previously considered unavailable, specifically the shaft pillars.
Two shaft pillars, one on the Ventersdorp Contact Reef (VCR) and the other on the CLR, protect the shaft infrastructure at TauTona Mine. The VCR pillar is approximately 950 m χ 950 m at a depth ranging from 1774 m to 2024 m below surface, and the CLR shaft pillar is a 950 m χ 950 m (902 500 m2) pillar situated between 2624 m and 2874 m below surface. The initial plan was to extract the VCR pillar from TauTona Mine and the CLR from Mponeng Mine. However, it was found that the shaft barrels at Mponeng Mine could not exclusively supply the ventilation requirement for this mining.
In January 2001 a decision was taken that TauTona Mine would become a stand-alone project and not be incorporated into the Mponeng Project, and that partial extraction of the pillars would be carried out. Partial extraction of shaft pillars effectively requires that any mining within the VCR and CLR pillar boundaries be designed to ensure the integrity of the critical infrastructure within the shaft pillar areas. For the sake of brevity, this paper is restricted to the partial extraction of the Carbon Leader shaft pillar.
The partial extraction of the Carbon Leader shaft pillar was designed using a quasi-static stress assessment with a linear elastic model. In addition to this, a statistical hazard assessment of the expected seismic response to this mining was conducted using historical data from a previously mined high-stressed block of ground. This assessment did not reveal any major problems associated with the planned mining within the shaft pillar. However, at the time of this investigation numerical modelling tools for integration with seismic data were either still being researched or not available. In effect, the total design of mining in the shaft pillar was done with limited understanding of the overall seismic response that could be expected from the planned mining.
The initial approach to mining within the shaft pillar boundaries was to have a maximum of 6 m face advance. In addition, the extraction was to be done consecutively, with the 97 area first, the RH1 second, and 101/Thulani area to be the final part of the extraction (areas shown in Figure 1). Progressively during business planning processes (gold deficits in the mine plan being the main driver) the mining rate was increased to 9 m, and later further similarly driven decisions were made to simultaneously extract some of the areas. These decisions were justified at the time by the quasi-static modelling results, the large expanse of the shaft pillar, and the initial seismic hazard assessment, although still with limited understanding of the expected seismic response.
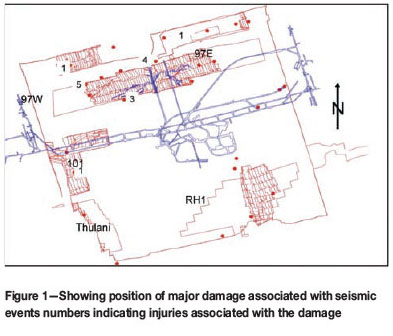
These decisions have resulted in a significantly higher adverse seismic response than was expected. Moreover, the geological environment has been found to be far more complex than was envisaged during the initial assessment of the pillar extraction. In this environment, both best-practice extraction strategies (in most instances) and what can be considered as the best support system in the world have not prevented major damage, resulting in the loss of production and numerous injuries (as shown in Figure 1).
In addition to the above, what can be considered as major challenge to the long-term viability of TauTona Mine is the significant damage that has resulted in the 97 hoist chambers, which are of strategic importance. As a result of the numerous incidents of damage and injuries referred to above, a complete re-assessment of the shaft pillar extraction process was done.
Re-assessment
The re-assessment process covered the following aspects:
 Analysis of the seismic response with respect to the production input
Numerical modelling with the dynamic response integrated into the model, and comparison of this with the initial modelling results.
These assessments and the outcomes obtained from each of the assessments are now discussed.
Seismic response analysis
Initial assessment
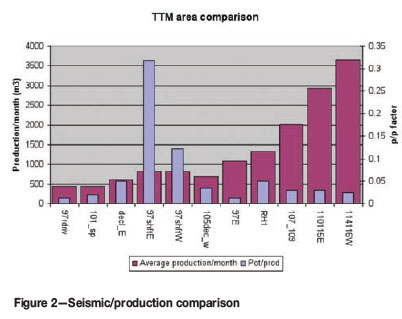
An assessment was conducted where the seismic response per square metre mined (P) was compared between different mining areas at TauTona mine. For this purpose, the seismic potency per unit area mined for each of the areas was evaluated. The seismic potency (Mendecki et al., 2004) was calculated as follows:

Where M = seismic moment G = rigidity
The results obtained in this assessment are shown in Figure 2, where it can be seen that both the 97W and 97E areas of the shaft pillar have a significantly higher response than any of the other areas that were used in the comparison. What also needs to be noted here is that the RH1 area appears to have a similar response to two other areas at TauTona Mine, namely the 105 decline east area and the 105 decline west area. These areas were also associated with an elevated seismic response. This was due, in the case of the decline west, to the fact that mining was taking place adjacent to seismically active structures in what could be considered to be a remnant area. In the case of the decline east, the longwall was negotiating a seismically active fault and dyke. Of additional importance to note here is the fact that the RH1 area has a relative small span, and as this span increases the seismic response will increase.
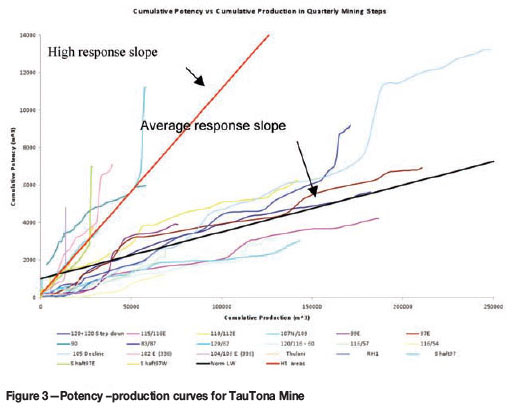
Cumulative potency vs. cumulative production
The second part of the seismic assessment consisted of a novel approach, in which potency was compared directly to production. The main objectives of this task were:
To quantify the seismic potency results obtained above
To develop a tool that could be used for medium-term prediction.
Figure 3 shows the results obtained for all the mining areas at TauTona Mine, and from this information some deductions can be made. To begin with, two different response slopes can be discerned, namely a longwall average response slope and a high seismic response slope. This can be confirmed by quick perusal of the areas where a high seismic response was experienced, these areas being 90E longwall (mined between two seismically active structures), 102E and 104E (section 336 high-stress - remnant area), and the 97E and 97W in the shaft pillar. Secondly, when considering a slope increase in an average longwall curve in combination with the position of that longwall at that point in time, it can be deduced in most cases that this increase was associated with the negotiation of seismically active geological structures. Thirdly, from Figure 4, the following can be deduced:
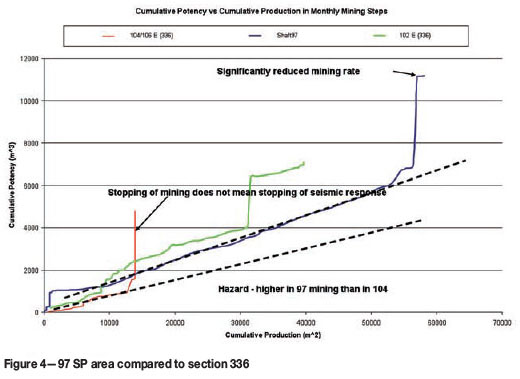
Stopping of mining does not imply that the seismic activity stops immediately
On the 97 shaft pillar curve it appears that the slope reduction has been induced by a significantly lower mining rate
The seismic hazard for the 97 area is similar to the 102E (336) longwall and higher than the 104E (336) longwall.
Mining rate assessment
This part of the seismic assessment was done in an attempt to determine the effect of mining rate on seismic activity that occurs as a result of mining operations. The initial part of this assessment was to compare cumulative production to cumulative seismic displacement, and this is shown in Figure 5.
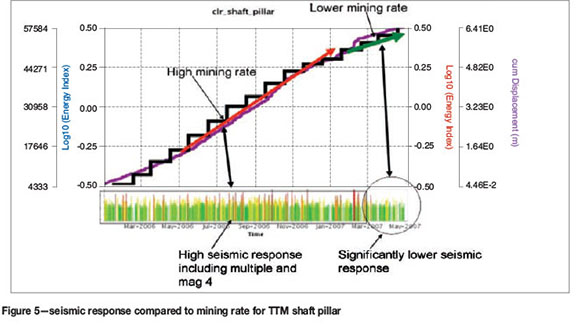
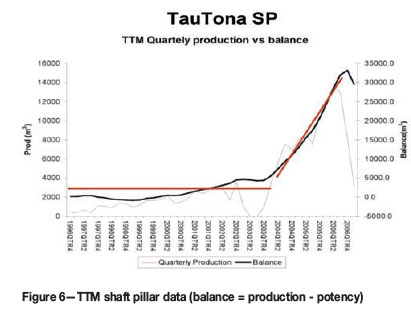
Here it can be seen that where the production curve is steeper (higher mining rate) the seismic response is significantly higher in terms of the number and magnitude of events that occurred. When considering this with the data shown in Figure 6, it appears that when the production rate in the shaft pillar exceeds 3500-4000 m2 per quarter, the seismic response in the shaft pillar does not just increase, but there appears to be a lock-up with respect to the seismic response. Similarly, in an industry review of shaft pillars it was found that mining rate within shaft pillar boundaries should be limited to 2000 m2/month (Dukes, 2007). It has also been shown that the short-term hazard, associated with spatially disordered and non-adjacent blasting of mining panels, was lower than where panels were blasted adjacent to each other, irrespective of the rate of mining. Non-adjacent blasting at a lower mining rate generated even more favourable conditions (Mendecki, 2005).
This seismic analysis has shown that the seismic response of specifically the 97 area in the shaft pillar is notably higher than in any of the normal longwalls at TauTona Mine. Also, the seismic response of the 97 area is similar to, if not higher than, the old 336 area. It can also be concluded that a high production rate (volume of extraction with respect to time), specifically in shaft pillars, has either an exponential effect on the seismic response within the shaft pillar boundaries or seismic lockup may occur. Futhermore, non-adjacent blasting of panels will have a more favourable effect on the seismic response.
Numerical modelling and seismic integration in the numerical model
Standard linear elastic numerical modelling was originally used to assess mining in the shaft pillar. Some results obtained with this modelling will be discussed and compared to the seismic data discussed above. Leading on from this assessment and from several incidents in the shaft pillar that were identified as anomalous compared to the rest of the mine, numerical modelling with seismic integration on the geological structures was completed. The results obtained from this are also discussed. Finally, as part of an infrastructure assessment, 3D seismic integration in the model was conducted, and these results are also discussed.
Linear elastic modelling
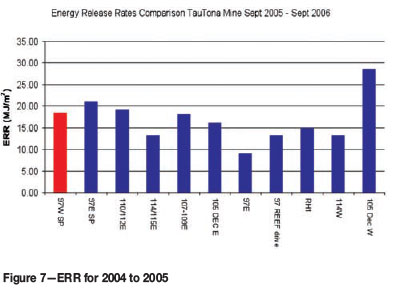
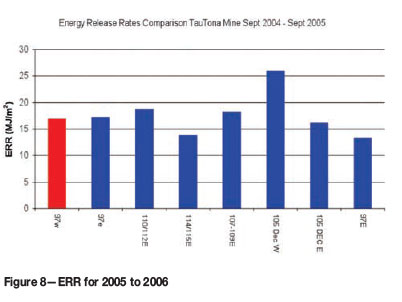
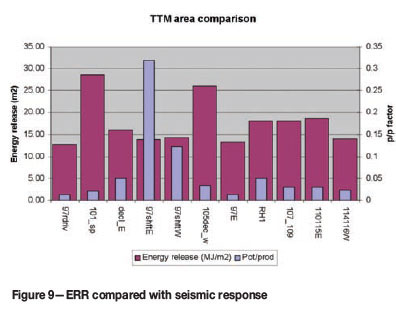
In this exercise linear elastic modelling (Map3D) was used to assess different areas at TauTona Mine, and results obtained were compared to modelling results obtained in the shaft pillar. The variable obtained from the model and used in this assessment was energy release rate or ERR (Map3d manual), and the results are shown in Figure 7 (September 2004 to September 2005) and Figure 8 (September 2005 to September 2006). In both these figures it can be seen that the ERRs for the 97 shaft pillar areas are similar to, and not significantly higher than, any of the other areas at TauTona Mine.
However when the seismic response of the areas is compared it can be seen that the response of the 97 shaft pillar areas is markedly higher than that of the other areas, as shown in Figure 9. In an attempt to understand the difference in the seismic response, the numerical assessment was expanded to include seismic integration. This was accomplished using Map3Di, which has the ability to integrate seismic data.
Integration of seismicity on geological structures
Map3Di is an advance on the standard MAP3D program that permits superposition of external field loading effects onto a standard Map3D model. Slip or dilation on a fault plane is applied by subdividing the known extent of the fault into small planar zones and then specifying the slip or dilation components in each zone. Effectively, the deformations indicated by seismicity are superimposed onto the Map3D mine model, thereby redistributing the stresses to accommodate the deformations (Mendecki et al., 2001).
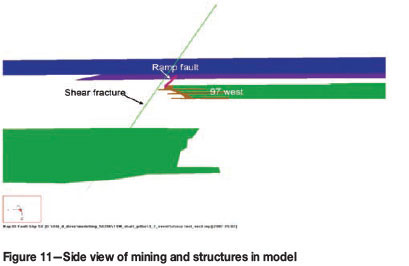
Using this methodology, two incidences of major seismic events were back-analysed. Firstly, the occurrence of an event in the 97W area was analysed. This event of local magnitude (mL) 2.5 resulted in major failure and loss of life in 97W3 panel. Underground investigations revealed that major reverse slip had occurred on a ramp fault structure in the face area of the panel. Following the event, a shear fracture with approximately 12 cm of displacement was observed in a panel mining north (up-dip), ahead of the breast panel. The shear structure was striking parallel to the previous breast face (see Figure 10). What was not well understood was the reverse slip along the ramp fault structure and the magnitude of the event that occurred. In order to gain understanding of this a numerical model of the shaft pillar was built, and both the shear structure and the ramp fault structure were included in this model as displacement discontinuities (see Figures 11 and 12). The model was then run with three mining steps up to the time of the event.
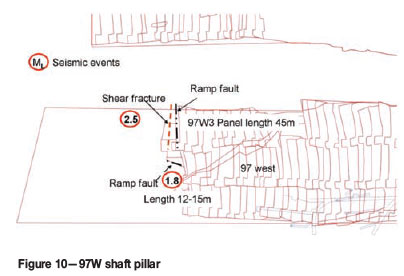
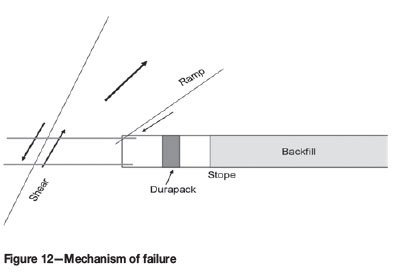
At this point, the mL 2.5 seismic event was integrated into the model along the shear structure at approximately the position that it occurred. The results from this model showed that normal slip occurred along the shear structure. This resulted in an upward sense of movement of the hangingwall above the ramp structure, which in turn induced reverse slip along this structure. This effectively dislodged the footwall of the structure into the stope. An assessment of the ESS along the structure also revealed that a mL 2.5 event could occur along this structure with a strike length of 45 m. Furthermore, a second event associated with a ramp structure occurred in the position as shown in Figure 10. This event was of mL 1.8 with a corresponding face length of 12 m to 15 m. What is of interest to note here is that this data conforms to a previous postulation that was made concerning the panel face length having a direct bearing on the magnitude of the event that may occur (van Aswegen, 2006).
The second incident consisted of a multitude of events which included a mL 4 seismic event that was initiated on the 97W side of the shaft pillar. The sequence of these events that occurred is shown in Figure 13. The 97E panels intersected an unknown 1.5 m fault that was striking almost parallel to the faces. This resulted in the mining strategy being changed from breast mining to northside mining being used to negotiate the fault. During this northside mining the first seismic event (mL 3) occurred, with the second (mL 2.6) occurring approximately a minute later and the third event (mL 4) a day later. What was not fully understood here was firstly why the first event occurred even though the strategy had been changed, and secondly why the third event still occurred when intuitively it was thought that the first and second events should have de-stressed the fault.
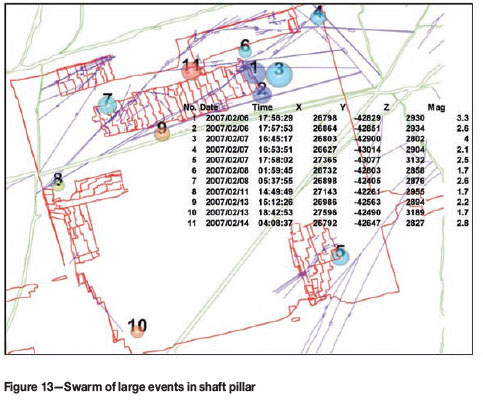
The same methodology as described in the first paragraph of this section was used to back-analyse this situation. The fault was built with displacement discontinuity as shown in Figure 14. The modelled mining consisted of the 97E panels being mined breast-onto the fault. The mining was then turned north with a northside panel. It was found that as the breast mining approached the fault, positive ESS lobes were formed close to the reef horizon. Using Ryder's method (Ryder, 1988) of calculating expected event magnitudes from ESS, it was found that that there was sufficient potential for both these events to occur. This assessment also showed that the minimal mining being done in the northside panel was sufficient to cause an increase in the existing ESS lobe.

In addition, a further ESS lobe was found to exist on the geological structure fairly high in the hangingwall of the stope, and this lobe definitely had potential to result in the mL 4 event that occurred. In the model it can be seen that this positive ESS lobe owes its existence to the initial mining that took place when the pillar was formed, rather than mining activity at the time of the event. In the physical rockmass, positive ESS lobes do not exist because movement associated with this ESS will take place either slowly (creep) or quickly to relieve the ESS build-up. However, it is also known that asperities may exist on the geological features, which could hang up this movement along the feature. In this instance, small increases in either the ESS or the lobe size can be sufficient to 'break' the asperity, resulting in a large event occurring. Increases as described above were observed in the positive ESS lobes already existing on the geological feature in the model as a result of the northside mining. This process is probably why the first seismic event occurred when it did. It does not, however, explain the occurrence of the second and third events. Further work was required to explain this, and as such the three seismic events that occurred were integrated into the model in a step-wise fashion. In this implementation it was found that the first event created positive increases in both the ESS and the lobes at the positions where the second and third events occurred. From this it can be concluded that the static stress changes associated with first event was sufficient to trigger the second and third events.
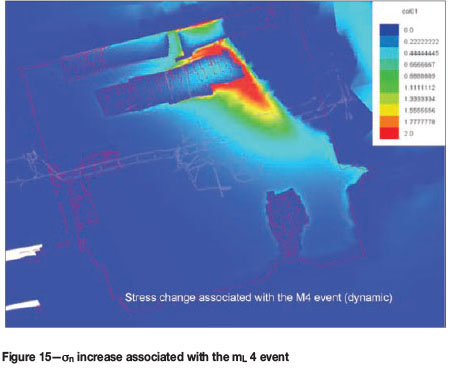
These results prompted further work to ascertain the extent to which the mL 4 event influenced the occurrence of the remaining seismic events in the so-called swarm. To this end, the solid remaining in the reef plane was built into the model using displacement discontinuities. This model was then run and the seismic data concerning the mL 4 event was integrated into this model along the geological feature. The results showed that significant static changes in an (an is defined as the stress existing in the direction normal to the reef plane) occurred in the areas where the other seismic events occurred (see Figure 15). Changes to an imply changes to the principal field stresses, which in turn implies changes to the ESS acting on the structures. ESS is equivalent to Coulomb failure stress (CFS), which is widely used in crustal seismology (Hofmann et al.,), where it has been found that a static Coulomb stress change in excess of 1 bar (0.1 MPa) caused by a large seismic event is sufficient to trigger aftershocks (Harris, 1998). When taking the above into consideration it can be interpreted that the static stress changes associated with the mL 4 event are a major contributing factor to the occurrence of the remaining events in the 'swarm'. Effectively, what can be considered to be minor stress changes has resulted in major seismic activity. What can also be concluded from the above work, specifically with respect to the fault in the 97E area, is that the historical latent seismic potential of structures in the shaft pillar was significantly under-estimated during the initial design phase.
What now needs to be considered is whether the increase in static stress as a result of seismic activity is a major contributing factor to the higher-than-expected deformation experienced in the 97 hoist chambers. In order to do this, the seismic data obtained from the shaft pillar during the period that the pillar was being mined was integrated into the numerical model. This methodology is described in the following section.
Integration of the seismic information in 3D space in the numerical model
The higher-than-expected deformation in the 97 hoist infrastructure area could be attributed to one or both of the following:
Effects of mining is larger than expected
The design criterion of 5 MPa was overstated.
Consideration of the first point revealed that either the initial modelling was inaccurate or, due to seismic deformation, higher stress concentrations are occurring in the intact areas. Extensive re-modelling with a different linear elastic model (Map3D) has not revealed any inaccuracies or anomalies concerning the initial modelling, which was done with MinsimW. At the time that the initial modelling was done, the methodology for integrating seismic data with numerical modelling was in its infancy and not freely available. Some integration work was done at the time by ISSI (Integrated Seismic Systems International), where historical seismic data that occurred along the geological structures was incorporated. This exercise revealed that the stability of the major structures was dependent on the existing k-ratio (k-ratio is the ratio between the vertical and the horizontal stress). In addition, a ranking of the hazard potential of the geological structures was conducted. No work was done with respect to the possibility of significant static stress increase occurring as a result of seismic activity, and this possibility was not taken into account at the time. It is now suspected that seismic-induced static stress increase may be a cause for the higher-than-expected level of deformation in the 97 hoist chambers, and as such the 3D seismic integration described below was carried out.
The 5 MPa stress criterion was a relatively subjective design value based on some industry experience. It is not known with any certainty if it is tolerable in this situation where the hoist chambers with sensitive machinery already lie in a stress field exceeding 97 MPa. As a preliminary attempt to quantify this, an inelastic 2D assessment was also done, and this is discussed in the following section.
Methodology
The method followed in conducting the 3D integration is firstly described, and then the results obtained from this integration are discussed.
The rock mass in the shaft pillar area was divided into into small 3D zonesvoxels (cubic boxes)of particular dimension. Seismic deformation of the rock mass is specified in terms of strain per voxel. The apparent volume of an event, together with a source model assumption, gives the physical deformation at a voxel centre point. This is cumulated for all events touching that voxel, and is transformed into a strain estimate by dividing by the voxel side length. This is calculated for the relevant seismicity, for all voxels in the integration volume, and then serves as input for Map3Di. The model then updates the overall stress state to accommodate the contribution of the integrated field loading (Hofmann, 2003).
The numerical model that was used consisted of the shaft pillar with no mining being conducted within the shaft pillar boundaries as a base case. In the second step, all the mining that had to date been completed was incorporated. In the third step. the seismic data for events affecting the shaft pillar during this mining operation were integrated into the model. The results from step 1 were then subtracted from step 2 to obtain the static stress change induced by the mining. Similarly, this was done for steps 2 and 3 to obtain the dynamic stress change associated with the dynamic loading.
Results
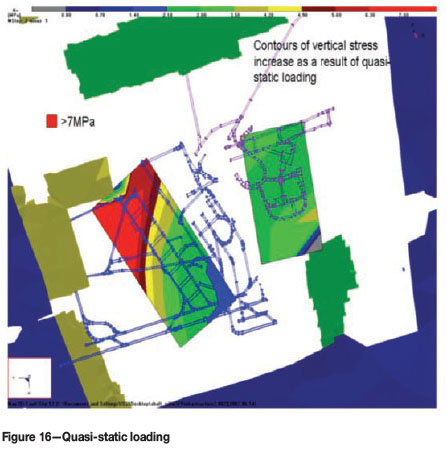
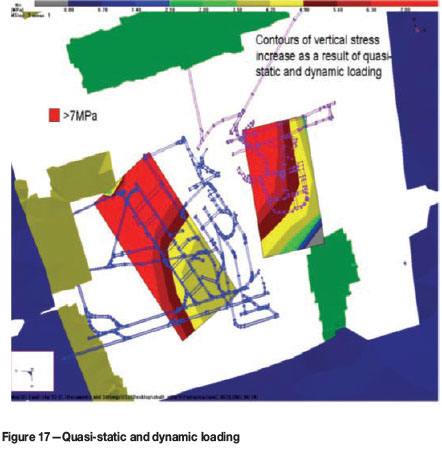
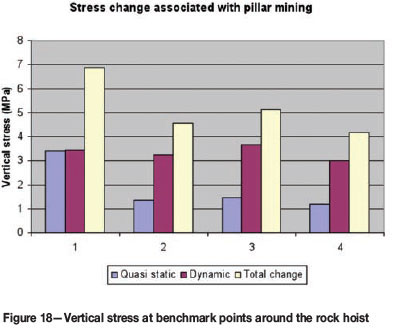
The results obtained for this modelling are illustrated in Figures 16 and 17 and quantified in the graph in Figure 18. In Figure 16 it can be seen that the criteria of 5 MPa are not exceeded in the 97 hoist excavations, but they are exceeded to some extent in the 100 refrigeration plant area. This is due to the additional mining that was done in the 97 reef drive that was not included in the initial modelling exercise. Conversely, in Figure 17 it can be seen that as a result of the dynamic loading, the 5 MPa criterion has been exceeded in both areas. Figure 18 shows results that were obtained from benchmark points included in the model adjacent to some of the chambers in the 97 hoist area. Here it can also be seen that when the dynamic loading is included the 5 MPa criterion is exceeded at certain points. From this it can be concluded that, firstly, the dynamic loading within the shaft pillar area is one of the drivers of the higher-than-expected rate of deformation experienced in the 97 hoist chambers. Secondly, although the 100 refrigeration plant has been subjected to a similar stress increase there does not appear any evidence of higher-than-expected deformation.
In order to quantify the displacement that occurred in the sidewalls and the hangingwall of the 97 rock winders, FLAC2D inelastic modelling was done, and this is discussed in the following section.
2-Dimensional inelastic modelling of the 97 rock hoist chamber
Model description
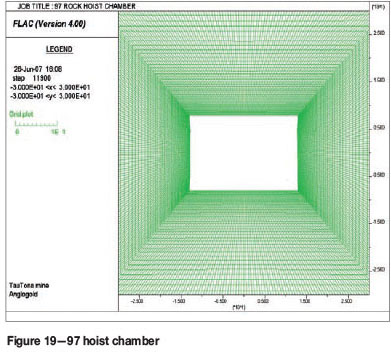
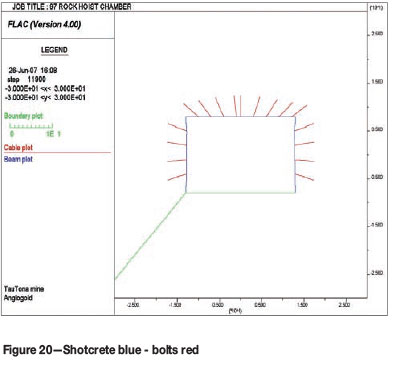
A 2D section of the rock hoist chamber was built using Flac2D, and this section is shown in Figure 19. Figure 20 shows the shotcrete and anchors that have been included in this model to simulate the effect of the support that is currently installed in the chamber. Stress inputs for the model were obtained from the Map3D modelling described above. The model was run in the following stages:
Stage 1: At time of excavation
Stage 2: Shaft pillar formed
Stage 3: Static stress increase due to mining within the pillar
Stage 4: Static stress increase due to dynamic loading
Stage 5: Static stress due to planned mining
Stage 6: Dynamic stress increase due to expected dynamic loading.
Results obtained from the model
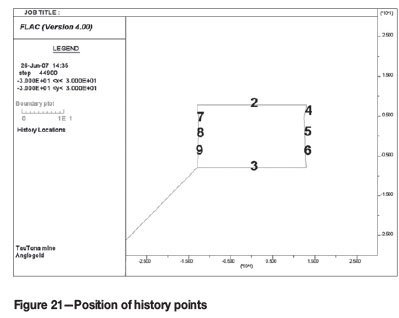
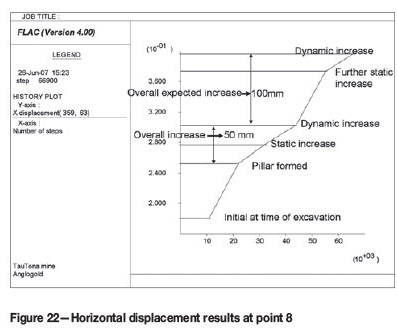
History points to monitor the deformation occurring in the model are shown in Figure 21. For the sake of brevity, only the results obtained at position 8 are discussed in this report. This point was chosen because it is in the centre of one of the chamber sidewalls where the most lateral displacement would occur. The results for this point are shown in Figure 22. The static increase that occurred as a result of the mining in the pillar is approximately 20 mm. Here it must be taken into account that the opposite sidewall has similar deformation, and therefore the total deformation acting on the concrete foundations and the floor of the hoist rooms was 50 mm due to the static stress increase associated with the mining. However, when considering the total static stress (mining-related and dynamic loading) it can be seen that this is approximately 120 mm. This is the current point in time at which the high rate of deformation is being experienced in the rock hoist chamber. What is of major concern here is the fact that the expected deformation that will occur as a result of the static stress increase attributable to both the mining and the predicted dynamic loading is at least 200 mm, in addition to the 100 mm discussed above. When considering the above and the higher-than-expected deformation that has occurred, it must be concluded that the planned additional mining will definitely result in at least double the deformation that has already occurred, and this may result in catastrophic failure of the foundations of the hoist in this chamber.
To this effect, numerical modelling was conducted to ascertain which planned areas within the shaft pillar could still be mined without adversely affecting the 97 hoist chambers and the 100 refrigeration plant. This work is discussed in the following sections.
Evaluation of possible further extraction within the shaft pillar
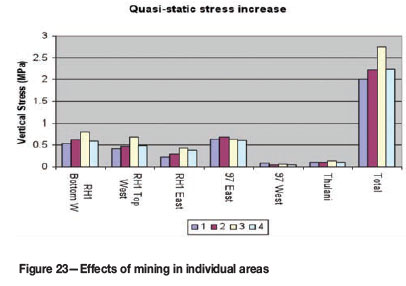
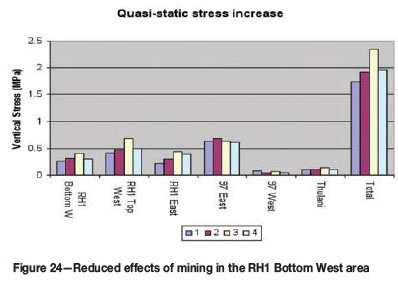
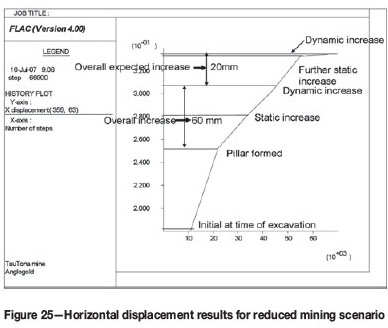
The first part of this work was done with the Map3D/3Di programs, where the effects of the different mining areas on the 97 rock hoist chamber were compared. The results for this exercise are shown in Figure 23. Here it can be seen that only the 97 West and the Thulani areas have a minimal effect on the 97 rock winder area. This, however, removes a significant amount of the planned mining from the shaft pillar. Considering this, further work was done to determine what portion of the bottom west of the RH1 could be mined in addition to the Thulani and the 97 West mining. This area was assessed rather than the other areas since the 97 east area has a high seismic potential and the RH1 top east and west are in close proximity to the seismically active Wuddles Dyke. By reducing the amount of mining in the bottom west of the RH1 area, a reduction in the potential stress increase in the 97 hoist area is accomplished. Secondly, this reduction of mining reduces the effect on the Wuddles Dyke. The total stress increase in the 97 hoist area is predicted to be 0.5 MPa for the static increase and 0.5 MPa for the dynamic increase (see Figure 24). These results were then input into the Flac2D model, and the results obtained are shown in Figure 25. Effectively, this reduction in the field stress increase in the vicinity of the rock hoist chamber results in a significantly lower increase in the expected deformation from 160 mm across the excavation to 40 mm, which can be catered for by the engineering design and application of phasing measures to maintain and protect hoisting against slow deformations.
A similar modelling exercise was done for the 100 refrigeration plant. The expected vertical stress increase is approximately 7 MPa as a result of this mining. This will result in additional deformation of 30 mm to 50 mm in the sidewall of the excavations, or a maximum of 100 mm across the refrigeration plant excavations. In this scenario, as a result of the slots cut in the footwall of the excavation it is not expected that this deformation will detrimentally affect the refrigeration plant equipment (van Antwerpen, 2007).
Conclusions
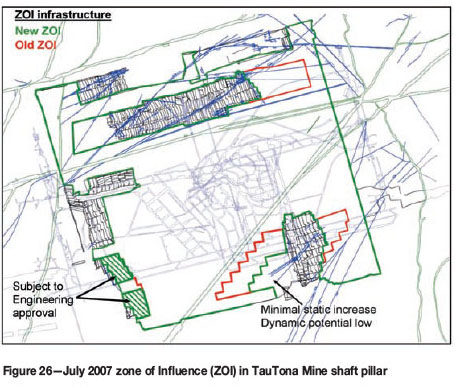
This seismic analysis has shown that the seismic response in the shaft pillar is notably higher than in any of the normal longwalls at TauTona Mine. Also, the seismic behaviour of the 97 area is similar to, if not higher than, that of the old 336 area. When taking this into consideration, together with the fact that a similarly high-stressed area was successfully extracted, it must be borne in mind that the shaft pillar includes sensitive infrastructure, which was not the case with the similarly high-stressed area. The initial criterion that was used to establish the amount of mining that could be done in the shaft pillar area without causing significant damage to the infrastructure may be optimistic (Leach, 2007). This, in conjunction with the deformation that occurred in the 97 hoist chambers and the additional static stress increase associated with the dynamic loading, requires that any additional mining in the shaft pillar be restrained. Consequently, the overall planned mining in the Carbon Leader shaft pillar at TauTona Mine has been completely reassessed and reduced to the areas shown in Figure 26.
Reducing the amount of mining in the bottom west of the RH1 area firstly accomplishes a reduction in the potential stress increase in the 97 hoist area. Secondly, the effect of this mining on the Wuddles Dyke is significantly less than would otherwise have been the case. The numerical modelling also shows that mining, although significantly reduced, will still have an effect on both the 97 hoist chambers and the 100 level refrigeration plant. The numerical modelling has indicated that a further deformation of 40 mm can be expected across the hoist chambers. With respect to the 100 level refrigeration plant, the deformation across the chambers is expected not to be in excess of 100 mm. According to the Engineering Manager this is not expected to affect the refrigeration plant infrastructure (van Antwerpen, 2007).
It is also concluded that a high production rate specifically in shaft pillars has either an exponential effect on the seismic response within the shaft pillar boundaries or seismic lockup may occur. Futhermore, non-contiguous blasting, i.e. not blasting of adjacent panels at the same time, will have a more favourable effect on the seismic response. From the evidence provided in this paper it is concluded that the production rate within the shaft pillar boundaries should be maintained at less than 2200 m2/month.
The cumulative potency vs. cumulative production criterion shows promise as a medium-term monitoring parameter for seismic analysis when mining is approaching geological features and to quantify the required production rate within the shaft pillar.
When considering the evidence related to the panel length, it must be concluded that panel lengths must be restricted to a maximum length of 25 m in areas with relatively higher seismic activity, such as the TauTona shaft pillar.
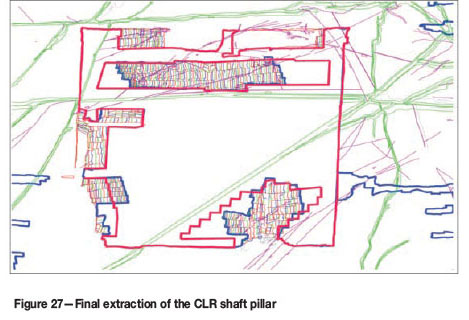
Final outcome
All mining in the CLR shaft pillar has now been stopped. The red mining limits shown in Figure 27 were the previous updated design limits, and the blue lines indicate the new limits. Most mining had to be stopped short of the design, as can be seen in Figure 27. The seismic response in the west mining panels continued to escalate and as a result of this all west mining panels were stopped. In the Thulani area, mining in the bottom portion was stopped due to both seismic and mining restraints, whereas the upper portion was allowed to continue over the stopping line due to the low seismic response and minimal effect on the 100 level refrigeration plant. Further work is required to quantify the anomalous seismic response, specifically of the west mining panels, to gain a better understanding of design rules for possible further extraction once the shaft infrastructure at TauTona Mine is abandoned.
References
Harris, R.A. 1998. Introduction to special section: Stress triggers, stress shadows, and implications for seismic hazard. Journal of Geophysical Research, vol. 103 (B10), no. 24. pp. 347-358. [ Links ]
Hoffmann, G. and Murphy, S. Coloumb stress triggering in the underground environment. Proceeding of the 1st Canada-US Rock Mechanics Symposium, Vancouver, Canada, 27-31 May 2007. [ Links ]
Mendecki, A. Persistence of seismic rock mass response to mining. Proceedings of the 6th International Symposium on Rockburst and Seismicity in Mines, Perth, Australia, March 2005. [ Links ]
Dukes, G. Shaft pillar extraction survey. AngloGold Ashanti. Unpublished internal report, June 2007. [ Links ]
Mendecki, A. Optimisation of the routine seismic hazard rating system for ANG mines. AngloGold Ashanti. Unpublished report, 2004. [ Links ]
Ryder, J.A. 1988. Excess shear stress in the assessment of geologically hazardous situations. Journal of the South African Institute of Mining and Metallurgy, vol. 88, no. 1. pp. 27-39. [ Links ]
Van Antwerpen, J. 2007. TauTona Gold Mine. Personal communication, June 2007. [ Links ]
Leach, T. 2007. Consultancy report: SummaryRock engineering discussions concerning mining in the TauTona shaft pillar. 25 May 2007. [ Links ]
© The Southern African Institute of Mining and Metallurgy, 2012.ISSN2225-6253. This paper was first presented at the, Southern Hemisphere International Rock Mechanics Symposium (SHIRMS) 2012, 15-17 May 2012, Sun City, South Africa.

