


Servicios Personalizados
Articulo
 Inglés (pdf)
 Articulo en XML
 Referencias del artículo
Indicadores

Links relacionados
-
 Citado por Google
 -
 Similares en Google
Compartir

 Permalink
Journal of the Southern African Institute of Mining and Metallurgy
versión On-line ISSN 2411-9717
versión impresa ISSN 2225-6253
J. S. Afr. Inst. Min. Metall. vol.112 no.8 Johannesburg ene. 2012
TRANSACTION PAPER
Numerical simulation of shear fracture evolution in laboratory-scale samples
D.P. Roberts
AngloGold Ashanti, South Africa
SYNOPSIS
This investigation aimed to simulate the experiments performed by Nic Gay (Gay, N.C. 1976. Fracture growth around openings in large blocks of rock subjected to uniaxial and biaxial compression. International Journal of Rock Mechanics and Minining Sciences and Geomechical Abstracts, vol. 13. pp. 231-243) on fracture growth around openings in blocks of rock subjected to uniaxial and biaxial compression, using the Elfen discrete element code. The results of the physical experiments indicated a number of trends that were successfully replicated in the numerical simulations, including crushing ahead of the face, the formation of a sub-vertical tensile fracture at centre-span, the formation of groups of fractures originating from the crushed face zone, the formation of large corner-to-corner fractures which precede sample failure, and linking of slot corner and sample corner fractures leading to sample failure.
In addition, other features were apparent that were not reported by Gay. It is believed that these took the form of conjugate shear fractures (as reported by Gay in a previous paper) and other features that may have been altered or inhibited by the presence of pre-existing structure in the physical samples. It was found that the samples, though nominally made up of the same rock type, must have had significantly differing properties. The presence of preexisting structures may have contributed to this discrepancy. Strain measurements from the physical experiments were reasonably well matched, except where the gauge lay directly in the path of advancing fractures.
Keywords: shear fracture, modelling, Mohr-Coulomb criterion.
Introduction
Nic Gay conducted a series of tests on rock blocks subjected to uniaxial and biaxial loading (Gay, 1976). Each block contained a slot, which in some tests was extended while under load to simulate mining. The resulting fracture patterns around these slots were examined in detail and trends were suggested for the influence of stress ratio, material type, and pre-existing planes of weakness.
The aim of this exercise is to replicate the results obtained by Gay using numerical modelling. Gay reported the appearance of shear fractures that are analogous to those that occur at the edges of deep-level gold mining excavations. The formation of these fractures is often associated with damaging seismicity (Lenhardt and Hagan, 1990) Ultimately, we wish to predict the occurrence and severity of such events using non-linear numerical modelling. This work aims to demonstrate that such modelling is capable of replicating the fracturing obtained in the controlled setting provided by Gay's experiments.
Results are compared in terms of the features and trends observed by Gay. Strain gauges placed around the slots also provide data for comparison.
Gay's experiments
Experimental setup
A series of tests were conducted on specimens of sandstone and quartzite. These specimens were machined to dimensions of 100 mm χ 100 mm x 75 mm. Each contained a slot machined all the way through the sample (parallel to the short axis). These slots were 2-5 mm wide and of various lengths, with a reported average length of 25 mm.
In some of the samples, designated 'mining tests', the size of the slot was extended by filing away the faces incrementally. In these tests, the initial opening was either a 5 mm diameter hole or a 5 mm x 10 mm slot. These samples were tested under constant load.
The 'static tests' were performed on samples with slots of approximately the same size. The samples were loaded in a steel frame. An initial confinement was supplied by tightening a series of cap screws against steel plates adjacent to the sample. The full lateral load was applied by pressurizing flat-jacks placed between the frame and the plates. Vertical loads were applied by the piston of a compressive testing machine.
Most of the tests were performed on sandstone samples. Three samples of quartzite were tested at different confining stresses:
 C13 Unconfined (static test)
C17 33 MPa confinement (static test)
C18 27 MPa confinement (mining test).
Gay's paper mentions the presence of bedding planes and pyrite bands within the quartzite samples, but he describes them only in terms of their influence on results.
Experimental results
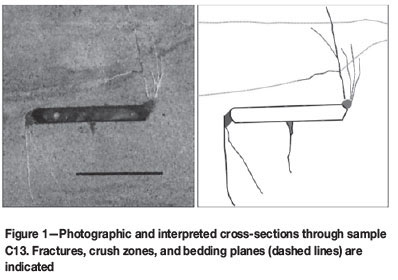
A typical cross-section through a static-tested unconfined quartzite sample (C13) is presented in Figure 1. Crushing is observed adjacent to both 'faces' of the slot. A roughly vertical fracture extends downwards from the centre of the slot. Families of fractures extend from the slot corners sub-vertically over the solid, some of which curve back over the slot. The bedding plane above the slot clearly affects the fracture pattern, providing a channel for the formation of a sub-horizontal fracture, and initiating another crack which curves over the slot, possibly terminating on another bedding plane above.
Similar features were observed in the result from sample C17 (Figure 2). In this test the bedding planes had an even more profound influence on the fracturing pattern. A major fracture extending from the right corner over the slot runs adjacent to a bedding plane, interrupting and altering the fracture 'family' originating in the left corner.
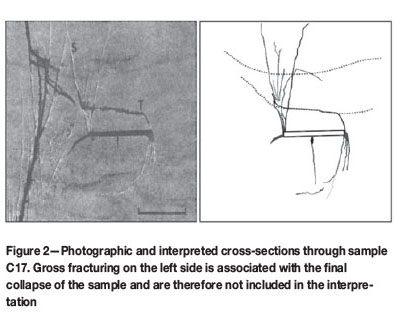
Face crushing and the central tensile fracture are observed. Curving of the fractures over the slot is evident, but may also be associated with unidentified bedding planes in the bottom portion of the sample.
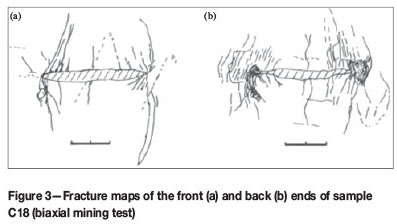
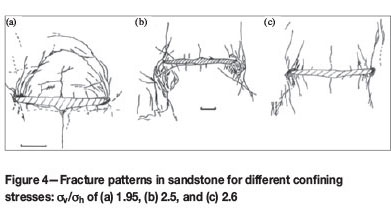
Fracture maps for the biaxial mining test (C18) are presented in Figure 3. Gay states that the orientation of fracturing in the quartzite samples is 'controlled mainly by the bedding planes'. Comparison of the results was therefore difficult. The sandstone samples were not as strongly affected by pre-existing features and could therefore be interpreted more readily. Figure 4 shows the influence of horizontal stress on the fracture pattern for various mining models, curving over the slot at high confinement (a) and, at low confinement, forming fractures which ultimately extend all the way to the model corners (c).
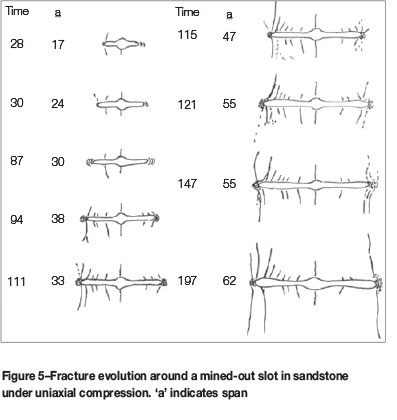
The fracture evolution for a sandstone sample mined out from a central drill hole is shown in Figure 5. This sample was slightly smaller than mentioned above (75 mm χ 75 mm χ 75 mm) and was loaded in uniaxial compression. The vertical load was 400 kN (71.1 MPa). The major features observed were spalling of the faces and sub-vertical fracturing, which appears to dip over the slot at first, and then over the solid at much larger spans.
Common features of the fracture patterns
Figure 6 shows the locations and orientations of the fractures expected in the numerical results. These features can be summarized as follows:
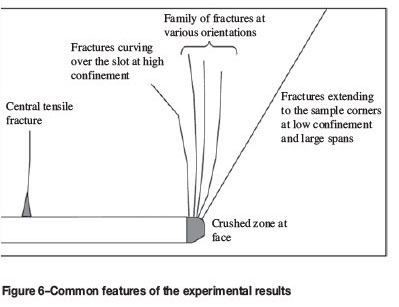
Central sub-vertical crack
- This feature is a tensile fracture which tends to occur either above or below the slot. In the mining models, the crack appears above and below the slot.
Face crushing
- Spalling occurs in the face area, resulting in a zone of crushed material in this region.
The sub-vertical family
- Groups of fractures oriented sub-parallel to the major applied stress appear around the slot corner or crushed face zone. These cracks tend to curve over the slot at high confinement, and remain vertical or dip over the solid at low confinement. In the mining models they tended to appear singly at low spans and then appear in families at larger spans.
Domical and sub-horizontal fractures
- At high confinements, fracture zones from the slot corners coalesce, forming sub-horizontal or domical fracture zones over or under the slot.
Corner-to-corner shear fractures
- At low or no confinement and large spans, shear fractures extend from the slot corners to the corners of the sample, effectively failing the sample and ending the test.
Previous simulation of Gay's experiments and similar modelling
Sellers (1994) and Sellers and Scheele (1996) simulated the appearance of tensile and shear damage zones in Gay's experiments using an anisotropic damage model within the ABAQUS finite element code. Modelled principal strains were also well-matched with those measured in the experiments. Computer limitations at the time necessitated the analysis of coarse, simple models by today's standards, and it was not possible to model the strain softening processes associated with macro-fracturing. Nevertheless it was demonstrated that the main features of Gay's experiments could be replicated using numerical modelling techniques.
Napier and Hildyard (1992) conducted a similar exercise using the boundary element code DIGS, where displacement discontinuities (DDs) are introduced to simulate fractures. Crack growth (extension of the DDs) is executed based on the magnitude and orientation of the maximum shear stress ahead of the crack tip.
The central tensile fracture was allowed to develop initially, in conjunction with the first of a series of three shear fractures growing from the excavation corner. The innermost (closest to the centre of the model) fracture was permitted to grow first, followed by the middle fracture, then by the outermost fracture. At each stage, fracture growth progressed until various criteria were satisfied, or until they were naturally inhibited by changes in the stress field.
Their results showed the progressive development of shear fractures from the excavation corners. Fractures were oriented as observed in Gay's experiments: over the slot at high confinement, trending towards vertical as the confinement was reduced, eventually dipping entirely over the solid. The effect of bedding planes was also studied, and it was shown that the beds altered the orientation and extent of the developing fractures.
Numerical modelling
Approach
The Elfen finite/discrete element code was used to simulate these tests. Elfen uses an explicit integration scheme similar to that employed by FLAC and UDEC. Elfen is inherently dynamic, and requires that damping is used to obtain quasi-static solutions. Damage is modelled using a combined Mohr-Coulomb/rotating crack strain-softening criterion. The material yields in tension or shear, according to the MohrCoulomb criterion. When sufficient plastic strain has accumulated to exhaust the specified fracture energy, a discrete fracture is generated within the mesh. The faces of the fracture then interact via penalty-based contact laws (Klerck, 2000). Crushed material effectively becomes an assemblage of discrete bodies interacting naturally, though the resistance to further deformation offered by these bodies is determined by the response at the end of the strain-softening curve.
The introduced fractures can take any orientation, but for these models are restricted to element boundaries only. This reduces run times and improves the stability of the analysis, but forces the fracture orientation to conform to the mesh. In Napier and Hildyard (1992), the authors note that the
'process of shear growth comprises a complex sub-structure of linked fractures to form a shear zone of finite thickness' and noted that they assumed that the 'macro-zone can be modelled as a displacement discontinuity "cut" in the medium'. In this paper the shear zone is represented by a series of arbitrarily oriented inter-element fractures, though these fractures occur at a very different scale to the real 'substructure of linked fractures'. The question here, then, is whether the shear fracturing process is adequately simulated given the forcing of individual fracture orientations and the resulting scale discrepancy.
Parameters for the strain-softening model were obtained by simulating laboratory tests performed on representative materials. The 'static' and 'mining' experiments were then simulated in detail and the numerical results compared with the experimental.
Material calibration
It is important when using strain-softening material models to ensure that the element size is appropriately selected, is of constant size in the softening region, and remains constant in all models (Vermeer and de Borst, 1984; and Cundall, 1989). The controlling dimension in these models is the face length (2 mm). Previous experience with Elfen has shown that 5 to 10 elements along the controlling dimension is sufficient to capture failure processes. The mesh edge length was chosen as 0.2 mm, which gives 10 elements along the length of the face. Models contained around half a million elements and run times were of the order of 20 to 35 hours for the largest models.
A material representative of typical quartzite was created based on a series of compressive and Brazilian tests (Chen, 2008). Maraisburg quartzite was chosen as representative of quartzite as it showed the most typical and consistent behaviour. The average linear elastic properties and density are:
Young's modulus: 70 GPa
Poisson's ratio: 0.23
Density: 2700 kg/m3
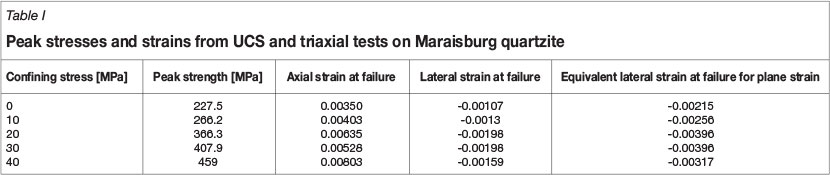
The results from the UCS and triaxial tests performed on the material are presented in Table I.
The UCS determined from a best fit to a Mohr-Coulomb approximation is 224 MPa (average: 227.5 MPa, standard deviation: 38.35 MPa) and the slope of the σ1-σ3 relationship (β0) is 6.05. The values from the best fit indicate a maximum cohesion of 45.5 MPa and a friction angle of 45.75°.
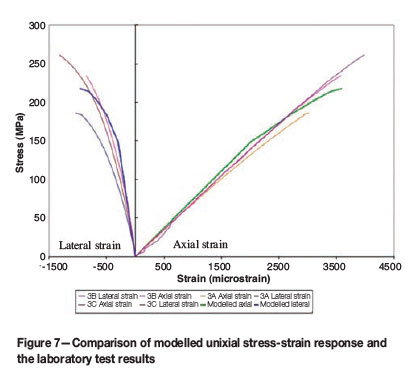
UCS, triaxialand Brazilian tests were simulated numerically. The material parameters were fine-tuned until a good match was obtained between numerical and laboratory results. The strain-softening material curves were generated using the guidance of Ryder and Jager (2002). Stress-strain curves for the uniaxial tests and simulation are compared in Figure 7.
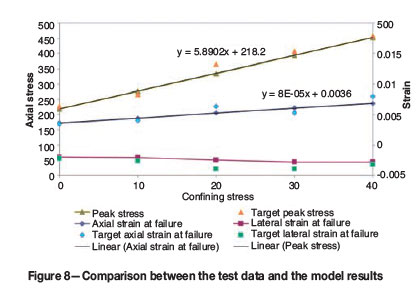
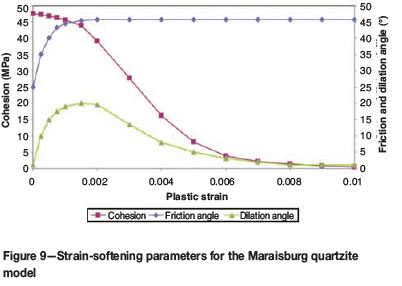
The σ1-σ3 relationships, obtained from triaxial tests and numerical simulations, are shown in Figure 8. The strain-softening material model used to obtain these results is shown in Figure 9. From the Brazilian test results, the tensile strength was determined as 14 MPa, with a fracture energy ( Gf ) of 500 J/m2.
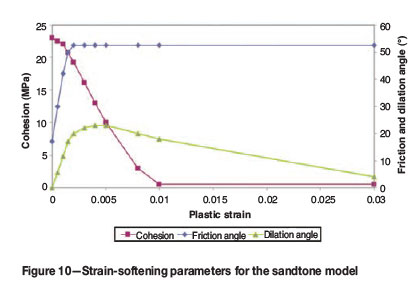
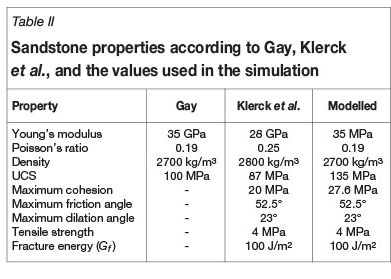
Limited information was supplied on the sandstone used in Gay's experiments. A 'speculative' sandstone material was generated with properties obtained from Klerck et al. (2004).
The sandstone modelled in that paper had similar properties to those quoted by Gay (E = 35 GPa, υ = 0.19 and UCS « 100 MPa). Klerck's properties gave a slightly lower UCS, so the cohesion was increased accordingly. Modelled sandstone properties are provided in Table II. Strain-softening curves as a function of plastic strain are presented in Figure 10.
Model description
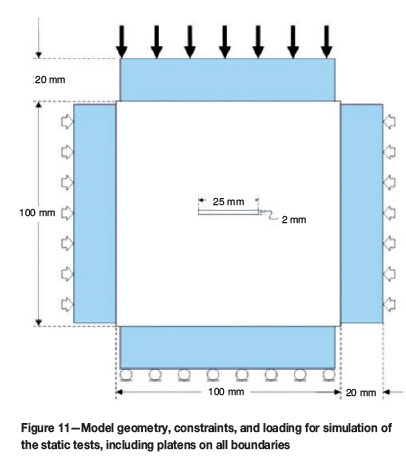
The model geometry, loading, and boundary conditions for the static tests are illustrated in Figure 11. Lateral loads were applied as pressure loads to stiff platens along the sides of the model (white arrows). Velocities were applied to the platens at the top of the model (black arrows) with the opposite side constrained in the vertical direction (circles).
Constant velocities were applied to the platen boundaries. Analyses were run at decreasing loading rates until consistent results (in terms of displacement, reaction, and energy histories; and in terms of the resulting fracture pattern and simulated strain measurements) were obtained. Staged analyses (applying load, keeping the load constant, and allowing the model to achieve steady state) were also run and it was found that the results were very similar to the models analysed with constant velocity.
Where mining steps were modelled, blocks were removed from the model over a single timestep and the model then run to steady state (determined by maximum permissible values of velocity and energy histories), as is common practice.
Gay tested quartzite samples uniaxially (C13) and with a lateral stress of 33 MPa (C17). To better investigate the effects of confinement, models with lateral loads of 10 MPa and 100 MPa were also analysed.
Gay conducted 'mining' experiments on one quartzite specimen (C18), and on a number of sandstone models. In addition to C18, one of the better-documented sandstone results is also simulated in this work (C9 - Figure 5).
Experiment C18 was performed on a quartzite sample with a pre-cut slot of 25 mm χ 10 mm. The slot was extended simultaneously at both faces, parallel to its long axis. The lateral stress (parallel to the direction of mining) was 27 MPa and the axial stress was 5 times greater (135 MPa). The rate of mining imposed by Gay was variable, and self-mining was reported.
Sample C9 was slightly smaller than the others (75 mm χ 75 mm). The original excavation was a drill-hole of 5 mm diameter. The width of the slot was measured from Gay's Figure 7, and is estimated at 2 mm. Mining was simulated in 1 mm increments. The sample was tested uniaxially with an imposed axial load of 400 kN (71.1 MPa).
Simulation results
Confinement tests
Simple slot models were analysed with varying levels of lateral confinement. The axial load was linearly increased in each case. Models were also analysed with no lateral confinement and with lateral displacement constraints along the boundaries (confined). The resulting fracture patterns are shown in Figure 12. These pictures were taken at different stages of loading.
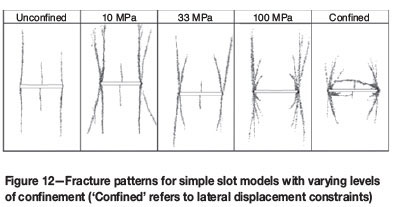
These results show a trend towards an increased number of distinct fractures at higher confinement, and a tendency for the cracks to curve over the slot. In the 'confined' case this even leads to the formation of sub-horizontal (subparallel to the slot) features. The length of the central tensile fracture is reduced with increased confinement, except for the confined case where the central fracture appears to be associated with the sub-horizontal features.
Test C13Slot in quartzite subjected to increasing axial load
Test C13 was simulated uniaxially with platens as described above. Results for the analysis with platens are presented in Figure 13.
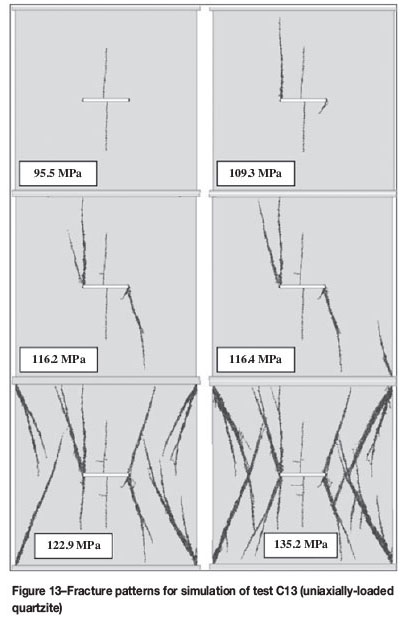
Certain features of the laboratory test are captured in this result:
Appearance of a central tensile fracture
Face crushing
Fractures at various orientations at the slot corners
Large shear fractures extending from the sample corners at high load.
Other notable features:
Sub-horizontal fractures extending from the central tensile crack
Formation of conjugate shears where the sample corner shear fractures intersect
Extension and bifurcation of the slot-corner associated extension fractures.
The sub-horizontal fractures were observed in the laboratory results only when bedding planes were present. It is not known whether these features would appear if the bedding planes were absent, though this model result certainly suggests that failure would occur preferentially along any horizontally oriented features intersected by the central fracture.
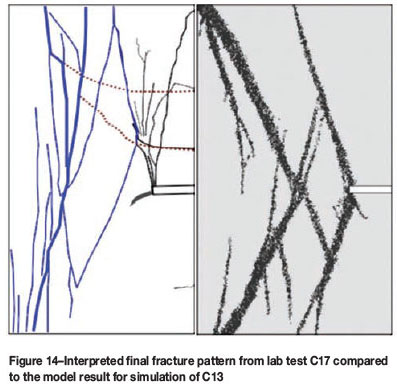
The appearance of the fracturing at the end of the analysis shows features that were not observed in test C13. However, the absence of corner-to-corner shear fractures in
Figure 1 suggests that the sample was not loaded to the same level as the Elfen model. The final fracture pattern is surprisingly similar to the result for sample C17 (Figure 2), where the fracturing to the left of the slot resulted in final failure of the sample. The laboratory result for C17 and the modelled C13 result are compared in Figure 14. The intact diamond shape formed between the slot corner fractures and the intersection of the sample corner fractures is captured in the model result, though in the C17 result the slot corner is effectively shifted upwards by the presence of the bedding-plane-associated sub-horizontal fracturing. Fractures 'inside' (boundary-side) the corner shears are also replicated.
Test C17 - slot in quartzite subjected to constant 33 MPa lateral load and increasing axial load
Fracture maps from various stages of the analysis are presented in Figure 15. The same features seen in the C13 model result are replicated here:
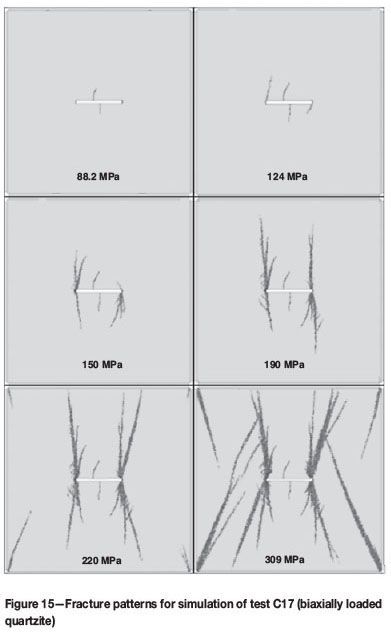
Appearance of a central tensile fracture
Face crushing
Fractures at various orientations at the slot corners
Large shear fractures extending from the sample corners at high load.
The central tensile fracture forms first, but does not grow as much as in the uniaxial simulation. The fracture does not form exactly at the centre of the span and immediately curves towards the centre. Slot corner fractures then appear, which also curve inwards over the slot. Sub-vertical fractures and a family of fractures, some inclined over the solid, then appear. These fractures grow and bifurcate as the sample corner fractures appear. Ultimately the sample and slot corner fractures intersect in a manner similar to that seen in the uniaxial simulation.
The slot corner fracture zones show a greater variety of orientation than in the uniaxial case. The fractures which curve over the slot are similar to those seen in the laboratory test results (Figure 2 and Figure 3a).
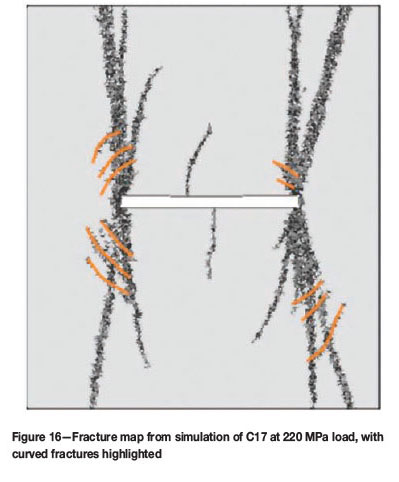
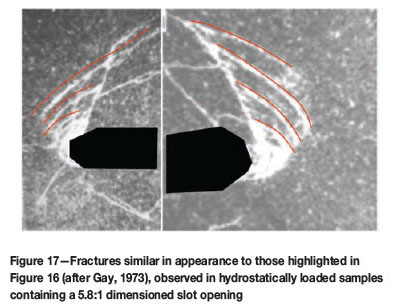
In addition, fracturing is present which was not described by Gay. These are highlighted in Figure 16. The fractures are curved with foci at the nearest slot corners. They initially form 'outside' - solid side - of the corner fractures, but are subsequently intersected by the slot corner 'shear' fractures. The appearance of these fractures in Gay's experiments may have been inhibited by the presence of pre-existing weaknesses in the quartzite. These features more closely resemble the sets of conjugate fractures described in an earlier paper by Gay (1973), which he characterizes as 'sub-parallel to the perimeter of the excavated slot' (Figure 17).
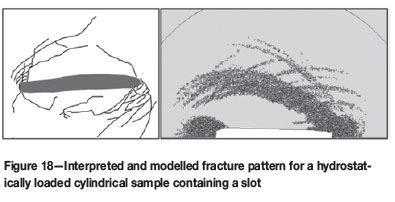
Modelling was undertaken to replicate this result. A cylindrical sample containing a slot was subjected to the same loading conditions as in the experiment. The resulting modelled fracture pattern is shown in Figure 18. Both 'perimeter-parallel' and shear fractures are evident in the result, indicating that the curved fractures observed in the simulation of test C17 are part of the conjugate system of shears that naturally occur around biaxially stressed openings. These features are obviously inhibited in Gay's uniaxial and biaxial experiments, possibly by preferential shear cracking sub-parallel to the major stress, or by the presence of bedding planes in the samples. In the models, these features occur only in the confined samples, which are closer to the hydrostatic loading in Gay's former experiments.
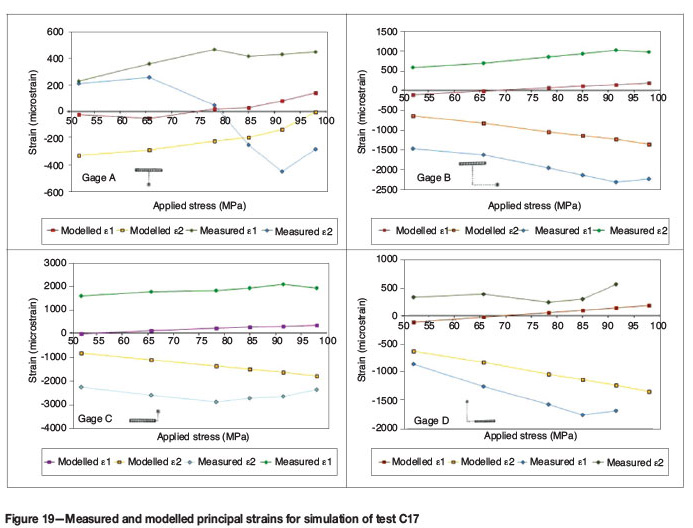
A separate simulation of test C17 was run with load applied in discrete stages, just as reported by Gay. During each stage, load is increased and the model allowed to return to steady state. The strain measurements by Gay are compared with strain measurements at the same positions in the simulation. The measured and modelled strains are compared in Figure 19.
With the exception of gauge A, all the modelled gauges reflect the trends observed in the experiment - a decrease in ε2 (i.e. increasingly compressive) and an increase in ε1 (i.e. increasingly tensile). In most cases, the rate of increase is similar, but the initial values are quite different. Since the monitored regions are undamaged at this loading stage, it seems that either the modelled Young's modulus is higher than that of the sample, or that some non-linear material behaviour was evident in the sample at low strain.
The readings from gauge A did not agree well with the model results. Crucial to interpreting this particular reading is knowledge of the degree of damage present during loading stages I-VI (see Gay's Figure 3). This measurement point is directly in the path of the central tensile fracture. The measured strains attain a maximum at an applied stress of 65 MPa, suggesting that the tensile crack reaches the measurement point at this stress level. In the model, the crack appears only at 75 MPa, and does not reach the measurement position for the 98 MPa applied load. This implies that the tensile strength or fracture energy capacity of the material are lower than that modelled. This is of course inferred from the readings only - it was not possible to track the development of the crack in the physical test. It is also possible that the measurements reflect the initial portion of the response, prior to the appearance of the central tensile fracture; however, the high initial tensile strains in both principal directions argue against this.
All indications are that the C17 sample was weaker and possibly less stiff than quoted. It may be possible to match the inferred sequence of failure in the experiment by adjusting the material parameters; however, the bedding planes should also be included in the model. Since the locations and properties of these planes are not certain, there are simply too many unknowns to allow such a match to be obtained in a reasonable time frame.
Test C18 - mining test on a slot in quartzite subjected to constant 27 MPa lateral load and 135 MPa axial load
During initial testing, it was found that the sample showed significant damage in the loading-up phase. A central tensile crack and extensive face crushing occurred before the slot was extended from its initial span of 25 mm. Closer examination of stress and strain histories revealed that a dynamic overshoot caused most of this damage. The model was run elastically in the loading-up phase to eliminate damage caused by the overshoot. Some damage was still evident, though this damage now took the form of slot corner fractures, dipping over the slot.
The actual state of the physical model after the application of initial stresses is not known. It may be possible that Gay loaded the specimen until some damage was perceived, perhaps by audible cracking, and then began the mining simulation. It is also possible that no damage occurred, and that the material was stronger than the model employed in the numerical simulations. The strain measurements provide some insight into the progression of damage (below).
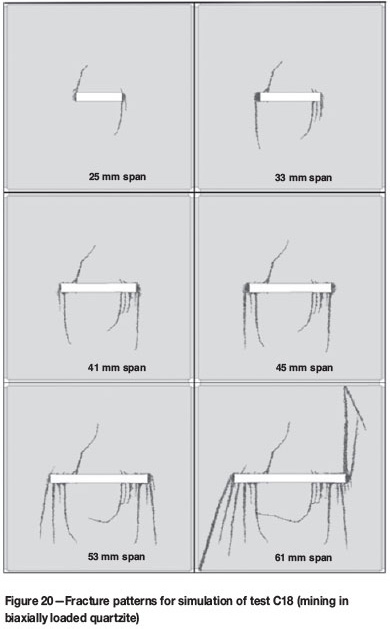
The progression of fracture in the simulation is presented in Figure 20. The main features of the physical fracture maps (Figure 3) are replicated, including face crushing, fractures which generally curve over the slot, and domical features extending all the way over the slot. Interestingly, the central tensile fracture does not appear in these simulations, suggesting that the initial formation of the slot corner fractures may inhibit the formation of this feature.
Comparisons of strain readings from the laboratory test and simulation are presented in Figure 21. The result for gauge A (above and right of the slot) shows very similar trends: ε1 increasing to 40-45 mm span and then decreasing; and ε2 showing the opposite trend with a transition at 3341 mm. Elastic analyses showed very similar trends, however the transition occurs at 45-49 mm for ε1 and at 41-45 mm for E2.
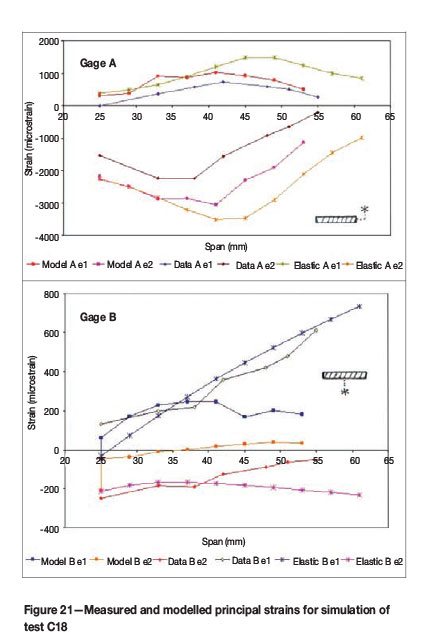
In the elastic result, this transition occurs for ε2 when the slot is undermined, and shortly thereafter for ε1. It seems that fracturing causes this transition to occur earlier in the simulated and measured cases, possibly due to damage in the face area which effectively increases the span of the slot. This indicates that the effects of fracturing are well captured by the simulation. The modelled strain values are uniformly greater than the measured strains, but by less than 0.75 millistrain. This may indicate that, for this model, the simulated stiffness was less than that of the sample.
The simulation of gauge B also shows similar trends to the experiment, but there are some notable differences. The first two points of the response (at 25 mm span) reflect the change in strain due to the appearance of a slot corner fracture. Both ε1 and ε2 are significantly increased (i.e. become less compressive) when this occurs: simulated ε1 approaches the measured strain, while simulated ε2 becomes less compressive than measured. The strain changes at the initial span show that the onset of fracturing at the slot corners decreases the deviatoric strain at centre-span, but increases the magnitude of the tensile strain.
Subsequent trends are similar, but ε2 shows a measured increase and a modelled decrease from 37-42 mm span. The measurements correlate well with the elastic model result. In the fracture simulation, a central tensile crack did not appear; however, a growing zone of plastic damage was present, which may account for the decrease in the strain history. According to the interpretation of strains above, the central tensile fracture did not occur in the sample test for the monitored span range. A central sub-vertical fracture can be seen in the fracture map (Figure 3); however, this fracture was slightly off-centre and hence out-of-line with the measurement point.
It seems likely that the C18 material was stronger than estimated by Gay.
Test C9 - mining test on a slot in sandstone subjected to constant 71.1 MPa axial load
A significant amount of microfracture-associated damage occurred in the first stage of the analysis, where the sample was in fact a solid block without the drill-hole. Fracturing occurred immediately when the drill hole was excavated. As this was not observed in the laboratory results, it is possible that the material was stronger than indicated in Gay's paper.
It may also be that some lateral confinement was applied.
A number of analyses were therefore performed with various material strengths and loading conditions. Analyses were conducted with applied lateral stresses of zero (uniaxial), 10 MPa (7.1:1) and 20 MPa (3.6:1). Due to fracturing in the first excavation stage (creating the drill hole) the material UCS was increased to 135 MPa and the tensile strength increased to 13.5 MPa (10 per cent of UCS).
The main features of the laboratory experiment (Figure 5) were:
A sub-vertical central fracture of limited length (<9 mm long)
Multiple short (< 7 mm) fractures dipping over the slot
Longer sub-vertical fractures dipping in both directions at spans greater than 40-50 mm.
The latter stages of the analysis, where presumably the sample failed, are not reported on.
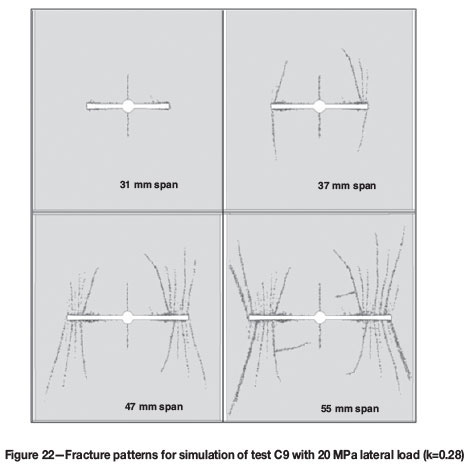
A reasonable correlation with observed fractures was obtained for an applied lateral load of 20 MPa (Figure 22). In this case, obvious fracturing is inhibited up to a span of 31 mm, which is similar to the span at which major fractures appeared in the laboratory test. Subsequent development of slot corner fractures matches the expected trend, though the modelled fractures at lower spans curve over the slot more readily. Sub-horizontal fracturing also occurs between the innermost extension fractures.
Features that were successfully simulated include:
A central tensile fracture
Face crushing
Extension fracturing around the face which dips over the slot at low spans and over the solid at greater spans.
Common features of the numerical results which were not seen in physical experiment include:
Sub-horizontal fracturing generally occurring over the centre of the span
Sample corner fractures linking with slot corner fractures.
These features were not observed in the laboratory up to a span of 62 mm. Either the material was significantly stronger than quoted in Gay's report, or the loading conditions were altered in such a way that significant lateral confinement was applied to the sample.
Conclusions and recommendations
Many of the characteristic features of the experimental results were replicated in the numerical models. The following trends were observed, which were consistent with theoretical models and with the experimental results.
Crushing ahead of the face
The formation of a sub-vertical tensile fracture at centre-span
The formation of groups or families of fractures originating from the crushed face zone and oriented sub-parallel to the major principal stress direction. These fractures:
Curve over the slot at high lateral loads, and at low extraction ratios
- Dip over the solid at low lateral loads, and at high extraction ratios.
- The formation of large corner-to-corner fractures which precede sample failure
Linking of slot corner and sample corner fractures leading to sample failure.
Other features were also observed that were not reported by Gay, including:
The appearance of curved fractures, concentrically oriented around the crushed zone (Figure 16)
Fracturing oriented perpendicular (i.e. sub-horizontal) to the major applied stress direction.
In the case of the 'sub-horizontal' fracturing, Gay did observe such fractures, but they were associated with the presence of bedding or pyrite bands within the material. The presence of similarly oriented fracturing in the simulations implies that fracturing will be directed along such features where they are present. Domical features were reported by Gay, and replicated in these results, though in the models these features appeared at lower confinements than expected.
The curved fractures were not reported in the experiments. These cracks appear to be conjugates to the expected shear fractures that occur sub-parallel to the major stress. It was found that these features were present in earlier experiments by Gay (1973) and that they naturally occur around hydrostatically (and possibly biaxially) stressed openings. The experiments where these fractures were observed were simulated and replicated.
Gay noted that his quartzite samples contained preexisting planes of weakness which influenced the fracture patterns and may have altered the material properties and failure mode. It was apparent that the physical samples were quite different from each other and that the tests could not be simulated using a single material for all the models. For example, C17 appeared to be weaker than the modelled Maraisburg quartzite, while C18 was probably stronger than the simulated material. C9 (the sandstone sample) was also probably much stronger than quoted by Gay, though it is possible that this strengthening may have been due to the application of some confinement to the sample.
The presence of these pre-existing features may also have contributed to the differences between the experimental and simulated strain measurements. Trends observed in the strain measurements were, nevertheless, reasonably well matched, with the exception being gauges that were located very close to the path of the central tensile fracture, as explained above. It was evident that the evolution of the central tensile fracture was not captured precisely in the simulation; however, this could have been better matched by adjusting the material properties, particularly the relative values of the tensile and shear strength.
The question remains as to whether the simulated fractures, made up of many single-element discontinuities at various orientations, adequately represent the real macro fractures, which are built up of these features at a much smaller scale than in the models. Investigations are currently under way to compare the characteristics of fracture planes that occur in the models (as above), to 'natural', cracks that are predefined during model construction.
References
Chen, J.F. 2008. Results of rock properties tests. Report2008. AngloGold Ashanti -01. 10 December 2008. Rocklab. [ Links ]
Cundall, P.A. 1989. Numerical experiments on localization in frictional materials. Archive of Applied Mechanics (IngenieurArchiv). [ Links ]
Gay, N.C. 1973. Fracture growth around openings in thick-walled cylinders of rock subjected to hydrostatic compression. International Journal of Rock Mechanics and Mining Sciences and Geomechanical Abstracts, vol. 10. pp. 209-233. [ Links ]
Gay, N.C. 1976. Fracture growth around openings in large blocks of rock subjected to uniaxial and biaxial compression. International Journal of Rock Mechanics and Mining Sciences and Geomechical Abstracts, vol. 13. pp. 231-243. [ Links ]
Klerck, P.A. 2000. The finite element modelling of discrete fracture in quasi-brittle materials. PhD thesis, University of Wales, Swansea. [ Links ]
Klerck, P.A., Sellers, E.J., and Owen, D.R.J. 2004. Discrete fracture in quasi-brittle materials under compressive and tensile stress states. Computer Methods in Applied. Mechanics and. Engineering, vol. 193. pp. 3035-3056. [ Links ]
Lenhardt, W.A. and Hagan, T.O. 1990. Observations and possible mechanisms of pillar-associated seismicity at great depth. International Deep Mining Conference, vol. 2: Technical Challenges in Deep Level Mining.Ross-Watt, D.A.J. and Robinson, P.D.K. (eds). The South African Institute of Mining and Metallurgy. Johannesburg, 1990. pp. 1193-1194. [ Links ]
Napier, J.A.L and Hildyard, M.W. 1992. Simulation of fracture growth around openings in highly stressed, brittle rock. Journal of the South African Institute of Mining and Metallurgy, vol. 92, no. 6. pp. 159-168. [ Links ]
Ryder, J.A. and Jager, A.J. 2002. A Textbook On Rock Mechanics For Tabular Hard Rock Mines. Safety in Mines Research Advisory Committee. The South African Institute of Mining and Metallurgy, Johannesburg. [ Links ]
Sellers, E.J. 1994. An anisotropic damage model for rock. PhD thesis, University of Cape Town. [ Links ]
Sellers, E.J. and Scheele, F. 1996. Prediction of anisotropic damage in experiments simulating mining in Witwatersrand Quartz blocks. International Journal of Rock Mechanics and Mining Sciences and Geomechical Abstracts, vol. 33, no. 7. [ Links ]
Vermeer, P.A. and de Borst, R. 1984. Non-associative Plasticity for Soils, Concrete and Rock. Heron, Rotterdam. [ Links ]
© The Southern African Institute of Mining and Metallurgy, 2012. ISSN2225-6253. This paper was first presented at the, Southern Hemisphere International Rock Mechanics Symposium (SHIRMS) 2012, 15-17 May 2012, Sun City, South Africa.

