


Servicios Personalizados
Articulo
 Inglés (pdf)
 Articulo en XML
 Referencias del artículo
Indicadores

Links relacionados
-
 Citado por Google
 -
 Similares en Google
Compartir

 Permalink
South African Journal of Industrial Engineering
versión On-line ISSN 2224-7890
versión impresa ISSN 1012-277X
S. Afr. J. Ind. Eng. vol.34 no.3 Pretoria nov. 2023
http://dx.doi.org/10.7166/34-3-2943
SPECIAL EDITION
A taxonomy of univariate anomaly detection algorithms for predictive maintenance
D. Barrish*; J.H. van Vuuren
Stellenbosch Unit for Operations Research in Engineering, Department of Industrial Engineering, Stellenbosch University, South Africa
ABSTRACT
Anomaly detection has a wide variety of applications, ranging from intrusion detection in cybersecurity to fraud detection in finance. Among the most prominent applications is predictive maintenance in manufacturing, which involves performing maintenance only when truly necessary, based on the condition of relevant equipment instead of following a fixed maintenance schedule. When implemented correctly, predictive maintenance can lead to more significant cost savings than other preventative maintenance approaches. Unfortunately, the unique challenges present in anomaly detection (including the very broad definition of an anomalous instance) make it particularly difficult to choose an appropriate algorithm, since each algorithm's performance is so dependent on the use case. In this paper we present an up-to-date taxonomy of univariate anomaly detection approaches to predictive maintenance, which is aimed at aiding practitioners to design effective predictive maintenance models for their specific use cases, based on numerical benchmark tests.
OPSOMMING
Anomalie-opsporing het 'n wye verskeidenheid toepassings, wat wissel van inbraakopsporing in kuberveiligheid tot bedrogopsporing in finansies. Een van die mees prominente toepassings daarvan is voorspellende instandhouding in vervaardiging, wat behels dat onderhoud slegs uitgevoer word wanneer dit werklik nodig is, gebaseer op die toestand van relevante toerusting, in plaas daarvan om 'n vaste onderhoudskedule te volg. Wanneer dit korrek geïmplementeer word, kan voorspellende instandhouding tot meer beduidende kostebesparings lei as ander voorkomende instandhoudingsbenaderings. Ongelukkig maak die unieke uitdagings wat in anomalie-opsporing teenwoordig is (insluitend die baie breë definisie van wat 'n anomale geval behels) dit besonder moeilik om 'n gepaste algoritme te kies, aangesien elke algoritme se prestasie so afhanklik is van die gebruiksgeval. In hierdie artikel bied ons 'n bygewerkte taksonomie van eenveranderlike anomalie-opsporingsbenaderings tot voorspellende instandhouding aan, wat daarop gemik is om praktisyns te help om doeltreffende voorspellende instandhoudingsmodelle vir hul spesifieke gebruiksgevalle te ontwerp, gebaseer op numeriese maatstaftoetse.
1. INTRODUCTION
The most recent conceptual evolution in maintenance strategies is predictive maintenance. Since this strategy prescribes maintenance only when it is truly necessary, significant cost savings may be achieved if it is implemented properly. In practice, predictive maintenance may, for instance, take the form of the analysis of temperature or vibration readings from sensors installed on critical machinery. If one is able to detect anomalies in the time series data from sensors accurately, then these anomalies may indicate that maintenance should be carried out before something breaks. This paper contains both a survey of current time series anomaly detection methods and guidelines aimed at aiding practitioners to implement predictive maintenance solutions successfully.
Interest in time series anomaly detection has surged in recent years. While this has led to numerous advancements, an explosion in the volume of literature on the topic has created a minefield for practitioners. The need for up-to-date surveys, taxonomies, and guidelines is accentuated by the constant stream of new algorithms, which are often evaluated according to different methodologies, metrics, and data sets. Moreover, a relatively recent paper by Wu and Keogh [1] casts doubt on the veracity and reliability of anomaly detection benchmark data sets established before 2020, further emphasising the need for a re-evaluation of the most prominent algorithms. The aim in this paper is to close both of these gaps for univariate time series by providing an up-to-date and easy-to-use taxonomy of the time series anomaly detection literature labyrinth, as well as an appraisal of the most widespread, effective, and recent algorithms.
The paper is structured as follows. First, a brief history of maintenance strategies is provided; this is followed by a brief review of some recent predictive maintenance solutions that are implemented in practice. Next, the discussion turns to an exposition of anomaly detection in time series, including the main difficulties experienced in the field and the types of anomaly one might encounter. Thereafter, a taxonomy and brief explanation are presented of the most noteworthy anomaly detection models that are available. The experimental design adopted in the paper is detailed next, with a focus on the rationale behind the data set, metrics, and models selected for a comparative study. Finally, the results of this study are presented and discussed. Conclusions are drawn in the hope of suggesting sensible guidelines for practitioners, as well as research avenues worthy of future exploration.
2. PREDICTIVE MAINTENANCE
Before diving into the details of time series anomaly detection, it is important to motivate the need for predictive maintenance and to provide some historical context. In this section, the evolution of maintenance strategies is briefly recounted, and a couple of successful practical predictive maintenance applications that require time series anomaly detection are showcased.
2.1. The history of maintenance strategies
Since the industrial revolution of the 18th century, manufacturers have continually sought to maximise the productivity and efficiency of their manufacturing processes. These efforts to optimise processes typically include reducing production downtime. Whenever production lines grind to a halt because of unforeseen breakdowns, even for brief periods of time, manufacturers can suffer significant losses. As a result, it is imperative to maintain machinery and equipment properly.
The notion of maintenance has evolved over time, much like manufacturing itself [2]. The simplest and oldest kind of maintenance is reactive (or corrective) maintenance. If a reactive strategy is followed, then maintenance is only performed once a fault or breakdown has been detected. Naturally, this can be costly. Not only is production halted while maintenance is performed, but the machinery might require much lengthier, costlier, and more extensive repairs owing to the lack of regular upkeep.
As a result, the concept of reactive maintenance has evolved into the notion of scheduled or planned maintenance. Scheduled maintenance seeks to enhance the productive life of equipment, reduce breakdowns, and minimise production losses by maintaining equipment at regular intervals before a serious breakdown occurs [2]. When implemented properly, scheduled maintenance can bring about significant improvements over reactive maintenance - but there is a complication. If maintenance is performed too infrequently, the machinery might break down prematurely anyway. Conversely, excessive maintenance is a waste of both time and money [2].
This leads to the most recent conceptual evolution in maintenance strategies - that of predictive maintenance. Predictive maintenance is aimed at performing maintenance only when truly necessary, thus saving both time and money when compared with scheduled maintenance. Although this has always been an ideal, the explosive growth in available data and rapid developments in machine learning have relatively recently turned predictive maintenance from a pipe dream into a reality [2].
2.2. Typical predictive maintenance solutions
Arguably, the notion of a control chart, proposed by Walter Shewhart during the 1920s [3], was one of the earliest forms of anomaly detection in manufacturing. While control charts remain perfectly adequate for a relatively simple system, the deluge of data typically available in recent years has encouraged practitioners to develop and harness more powerful methods.
One such example is the system developed by Carrasco et al. [4], employing the well-known XGBoost algorithm (among others) for anomaly detection in the sensor data of a steel production plant. Another case is that of Hsieh et al. [5], where an LSTM-based (long short-term memory) autoencoder was used to flag anomalies in real time on a production line. It is evident that more powerful models are better suited to modelling complicated multivariate time series data accurately, thus motivating the need to research more powerful algorithms and techniques for scaling the models to big data.
3. ANOMALY DETECTION IN TIME SERIES
The two cases cited above are but a small sample of the predictive maintenance solutions that use anomaly detection techniques. It would appear that the reformulation of predictive maintenance challenges as time series anomaly detection problems is popular and effective in practice. Before reviewing methods for anomaly detection in time series, it would be instructive to identify the most significant challenges experienced in the field, as well as the various types of anomaly one might encounter.
3.1. Challenges in time series anomaly detection
The problem of anomaly detection poses a handful of interesting and unique challenges. Careful consideration of these is necessary in order to understand the rationale behind the experimental design adopted in this paper, as well as the requirements of anomaly detection algorithms in general.
3.1.1. Inconsistent definition of an anomaly
The first and perhaps most obvious challenge is merely defining what an anomaly is. Despite its apparent simplicity, this is a deceivingly complex question. Many attempts have been made to define anomalies, with one of the better propositions being "an observation which deviates so much from other observations as to arouse suspicions that it was generated by a different mechanism" [6]. Although this definition is sensible, it harbours within it a serious problem - by how much must an observation deviate from the norm in order to arouse suspicion?
3.1.2. The precision-recall trade-off
A closely-related issue is the precision-recall trade-off [7]. Naturally, the minimum threshold by which an observation must deviate directly affects the number of observations that are flagged as anomalies. A simple way to detect all anomalies with absolute certainty would be to flag every single observation, but this is not very helpful from a practical perspective. Conversely, excessive caution might result in many undetected anomalies. As a result, a balance must be struck between producing false positives (incorrectly flagging a normal observation as an anomaly) and producing false negatives (failing to identify an anomaly correctly). The precision-recall trade-off has serious implications for anomaly detection, and should thus be considered carefully when setting anomaly score thresholds and designing anomaly detection systems.
3.1.3. The dearth of labels
Since one rarely works with a reliable definition of an anomaly, one would hope that a plethora of labelled examples would be obtainable. Unfortunately, this is rarely the case - especially in the field of predictive maintenance. Problems involving labelled anomalies are few and far between, since actual failures (anomalies) are relatively scarce, and gathering labels is usually a difficult and expensive process.
Although labels remain elusive, there is a silver lining. Since the presence of a true anomaly in a production plant would become painfully obvious after it had occurred, it may safely be deduced that past data are free of anomalies if nothing has broken down. This means that, in practice, one would typically have access to a training set consisting only of normal observations. As a result, anomaly detection is framed as a semi-supervised problem in this paper, as opposed to an unsupervised problem (in which case the training data could contain anomalies, but one would simply not know). This deduction makes matters slightly easier.
3.1.4. Lack of high-quality benchmark data sets
Reliable and representative benchmark suites are essential when evaluating and comparing models and algorithms. While numerous benchmark data sets have been compiled for time series anomaly detection, such as the popular NASA [8] and Numenta [9] benchmarks, Wu and Keogh [1] highlight four ways in which these benchmarks are typically flawed.
First, there is the issue of triviality. Too many of the anomalies contained in the data sets can be identified by invoking simple descriptive statistics or other basic techniques, without even having to look at the training data. Second, unrealistic anomaly density in certain cases may blur the line between anomaly detection and classification, and may also skew performance metrics. Third, in certain instances the ground truth is mislabelled. This casts significant doubt on claimed minor improvements in papers using these data sets. Finally, a run-to-failure bias often exists, meaning that anomalies tend to appear near the end of the time series, since data after a failure simply might not exist.
3.1.5. Inconsistent use of performance metrics
Unlike, for instance, an image classification task, time series anomaly detection lacks standard, agreed-upon benchmark data sets and metrics [1] (although efforts have recently been made to rectify this problem [10]). This makes it difficult to devise a competition akin to the ImageNet project, where different models were easily benchmarked and compared for their prediction accuracy. Most authors evaluate anomaly detection models by some combination of precision, recall, F1 score, AUROC (area under the receiver operating characteristic curve), and AUPRC (area under the precision-recall curve) [7]. When comparing algorithms from different papers, however, it is not clear which of these metrics should take precedence.
Keogh et al. [10] sought to alleviate this problem (as well as the concerns raised in Section 3.1.4 about the quality of benchmark data sets) by introducing a data set in which each problem instance only has a single anomaly. The rationale is that removing the dilemma of selecting an appropriate threshold (as discussed in Sections 3.1.1 and 3.1.2) allows for models to be compared solely based on their ability to find the region where an anomaly is most likely. This evaluation framework is appealing not only for its intuitive and interpretable nature, but also because it limits the number of additional algorithmic parameters that require tuning, making it easier to achieve the ideal of ceteris paribus when comparing algorithms.
It should be noted, however, that this evaluation framework is not without its drawbacks. One is that it does not account for how well the score of an anomaly is separated from the scores of the normal instances. While two models might both accurately identify the most anomalous instance, the model that differentiates anomalies more clearly from normal observations would perform better in practice, since it would be more forgiving when setting the anomaly threshold. The benchmarking framework proposed by Keogh et al. [10] nevertheless appears to be the most sensible of the options available in the literature.
3.1.6. Anomalies have to be detected in real time
In predictive maintenance, time is of the essence. Detecting anomalies months after they have occurred does nothing to prevent breakdowns. As a result, it is imperative that anomalies be identified as soon as possible so that their veracity may be ascertained and maintenance may be carried out if necessary.
This constraint has at least two practical implications when designing a predictive maintenance system. First, the model should be able to make inferences based on new data as they are processed in real time. In other words, the model has to be efficient enough and the hardware has to be powerful enough to handle the frequency of data. Second, the model should, ideally, be able to learn in an online fashion [2]. That is, it should be updated as new data are ingested, as opposed to being forced to retrain entirely afresh [5].
Most algorithms are not designed (at least initially) with streaming data in mind. Fortunately, however, it is usually a straightforward process to adapt the majority of existing algorithms to such a use case context using, for instance, streaming windows.
3.1.7. Inherited challenges from time series analysis and forecasting
Some of the challenges in time series analysis and forecasting are relevant in anomaly detection as well. For instance, many algorithms require the time series to be stationary (i.e., the data must have a constant mean, variance, and autocovariance) [11]. Another potential issue is that real-world time series data may exhibit gaps in the data at irregular intervals. In practice, both phenomena mean that careful consideration must be given to how the time series data are pre-processed.
3.2. A taxonomy of anomaly types in time series
Numerous attempts have been made to categorise the different kinds of anomaly that can be found in time series. These taxonomies of anomalies are remarkably useful: not only can they be employed to select the most appropriate algorithm for the problem, based on the most prevalent types of anomaly, but they can also improve the interpretability of results and aid in the development of synthetic benchmark data sets.
One such taxonomy was used by Braei and Wagner [12] and Choi et al. [13], among others. Their main anomaly categories are point anomalies (a data point or sequence that deviates suddenly from the norm), contextual anomalies (a data point or sequence that does not deviate from the normal range but, relative to the surrounding data, an unusual pattern or shape is observed), and collective anomalies (individual values within this type may seem trouble-free, but collectively they arouse suspicion).
Lai et al. [14] considered the above taxonomy to be limited, as it does not fully account for the temporal correlation that exists in time series data, and proffered the revised taxonomy illustrated graphically in Figure 1.
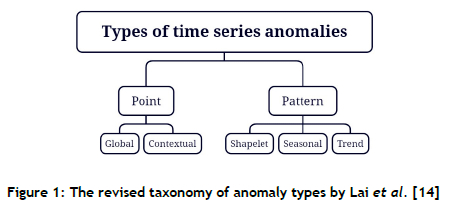
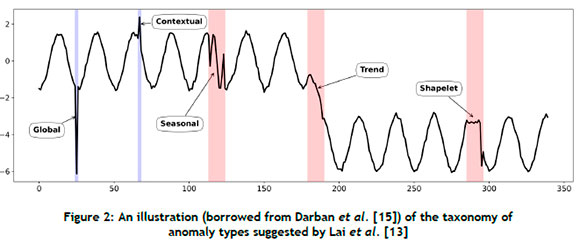
Point-wise anomalies (i.e., anomalies characterised by anomalous individual time points) are further partitioned into global and contextual anomalies. Conversely, pattern-wise anomalies are anomalous subsequences, and they are categorised further as shapelet, seasonal, or trend anomalies. These types of anomaly are illustrated graphically in Figure 2.
4. APPROACHES TO TIME SERIES ANOMALY DETECTION
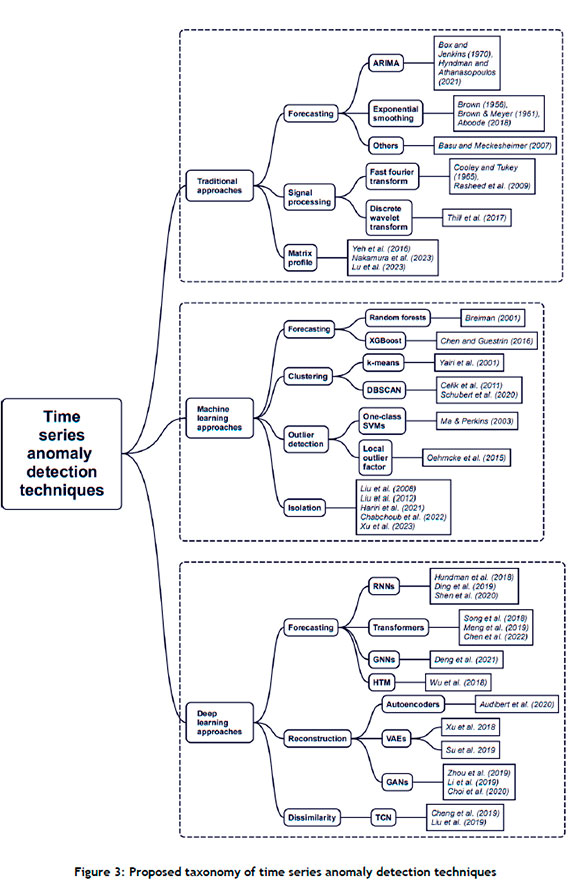
Anomaly detection in time series data requires a different approach from that which applies to non-time series data, since a temporal relationship exists between the data points, which means that the order of the data matters. Numerous categorisations of time series anomaly detection algorithms have been devised, including those found in survey papers by Markou and Singh [16], Munir et al. [17], Braei and Wagner [12], Cook et al. [18], Shaukat et al. [19], Wang et al. [20], Choi et al. [13], Schmidl et al. [21], Darban et al. [15], and Rewicki et al. [22]. In the proposed taxonomy that follows, the goal was to update and blend the best and most insightful surveys in the literature into a single diagram, shown in Figure 3, that illustrates the lay of the land in time series anomaly detection at the time of writing.
Time series anomaly detection lies at the intersection of several different fields, including time series analysis/forecasting, anomaly detection, machine learning, and deep learning. This means that repurposing and adapting techniques from adjacent fields is commonplace. For instance, embedding time series as vectors (such as in the Time2Vec [23] and ts2vec [24] models) unlocks a host of other algorithms that were previously only suitable for tabular data. Many machine-learning and deep-learning techniques have also been adapted similarly.
For the sake of brevity, our discussion of the algorithms here is limited to the main ideas behind each of them. The broad categorisation we have adopted bears some resemblance to the ones proposed by Braei and Wagner [12], Schmidl et al. [21], and Choi et al. [13]. Methods are partitioned into the classes of traditional approaches, machine-learning approaches, and deep-learning approaches. While the distinction between these categories may be fuzzy in the case of certain algorithms, these broad categories are nevertheless useful in orientating oneself within the labyrinth that is time series anomaly detection.
4.1. Traditional approaches
We define 'traditional' approaches loosely as algorithms that use well-known statistical, forecasting, or data-mining techniques. These approaches are typically (but not necessarily) computationally less demanding than machine-learning and deep-learning approaches.
4.1.1. Forecasting
The exponential smoothing and autoregressive integrated moving average (ARIMA) families of algorithms may be considered examples of a forecasting-based approach to anomaly detection. In other words, the predictive model forecasts the next time step, based on past data, and then the residual (the prediction error obtained by calculating the difference between the prediction and the observed value) is analysed to determine whether the data point is anomalous. The severity of the discrepancy between the predicted and observed values can be used to rank points by how anomalous they are perceived to be.
Exponential smoothing is a time series forecasting technique that predicts future values by affording more weight to recent observations and exponentially decreasing the weight as observations age. It was originally proposed and developed by Brown [25], [26] during the 1950s. The original algorithms and their variants remain among the most popular and effective forecasting approaches to this day. The work of Aboode [27] is a relatively recent example of a time series anomaly detection algorithm employing exponential smoothing.
ARIMA models were formally introduced by Box and Jenkins in 1970 [28], although their roots can be traced back to even earlier work. ARIMA models consist of an autoregressive component (representing the relationship between the current observation and lagged observations) and a moving average component (consisting of a weighted average of lagged prediction errors), while the 'integrated' component indicates that the differences between a time step and the previous time step are used. ARIMA and its variants are also among the most popular time series forecasting models.
Further discussion of both exponential smoothing and ARIMA can be found in the comprehensive forecasting textbook by Hyndman and Athanasopoulos [11]. Both approaches are relatively straightforward to apply in practice owing to a plethora of publicly-available implementations. It is acknowledged that other forecasting techniques also exist, such as the relatively simple MedianMethod [29].
4.1.2. Signal processing
Many prominent techniques in signal processing are also applicable to time series anomaly detection. For instance, the pivotal fast Fourier transform (FFT) [30] was applied to time series anomaly detection by Rasheed et al. [31], while the discrete wavelet transform (DWT) was employed by Thill et al. [32].
4.1.3. Matrix profile
'Matrix profile' refers to a novel data structure and its associated algorithms that are used to extract knowledge from time series data. It was pioneered by Keogh and Mueen [33], and adapted for anomaly detection by Lu et al. [34] and Nakamura et al. [35]. In essence, the process involves efficiently computing a matrix profile data structure (which consists of a distance profile and a profile index), and then extracting the top discords (anomalies) from that data structure.
4.2. Machine-learning approaches
In this section, we briefly review some of the most prominent machine-learning approaches to time series anomaly detection. In contrast with the statistical approaches discussed above, which are based on a set of assumptions about the underlying data-generating process, machine-learning models aim to learn patterns directly from the data. While statistical models often contain easily interpretable parameters, machine-learning models are frequently black boxes. They usually tend to be computationally more expensive, but also have the potential to model highly complex data successfully.
4.2.1. Forecasting
Traditional machine-learning algorithms, such as random forest [36] (a celebrated algorithm incorporating an ensemble of decision trees that is available in the ubiquitous Scikit-learn library [37]) and XGBoost [38] (an ensemble learning technique according to which incorrectly classified instances are weighted more heavily), have been adapted for time series regression. This means that they may also be harnessed for time series anomaly detection, in a similar way to other forecasting-based approaches [4], [21].
4.2.2. Clustering
Broadly speaking, clustering-based approaches group together points or sub-sequences based on some measure of similarity, and then find anomalies based on how close new observations are to these clusters. There are numerous clustering approaches to time series anomaly detection. Yairi et al. [39] employed k-means, a well-known expectation-maximisation algorithm that partitions data into clusters by minimising the sum of the squared distances between points and their cluster centroids. Similarly, Çelik et al. [40] used density-based spatial clustering of applications with noise (typically referred to as DBSCAN), which is a non-parametric algorithm that groups points that are closely packed together [41].
4.2.3. Outlier detection
Certain algorithms have been designed specifically to detect outliers and anomalies. One example is the local outlier factor (LOF), developed by Breunig et al. [42] and harnessed by Oehmcke et al. [43], which is another algorithm that identifies anomalies based on the notion of density. Yet another popular choice is the one-class support vector machine (SVM) proposed by Schölkopf et al. [44], and employed for time series anomaly detection by Ma et al. [45], among others. This is an extension of the original SVM developed by Vapnik et al. [46] to detect anomalies.
4.2.4. Isolation forest
Isolation forest is a well-known anomaly detection algorithm proposed by Liu et al. [47], [48]. The algorithm is based on the sensible notion that anomalies are data points that are few and different - meaning that they are susceptible to isolation. The intuitive idea behind isolation forest is that, if one repeatedly and randomly partitioned a data space into smaller subspaces, an anomaly would be susceptible to being isolated sooner. These partitioning divides are generated stochastically by selecting an arbitrary data feature and then sampling a value between the minimum and the maximum of that feature. An ensemble of trees is constructed in this manner, after which the average path length of a data point across all of the trees is used to determine an anomaly score.
Numerous variants on, and extensions to, the original isolation forest algorithm have been proposed [49], [50]. The most recent, and perhaps most promising, is deep isolation forest [51], which harnesses casually-initialised (i.e. non-optimised) deep neural networks to generate an ensemble of representations of the data. This means that simple axis-parallel cuts in the transformed data space may be equivalent to more sophisticated cuts in the original data space.
4.3. Deep-learning approaches
Deep-learning approaches are characterised by their use of neural networks, which have recently become ubiquitous thanks to simultaneous advances in hardware, algorithms, and data availability [7]. The bulk of recent research in time series anomaly detection has focused on this subfield [15]. This is unsurprising, since it is natural to hope that the recent breakthroughs achieved by neural networks in natural language processing and computer vision are transferable to anomaly detection.
Many of the approaches in this category have been designed with multivariate time series in mind. Despite this, they can usually be adapted or even applied directly to univariate time series as well. Although one may assume that the complexity of these models might be overkill for univariate problems [1], [22], our numerical experiments that follow are aimed at assessing the veracity of this assumption.
4.3.1. Reconstruction
As the name suggests, reconstruction-based models are characterised by their use of reconstruction errors. In broad terms, these models are trained to map normal data to an efficient representation in latent spaces, with the aim of minimising the error when transforming the representation back to the original space [13], [15].
The first subcategory contains autoencoders, which were originally proposed by Kramer [52] as a non-linear generalisation of principal component analysis. They consist of an encoder network and a decoder network. The former maps the input data to a lower-dimensional latent space, and the latter reconstructs the original input from the latent representation. Autoencoders are primarily used for dimensionality reduction, but numerous variants have demonstrated good performance in time series anomaly detection tasks [53].
Advances in deep learning have led to the development of more sophisticated autoencoder variants, such as variational autoencoders (VAEs) which leverage probabilistic modelling and can generate new samples from the learned latent space [54]. VAEs have found use in numerous practical time series anomaly detection studies, such as that of Su et al. [55].
Developed by Goodfellow et al. [56], generative adversarial networks (GANs) combine autoencoders with adversarial training. They consist of two networks: a generator and a discriminator. The generator generates synthetic data that resemble real data, while the discriminator is tasked with distinguishing between genuine and fake data. During adversarial training, the competitive dynamic results in the improvement of both networks. GANs have been harnessed for anomaly detection by Zhou et al. [57], Li et al. [58], and Choi et al. [59].
4.3.2. Forecasting
As before, forecasting-based models analyse the residual error after predictions have been made. Numerous deep-learning approaches to time series forecasting exist.
Recurrent neural networks (RNNs) are a type of neural network designed for application to sequences such as time series. They are characterised by recurrent connections, where the output from a previous step is fed into the next step. As a result, past steps affect future steps, resulting in the model developing a semblance of memory. The notion of memory in models has evolved further with the introduction of LSTM networks by Hochreiter and Schmidhuber [60] in their landmark 1997 paper. Many models have built upon their work, such as those proposed by Hundman et al. [8], Ding et al. [61], and Shen et al. [62].
Many of the recent leaps in both computer vision and natural language processing can be attributed to the transformer architecture, which was introduced in a seminal paper entitled 'Attention is all you need' by Vaswani et al. [63]. While transformers are designed to process sequential data, just like RNNs, they feature a handful of advantages, including the adoption of self-attention (meaning that the model can weight different parts of the input, based on their significance) and increased suitability for parallelisation. Transformers have been harnessed for time series anomaly detection by Song et al. [64], Meng et al. [65], and Chen et al. [66], among others.
Graph neural networks (GNNs) are an extension of the normal neural network architecture to data that can be represented in a network structure consisting of nodes and edges. Anomaly detection approaches that use GNNs include those by Zhao et al. [67], Deng and Hooi [68], and Chen et al. [66].
Finally, hierarchical temporal memory (HTM) is a type of model inspired by the structure and function of the neocortex of the human brain, and is mostly used for anomaly detection in streaming data. Models that use the HTM architecture include those proposed by Ding et al. [69] and Wu et al. [70].
4.3.3. Dissimilarity
Dissimilarity-based models use Euclidean, Minkowski, or Mahalanobis distances to measure how far values derived by the model differ from the cluster of accumulated data [13]. The main algorithm in this subclass is the temporal convolutional network (TCN), which adapts the convolutional neural network (CNN) specifically for sequential data. TCNs leverage the power of convolutional operations to capture and model the temporal relationships in the input sequences. Examples of work that used TCNs for time series anomaly detection are Cheng et al. [71] and Liu et al. [72].
5. EXPERIMENTAL DESIGN
In this section, we provide details about the experimental setup of our comparative study, as well as the rationale behind the choices that we made.
5.1. Benchmark data sets
In the light of the issues highlighted by Wu and Keogh [1], all algorithms in our comparative study were benchmarked solely on the data set made available by Keogh et al. [10]. This data set comprises 250 natural and synthetic time series with one anomaly in each, thus removing the 'threshold question' entirely. The anomalies that were inserted in the time series were meant to be representative in both difficulty and location (i.e., avoiding the run-to-failure bias).
5.2. Performance metrics
I n line with the rationale behind the data set and the scoring function outlined by Keogh et al. [10], the score for each time series in the data set is binary (i.e., the anomaly is either correctly or incorrectly identified), which is then converted into a percentage for the entire benchmark. As suggested by Keogh et al. [10], a small amount of tolerance before and after the anomaly is built into the scoring function. Since we focused on the predictive maintenance use case (in which real-time detection is of paramount importance), we also report the total computational time for each model.
5.3. Methodology
Our evaluation methodology was relatively straightforward. A model was trained (if necessary) on the training set of each time series in the data set for each algorithm under consideration, and subsequently evaluated on the test set of the time series. The number of anomalies correctly identified was tallied over the entire benchmark run and then converted into a score for that algorithm. Except where stated otherwise, all experiments were conducted by invoking Python implementations (adapted from either the original implementations or those developed by Schmidl et al. [21]) without hyperparameter tuning (i.e., using recommended defaults wherever applicable) on a personal computer equipped with an Intel Core i9-12900k CPU and Nvidia RTX 3080 Ti GPU.
5.4. Algorithms under consideration
Since it was impractical to evaluate the myriad algorithms proposed for time series anomaly detection, only those deemed most practical were considered. During our selection, we attempted to prioritise diversity, speed, and accuracy, based on the surveyed literature. Our sample aimed to be representative of those algorithms that may be useful in practice.
6. RESULTS AND DISCUSSION
Based on the results summarised in Table 1 and on the discussion on time series anomaly detection challenges and approaches, we proffer the following guidelines and remarks:
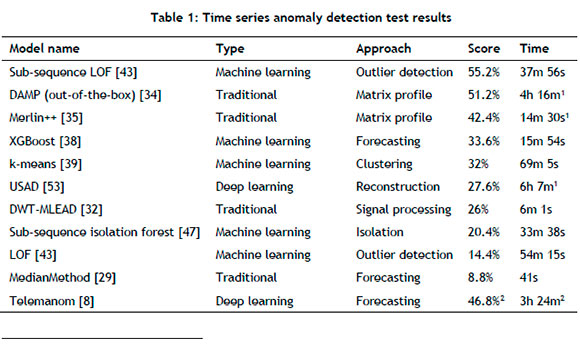
• Deep-learning approaches appear to be overkill for simple univariate time series, as confirmed by the results and the literature [1], [10], [22]. Many simpler methods seem to be faster (and even more accurate).
• Computational complexity has to be considered carefully when designing a time series anomaly detection system. Achieving real-time anomaly detection merely by using more powerful hardware might not be feasible in the case of certain algorithms.
• Algorithms that operate on sub-sequences instead of on individual points seem to perform far better, such as in the case of LOF. This makes sense, since operating on individual points neglects the temporal relationship between points.
• From our limited selection of algorithms, the best choice appeared to be sub-sequence LOF, which strikes a good balance between accuracy and efficiency.
• The need for transparent benchmarks and metrics is highlighted once again. Many much-vaunted algorithms in the literature seem to fall far short of their lofty claims.
1 These results are borrowed from the experiments in papers by Lu et al. [34] and Nakamura et al. [35], which used the same data set and scoring function. The hardware used included an Intel Core i7-9700 CpU. Although this means that the computation times are not directly comparable, one can easily and reasonably accurately estimate the time taken on an Intel Core i9-12900k CPU, given that the latter is 67% to 147% faster according to CPU benchmarks.
2 This result is borrowed from Nakamura et al. [35]. Since the algorithm regularly raised 'out of memory' errors, only the shortest 62 data sets were evaluated, meaning that the results should be seen as very optimistic.
7. CONCLUSION AND FUTURE WORK
In this paper we set out to provide practitioners with a practical guide to anomaly detection in time series. After careful consideration of the main challenges in the field, as well as the various types of anomaly one might encounter, we provided an accessible taxonomy of anomaly detection approaches, based on the approach we employed. A sensibly curated selection of algorithms was evaluated on a benchmark data set, with the results indicating that the sub-sequence LOF algorithm is a reasonable choice in practice owing to its balance between accuracy (55.2%) and speed.
In addition, a handful of avenues for future research have been identified. These include, among others, extending the current work to multivariate time series and/or streaming data, developing a more robust classification of the types of anomaly, quantifying how difficult anomalies of certain types are to detect, the use of anomaly types to select appropriate algorithms, and generating better, more representative benchmark data sets. Further work is required to fully align the field of time series anomaly detection in respect of benchmark data sets and metrics, but we believe that this paper is a step in the right direction.
REFERENCES
[1] R. Wu and E. J. Keogh, "Current time series anomaly detection benchmarks are flawed and are creating the illusion of progress," IEEE Transactions on Knowledge and Data Engineering, vol. 35, no. 3, pp. 2421-2429, 2023. [ Links ]
[2] P. Kamat and R. Sugandhi, "Anomaly detection for predictive maintenance in Industry 4.0 - A survey," in E3S Web of Conferences, Lisbon, 2020. [ Links ]
[3] W. A. Shewhart, "Quality control charts," Bell System Technical Journal, vol. 35, no. 3, pp. 593603, 1926. [ Links ]
[4] J. Carrasco, D. López, I. Aguilera-Martos, D. García-Gil, M. Irina, M. García-Barzana, M. Arias-Rodil, J. Luengo, and F. Herrera, "Anomaly detection in predictive maintenance: A new evaluation framework for temporal unsupervised anomaly detection," Neurocomputing, vol. 462, pp. 440-452, 2021. [ Links ]
[5] R.-J. Hsieh, J. Chou, and C.-H. Ho, "Unsupervised online anomaly detection on multivariate sensing time series data for smart manufacturing," in IEEE Conference on Service-Oriented Computing and Applications, Kaohsiung, 2019. [ Links ]
[6] D. Hawkins, Identification of outliers, Berlin: Springer, 1980. [ Links ]
[7] A. Geron, Hands-on machine learning with Scikit-Learn, Keras, and TensorFlow: Concepts, tools, and techniques to build intelligent systems, Sebastopol (CA): O'Reilly Media, 2022. [ Links ]
[8] K. Hundman, V. Constantinou, C. Laporte, I. Colwell, and T. Soderstrom, "Detecting spacecraft anomalies using LSTMs and nonparametric dynamic thresholding," in ACM SIGKDD International Conference on Knowledge Discovery & Data Mining, London, 2018. [ Links ]
[9] S. Ahmad, A. Lavin, S. Purdy, and Z. Agha, "Unsupervised real-time anomaly detection for streaming data," Neurocomputing, vol. 262, pp. 134-147, 2017. [ Links ]
[10] E. Keogh, "Time-series anomaly detection datasets," June 2021. [Online]. Available: https://www.cs.ucr.edu/-eamonn/time_series_data_2018/UCR_TimeSeriesAnomalyDatasets2021.zip. [Accessed 20 May 2023]. [ Links ]
[11] R. Hyndman and G. Athanasopoulos, Forecasting: Principles and practice, Melbourne: OTexts, 2021. [ Links ]
[12] M. Braei and S. Wagner, "Anomaly detection in univariate time-series: A survey on the state-of-the-art," 2020. [Online]. Available: https://arxiv.org/abs/2004.00433. [Accessed 20 May 2023]. [ Links ]
[13] K. Choi, J. Yi, C. Park, and S. Yoon, "Deep learning for anomaly detection in time-series data: Review, analysis, and guidelines," IEEE Access, vol. 9, pp. 120043-120065, 2021. [ Links ]
[14] K.-H. Lai, D. Zha, J. Xu, Y. Zhao, G. Wang, and X. Hu, "Revisiting time series outlier detection: Definitions and benchmarks," in Neural Information Processing Systems Track on Datasets and Benchmarks, Virtual event, 2021. [ Links ]
[15] Z. Z. Darban, G. I. Webb, S. Pan, C. C. Aggarwal, and M. Salehi, "Deep learning for time series anomaly detection: A survey," 2022. [Online]. Available: https://arxiv.org/abs/2211.05244. [Accessed 20 May 2023]. [ Links ]
[16] M. Markou and S. Singh, "Novelty detection: A review - Part 1: Statistical approaches," Signal Processing, vol. 83, no. 12, pp. 2481-2497, 2003. [ Links ]
[17] M. Munir, M. A. Chattha, A. Dengel, and S. Ahmed, "A comparative analysis of traditional and deep learning-based anomaly detection methods for streaming data," in IEEE International Conference on Machine Learning and Applications, Boca Raton (FL), 2019. [ Links ]
[18] A. A. Cook, G. Misirli, and Z. Fan, "Anomaly detection for IoT time-series data: A survey," IEEE Internet of Things Journal, vol. 7, pp. 6481-6494, 2020. [ Links ]
[19] K. Shaukat, T. M. Alam, S. Luo, S. Shabbir, I. A. Hameed, J. Li, S. K. Abbas, and U. Javed, "A review of time-series anomaly detection techniques: A step to future perspectives," in Future of Information and Communication Conference, Virtual event, 2021. [ Links ]
[20] S. Wang, J. F. Balarezo, S. Kandeepan, A. Al-Hourani, K. G. Chavez, and B. Rubinstein, "Machine learning in network anomaly detection: A survey," IEEE Access, vol. 9, pp. 152379-152396, 2021. [ Links ]
[21] S. Schmidl, P. Wenig, and T. Papenbrock, "Anomaly detection in time series: A comprehensive evaluation," Proceedings of the VLDB Endowment (PVLDB), vol. 15, pp. 1779-1797, 2022. [ Links ]
[22] F. Rewicki, J. Denzler, and J. Niebling, "Is it worth it? Comparing six deep and classical methods for unsupervised anomaly detection in time series," Applied Sciences, vol. 13, no. 3, art. no. 1778, 2023. [ Links ]
[23] S. M. Kazemi, R. Goel, S. Eghbali, J. Ramanan, J. Sahota, S. Thakur, S. Wu, C. Smyth, P. Poupart, and M. A. Brubaker, "Time2Vec: Learning a vector representation of time," 2019. [Online]. Available: https://arxiv.org/abs/1907.05321. [Accessed 20 May 2023]. [ Links ]
[24] Z. Yue, Y. Wang, J. Duan, T. Yang, C. Huang, Y. Tong, and B. Xu, "TS2Vec: Towards universal representation of time series," in AAAI Conference on Artificial Intelligence, vol. 36, no. 8, pp. 8980-8987, 2022. [ Links ]
[25] R. G. Brown, Exponential smoothing for predicting demand, Cambridge (MA): Arthur D. Little, 1956. [ Links ]
[26] R. G. Brown and R. F. Meyer, "The fundamental theorem of exponential smoothing," The Bell System Technical Journal, vol. 5, pp. 673-685, 1961. [ Links ]
[27] A. Aboode, "Anomaly detection in time series data based on Holt-Winters method," Master's thesis in Computer Science and Engineering, KTH Royal Institute of Technology, Stockholm, 2018. [ Links ]
[28] G. E. P. Box and G. M. Jenkins, Time series analysis: Forecasting and control, San Fransico (CA): Holden-Day, 1970. [ Links ]
[29] S. Basu and M. Meckesheimer, "Automatic outlier detection for time series: An application to sensor data," Knowledge and Information Systems, vol. 11, pp. 137-154, 2007. [ Links ]
[30] J. Cooley and J. Tukey, "An algorithm for the machine calculation of complex Fourier series," Mathematics of Computation, vol. 19, pp. 297-301, 1965. [ Links ]
[31] F. Rasheed, P. Peng, R. Alhajj, and J. Rokne, "Fourier transform based spatial outlier mining," in International Conference on Intelligent Data Engineering and Automated Learning, Burgos, 2009. [ Links ]
[32] M. Thill, W. Konen, and T. Back, "Time series anomaly detection with discrete wavelet transforms and maximum likelihood estimation," in International Conference on Time Series, Granada, 2017. [ Links ]
[33] C.-C. M. Yeh, Y. Zhu, L. Ulanova, N. Begum, Y. Ding, H. A. Dau, D. F. Silva, A. Mueen, and E. Keogh, "Matrix profile I: All pairs similarity joins for time series: A unifying view that includes motifs, discords and shapelets," in IEEE International Conference on Data Mining, Barcelona, 2016. [ Links ]
[34] Y. Lu, R. Wu, A. Mueen, M. A. Zuluaga, and E. Keogh, "DAMP: Accurate time series anomaly detection on trillions of datapoints and ultra-fast arriving data streams," Data Mining and Knowledge Discovery, vol. 37, pp. 627-669, 2023. [ Links ]
[35] T. Nakamura, R. Mercer, M. Imamura, and E. Keogh, "MERLIN++: Parameter-free discovery of time series anomalies," Data Mining and Knowledge Discovery, vol. 37, pp. 670-709, 2023. [ Links ]
[36] L. Breiman, "Random forests," Machine Learning, vol. 45, pp. 5-32, 2001. [ Links ]
[37] F. Pedregosa, G. Varoquaux, A. Gramfort, V. Michel, B. Thirion, O. Grisel, M. Blondel, P. Prettenhofer, R. Weiss, V. Dubourg, J. Vanderplas, A. Passos, D. Cournapeau, M. Brucher, M. Perrot, and E. Duchesnay, "Scikit-learn: Machine learning in Python," Journal of Machine Learning Research, vol. 12, pp. 2825-2830, 2011. [ Links ]
[38] T. Chen and C. Guestrin, "XGBoost: A scalable tree boosting system," in ACM SIGKDD International Conference on Knowledge Discovery and Data Mining, San Francisco (CA), 2016. [ Links ]
[39] T. Yairi, Y. Kato, and K. Hori, "Fault detection by mining association rules from house-keeping data," in International Symposium on Artificial Intelligence and Robotics & Automation in Space, Quebec, 2001. [ Links ]
[40] M. Çelik, F. Dadaser-Çelik, and A. S. Dokuz, "Anomaly detection in temperature data using DBSCAN algorithm," in International Symposium on Innovations in Intelligent Systems and Applications, Istanbul, 2011. [ Links ]
[41] E. Schubert, J. Sander, M. Ester, H. P. Kriegel, and X. Xu, "DBSCAN revisited, revisited: Why and how you should (still) use DBSCAN," ACM Transactions on Database Systems, vol. 42, no. 3, pp. 121, 2017. [ Links ]
[42] M. M. Breunig, H.-P. Kriegel, R. T. Ng, and J. Sander, "LOF: Identifying density-based local outliers," SIGMOD Record, vol. 29, no. 2, pp. 93-104, 2000. [ Links ]
[43] S. Oehmcke, O. Zielinski, and O. Kramer, "Event detection in marine time series data," in Annual German Conference on AI, Dresden, 2015. [ Links ]
[44] B. Schölkopf, R. C. Williamson, A. Smola, J. Shawe-Taylor, and J. Platt, "Support vector method for novelty detection," in Advances in Neural Information Processing Systems, Denver (CO), 1999. [ Links ]
[45] J. Ma and S. Perkins, "Time-series novelty detection using one-class support vector machines," in International Joint Conference on Neural Networks, Portland (OR), 2003. [ Links ]
[46] A. Y. Chervonenkis, "Early history of support vector machines," in Empirical Inference, B. Schölkopf, Z. Luo, and V. Vovk, Eds. Berlin: Springer, 2013, pp. 13-20. [ Links ]
[47] F. T. Liu, K. M. Ting, and Z.-H. Zhou, "Isolation forest," in IEEE International Conference on Data Mining, Pisa, 2008. [ Links ]
[48] F. T. Liu, K. Ting, and Z.-H. Zhou, "Isolation-based anomaly detection," ACM Transactions on Knowledge Discovery From Data, vol. 6, pp. 1-39, 2012. [ Links ]
[49] Y. Chabchoub, M. U. Togbe, A. Boly, and R. Chiky, "An in-depth study and improvement of isolation forest," IEEE Access, vol. 10, pp. 10219-10237, 2022. [ Links ]
[50] S. Hariri, M. C. Kind, and R. J. Brunner, "Extended isolation forest," IEEE Transactions on Knowledge and Data Engineering, vol. 33, no. 4, pp. 1479-1489, 2021. [ Links ]
[51] H. Xu, G. Pang, Y. Wang, and Y. Wang, "Deep isolation forest for anomaly detection," IEEE Transactions on Knowledge and Data Engineering, vol. 35, pp. 1-14, 2023. [ Links ]
[52] M. A. Kramer, "Nonlinear principal component analysis using autoassociative neural networks," AIChE Journal, vol. 37, pp. 233-243, 1991. [ Links ]
[53] J. Audibert, P. Michiardi, F. Guyard, S. Marti, and M. A. Zuluaga, "USAD: Unsupervised anomaly detection on multivariate time series," in ACM SIGKDD International Conference on Knowledge Discovery & Data Mining, Virtual event (CA), 2020. [ Links ]
[54] D. P. Kingma and M. Welling, "An introduction to variational autoencoders," Foundations and Trends® in Machine Learning, vol. 12, pp. 307-392, 2019. [ Links ]
[55] Y. Su, Y. Zhao, C. Niu, R. Liu, W. Sun, and D. Pei, "Robust anomaly detection for multivariate time series through stochastic recurrent neural network," in Robust Anomaly Detection for Multivariate Time Series through Stochastic Recurrent Neural Network, Anchorage (AK), 2019. [ Links ]
[56] I. Goodfellow, J. Pouget-Abadie, M. Mirza, B. Xu, D. Warde-Farley, S. Ozair, A. Courville, and Y. Bengio, "Generative adversarial nets," in Advances in Neural Information Processing Systems, Montreal, 2014. [ Links ]
[57] B. Zhou, S. Liu, B. Hooi, X. Cheng, and J. Ye, "BeatGAN: Anomalous rhythm detection using adversarially generated time series," in International Joint Conference on Artificial Intelligence, Macao, 2019. [ Links ]
[58] D. Li, D. Chen, B. Jin, L. Shi, J. Goh, and S.-K. Ng, "MAD-GAN: Multivariate anomaly detection for time series data with generative adversarial networks," in International Conference on Artificial Neural Networks, Munich, 2019. [ Links ]
[59] Y. Choi, H. Lim, H. Choi, and I.-J. Kim, "GAN-based anomaly detection and localization of multivariate time series data for power plant," in IEEE International Conference on Big Data and Smart Computing, Busan, 2020. [ Links ]
[60] S. Hochreiter and J. Schmidhuber, "Long short-term memory," Neural Computation, vol. 9, no. 8, pp. 1735-1780, 1997. [ Links ]
[61] N. Ding, H. Ma, H. Gao, Y. Ma, and G. Tan, "Real-time anomaly detection based on long short-term memory and Gaussian mixture model," Computers and Electrical Engineering, art. no. 106458, 2019. [ Links ]
[62] L. Shen, Z. Li, and J. Kwok, "Timeseries anomaly detection using temporal hierarchical one-class network," in Advances in Neural Information Processing Systems, Vancouver, 2020. [ Links ]
[63] A. Vaswani, N. Shazeer, N. Parmar, J. Uszkoreit, L. Jones, A. N. Gomez, L. Kaiser, and I. Polosukhin, "Attention is all you need," in Advances in Neural Information Processing Systems, Long Beach (CA), 2017. [ Links ]
[64] H. Song, D. Rajan, J. Thiagarajan, and A. Spanias, "Attend and diagnose: Clinical time series analysis using attention models," in AAAI Conference on Artificial Intelligence, New Orleans (LA), 2018. [ Links ]
[65] H. Meng, Y. Zhang, Y. Li, and H. Zhao, "Spacecraft anomaly detection via transformer reconstruction error," in International Conference on Aerospace System Science and Engineering, Toronto, 2019. [ Links ]
[66] Z. Chen, D. Chen, X. Zhang, Z. Yuan, and X. Cheng, "Learning graph structures with transformer for multivariate time-series anomaly detection in IoT," IEEE Internet of Things Journal, vol. 9, pp. 91799189, 2022. [ Links ]
[67] H. Zhao, Y. Wang, J. Duan, C. Huang, D. Cao, Y. Tong, B. Xu, J. Bai, J. Tong, and Q. Zhang, "Multivariate time-series anomaly detection via graph attention network," in IEEE International Conference on Data Mining, Sorrento, 2020. [ Links ]
[68] A. Deng and B. Hooi, "Graph neural network-based anomaly detection in multivariate time series," in AAAI Conference on Artificial Intelligence, Vancouver, 2021. [ Links ]
[69] N. Ding, H. Ma, H. Gao, Y. Ma, and G. Tan, "Multivariate-time-series-driven real-time anomaly detection based on Bayesian network," Sensors, vol. 18, pp. 129-134, 2018. [ Links ]
[70] J. Wu, W. Zeng, and F. Yan, "Hierarchical temporal memory method for time-series-based anomaly detection," Neurocomputing, vol. 273, pp. 535-546, 2018. [ Links ]
[71] Y. Cheng, Y. Xu, H. Zhong, and Y. Liu, "HS-TCN: A semi-supervised hierarchical stacking temporal convolutional network for anomaly detection in IoT," in IEEE International Performance Computing and Communications Conference, London, 2019. [ Links ]
[72] J. Liu, H. Zhu, Y. Liu, H. Wu, Y. Lan, and X. Zhang, "Anomaly detection for time series using temporal convolutional networks and Gaussian mixture model," Journal of Physics: Conference Series, vol. 1187, no. 4, art. no. 042111, 2019. [ Links ]
[73] H. Xu, W. Chen, N. Zhao, Z. Li, J. Bu, Z. Li, Y. Liu, Y. Zhao, D. Pei, Y. Feng, J. Chen, Z. Wang, and H. Qiao, "Unsupervised anomaly detection via variational auto-encoder for seasonal KPIs in web applications," in World Wide Web Conference, Lyon, 2018. [ Links ]
* Corresponding author: daniel.barrish@gmail.com
ORCID® identifiers
D. Barrish: https://orcid.org/0009-0007-3528-5869
J.H. van Vuuren: https://orcid.org/0000-0003-4757-5832

