


Serviços Personalizados
Artigo
 Inglês (pdf)
 Artigo em XML
 Referências do artigo
Indicadores

Links relacionados
-
 Citado por Google
 -
 Similares em Google
Compartilhar

 Permalink
SA Journal of Industrial Psychology
versão On-line ISSN 2071-0763
versão impressa ISSN 0258-5200
SA j. ind. Psychol. vol.48 no.1 Johannesburg 2022
http://dx.doi.org/10.4102/sajip.v48i0.1960
ORIGINAL RESEARCH
Replicating the essentially unidimensional model of the MACE work-to-family enrichment scale: Going beyond goodness-of-fit indices
Pieter SchaapI; Eileen KoekemoerI; Marissa BrouwersII
IDepartment of Human Resource Management, Faculty of Economic and Management Sciences, University of Pretoria, Pretoria, South Africa
IISchool for Industrial Psychology and Human Resource Management, Faculty of Economic and Management Sciences, North-West University, Potchefstroom, South Africa
ABSTRACT
ORIENTATION: Overreliance on goodness-of-fit (GoF) indices in confirmatory factor analysis (CFA) model fit evaluations appears to negatively influence the integrity and replicability of research findings in general, and on research to develop work-to-family enrichment (WFE) theory in particular
RESEARCH PURPOSE: The purpose of this study was to test for the conceptual replicability of the essentially unidimensional CFA model of the MACE Work-to-Family Enrichment scale (MACE-W2FE) using Bayesian structural equation modelling
MOTIVATION FOR THE STUDY: Multidimensional and second-order factor models are commonly reported for WFE instruments, but the more tenable essentially unidimensional model has remained largely untested, because of the limitations of GoF indices.
RESEARCH APPROACH/DESIGN AND METHOD: Two independent cross-sectional study samples of 627 and 346 employees from various industry sectors was used. Bayesian structural equation modelling (BSEM) was applied to assess whether model misspecifications at local indicator level were substantive in terms of classical test theory, and justified the rejection of an essentially unidimensional CFA model (the breadth factor) for different MACE-W2FE versions.
MAIN FINDINGS: In this study it was found that the essentially unidimensional model of the MACE-W2FE conceptually replicated across different studies, samples, MACE-W2FE versions and statistical theorems
PRACTICAL/MANAGERIAL IMPLICATIONS: The MACE-W2FE can be univocally scored as a single breadth factor for use in future research.
CONTRIBUTION/VALUE-ADD: This study demonstrated the value of local indicator misspecification analysis using BSEM in countering deficient model testing in WFE studies.
Keywords: work-family enrichment; essentially unidimensional; Bayesian structural equation modeling(BSEM); goodness-of-fit indices; local indicator misspecification.
Introduction
In an editorial article in the European Journal of Psychological Assessment titled 'Why psychological assessment needs to start worrying about model fit' (p. 313), Greiff and Heene (2017) claimed that in the preceding two decades researchers had relied heavily on Hu and Bentler's (1999) suggested cut-off values for indices of model fit in structural equation modelling (SEM) for the majority of publications in the field of psychology, despite strong warnings against such practices. More specifically, Jackson et al. (2009, cited in McNeish & Hancock, 2018) contended that close to 60% of 350 published psychology studies explicitly used model fit indices to adjudicate model fit and concluded 'we also did not find evidence that warnings about strict adherence to Hu and Bentler's suggestions were being heeded' (p. 2). Goodness-of-fit (GoF) indices, such as the comparative fit index (CFI) and the root mean square error of approximation (RMSEA), have been shown to be unreliable, because they are insensitive to important misspecifications at the local indicator level, even for close-fitting SEMs (Hayduk, 2014; McNeish & Hancock, 2018; Ropovik, 2015). According to Ropovik (2015) the residual correlation matrix for measurement models was meaningfully inspected in only 3% of publications in psychology indicating that most authors were oblivious to the importance of local indicator misspecification analyses (e.g. correlated residuals). Goodness-of-fit indices are at most provisional indicators of model fit and should always be complemented by local indicator misspecification analysis (Greiff & Heene, 2017; Ropovik, 2015; Schaap, 2019). According to Ropovik (2015), empirically sound measurement models are prerequisites for the integrity of research findings, and their use impacts on the replicability of research directly. Re-evaluating SEM models that were previously accepted using predominately GoF indices without local indicator misspecification analyses may clear the backlog of negative consequences of earlier deficient model testing and enhance model replicability (Hayduk, 2014; Schaap, 2019). In this study, the value of going beyond GoF indices in evaluating the dimensionality of a measure by offering a meaningful explanation of model (mis)fit using local indicator misspecification analysis by means of Bayesian structural equation modelling (BSEM) has been demonstrated (Asparouhov et al., 2015).
The MACE (the acronym MACE represents the names of the authors), a measure of work-to-family enrichment (WFE) based on Greenhaus and Powell's (2006) theory of WFE, was used to demonstrate the usefulness of BSEM and local indicator misspecification analysis in testing a measures dimensionality. According to Schaap and Koekemoer (2021), resolving the dimensionality vacillations of the MACE reported across studies is important. In this study the theory and findings published in Schaap and Koekemoer (2021) has been tested using alternative samples, different measurement formats and a different statistical theorem known as Bayes theory. This approach is known as 'conceptual replication' (p. 5) which tests the robustness and generalisability of a theoretical claim to alternative methodological procedures, format of the measure and samples (Zwaan et al., 2017). Zwaan et al. (2017) calls for making replicability main stream in the behavioural sciences. Measurement model replicability is key to the building of sound theory.
The WFE has been defined as the 'extent to which experiences in one role improve the quality in the other role' (Greenhaus & Powell, 2006, p. 73). The WFE theory postulates that the resources (skills and perspectives, social capital, psychological and physical resources, flexibility and material resources) generated in the work context can be transferred to the family domain, resulting in improved performance, affect and ultimately 'quality of life' (De Klerk et al., 2013).
The most prominent and internationally best-known measure of WFE is Carlson's Work-to-Family Enrichment Scale (WFES) (Carlson et al., 2006). In the South African context, the multidimensional MACE Work-to-Family Enrichment Scale (MACE-WFE) is a bidirectional measure consisting of the family-to-work enrichment scale (MACE-F2WE) and the work-to-family enrichment scale (MACE-W2FE), that was developed by De Klerk (2013) and later published in a scientific journal (De Klerk et al., 2013). In most studies the WFE was used as a first-order factor model, while in other studies a second-order model was added to avoid the biasing effects of multicollinearity in the analyses (De Klerk et al., 2015; Koekemoer et al., 2017; Marais et al., 2014; Van Zyl, 2020). Except for De Klerk (2013), none of these earlier studies tested for a first-order unidimensional model of the MACE-W2FE, despite strong empirical evidence suggesting that a substantive general factor existed (Schaap & Koekemoer, 2021). According to Reise et al. (2010), first-order unidimensional models for measures of psychological constructs rarely display good GoF, whereas first-order multidimensional models and hierarchical models almost always display good GoF. This appears to be true for the MACE-W2FE, where good-fitting models guided by GoF indices were reported for a correlated first-order model (De Klerk et al., 2015) and a second-order model (Koekemoer et al., 2017; Marais et al., 2014).
According to Rodriguez et al. (2016), there is ample evidence that measures of psychological constructs are almost universally hierarchical constructs (they contain both general and specific domains). However, psychological measures are often broken up into subdomains to represent multidimensional measures with high GoFs, whereas they could have been interpreted as single latent variables with trivial elements of multidimensionality despite showing lower GoFs (Reise et al., 2013a; Rodriguez et al., 2016). Consequently, measurement models that support unidimensional constructs with trivial elements of multidimensionality - also known as an 'essentially' unidimensional factor model that can be univocally interpreted (Reise et al., 2013b; Rodriguez et al., 2016) - frequently remain untested.
Moreover, GoF indices have been shown to be overly sensitive in testing essentially unidimensional models because these models rarely show acceptable model fit, even when the model misspecifications are minor and are thus unlikely to have any substantive consequences (Reise et al., 2013a). Schaap and Koekemoer (2021) recently found support for an essentially unidimensional model of the MACE-W2FE using bifactor and local indicator misspecification analyses in SEM with the frequentist-based maximum likelihood (ML) estimation, after the unidimensional model was rejected by the GoF indices. However, these findings may not generalise to other samples and measurement formats or when different and more refined methods of analyses are used. In this study, the authors tested if an essentially unidimensional model of the MACE-W2FE is retained across study samples and measurement formats using BSEM. The authors believed that much can be learned by first explicating the unidimensional model misfit for the MACE-W2FE found in the original sample and study by De Klerk (2013) - a model misfit that sent a clear signal for the adoption of alternative models in later studies (De Klerk et al., 2015; Koekemoer et al., 2017; Marais et al., 2014). The authors proceeded to replicate their findings on a second independent study sample that recently completed a different format of the MACE-W2FE.
Therefore, the main objective of this study was to test the essentially unidimensional model of the MACE-W2FE on two independent study samples and different measurement formats (blocked vs. random item ordering) using BSEM and local misspecification analysis. The authors strongly believed that the use of BSEM in explicating measurement model (mis)fit in CFA should significantly advance theory development in general, and in specifics for the MACE. The 'diagnostic evidence accompanying a model's failure to fit' has been used(p. 2) to determine the level and extent of misspecification in measurement models that represent theoretical constructs (Hayduk, et al., 2007, cited in Schaap, 2019).
In order to determine the extent to which the MACE-W2FE versions reflect a single latent variable for two study samples, the 'substantive-methodology synergy' (p. 14) approach, coined by Marsh and Hau (2007, cited in Schaap & Koekemoer, 2021) has been used. This approach involves applying innovative and high-precision statistical techniques (in particular, BSEM) to complex substantive issues in order to advance theory. The main contribution in this study is a synergy of the following substantive and methodological components: (1) to test the conceptual replicability of the essentially unidimensional model of the MACE-W2FE and (2) to demonstrate the usefulness of BSEM as an innovative and high precision statistical technique that goes beyond GOF indices in SEM.
In accordance with the substantive-methodology synergy approach, the substantive issues, namely the theoretical model that underlies the MACE-W2FE and related construct validity studies are first presented. This is followed by a theory on the methodological issues of model testing in SEM and the background to BSEM as a tool to investigate reasons for model misfit at a local parameter level.
Substantive issues
The construct WFE of Greenhaus and Powell (2006) are defined as:
[T]he extent to which a variety of resources from work and family roles have the capacity to encourage individuals and to provide positive experiences, which enhance the individuals' quality of life (performance and positive affect) in the other role (Schaap & Koekemoer, 2021, p 12).
The theory of role accumulation based on the work of Sieber (1974) is applied in WFE, where the positive experiences and outcomes of different roles are seen to enrich each other. Facets of WFE may include:
1. task and role related skills (e.g. problem-solving and multi-tasking skills)
2. psychological (e.g. positive self-esteem and tenacity), physical health and fitness resources
3. social capital resources (e.g. interpersonal relations and professional networking)
4. flexibility (e.g. scheduling, timing, pacing and location)
5. material resources (e.g. cash and donations accrued).
The argument is that when employees experience enrichment in either their work or family roles, they tend to reciprocate with more willingness to put an effort into these roles (Koekemoer et al., 2017). As a result, WFE is rapidly becoming a key focus for academics, organisations and human resource practitioners.
The bidirectional nature of WFE constructs allows for independent measures that can be applied concurrently or independently, depending on the direction of the relationship of interest (F2WE or W2FE). The MACE-WFE bidirectional MACE-F2WE and MACE-W2FE was developed by De Klerk et al. (2013). Multiple versions of the measure were produced during its development and every iteration refined the measure. This study focuses on the 18-item version of the MACE-W2FE component of the MACE-WFE, which has been used in numerous studies (De Klerk et al., 2015; Koekemoer et al., 2017, 2020; Marais et al., 2014).
The WFE theory of Greenhaus and Powell (2006) was represented in the MACE-W2FE as a first-order correlated 4-factor measurement model, consisting of the acquisition and refinement of distinct work role resources that improve an individual's quality of life within the family role. In this regard, the four work role resources were applied which include perspectives (P) (indicating the skills, perspectives and values at work for employees), affect (A) (relating to the self-concept, positive affect, energy levels and mental acuity of employees), time management (TM) (i.e.ability of employees to be flexible in their scheduling and timing of work) and social capital (S) (where employees maintain and support interpersonal relationships) as described in Koekemoer et al. (2017).
De Klerk et al. (2015) obtained good model fit (CFI = 0.97, Tucker-Lewis index [TLI] = 0.96 and RMSEA = 0.05) for the 4-factor 18-item version, and they report moderate to high correlation coefficients between factors, ranging between r = 0.54 and r = 0.63. The MACE-W2FE's four factors correlated significantly with work vigour (r = 0.26-0.39), job satisfaction (r = 0.29-0.43), career satisfaction (r = 0.26-0.41) and work dedication (r = 0.27-0.40). Well-fitting second-order models for the MACE-W2FE were found to display high correlations with subjective career success (r = 0.52), commitment (r = 0.55), work engagement (r = 0.50) and job satisfaction (r = 0.66) and confirm the criterion validity of the common factor that underlies group-specific factors (Koekemoer et al., 2017; Marais et al., 2014).
Greenhaus and Powell's (2006) theory of WFE conceptually supports the notion that WFE is 'an essentially unidimensional or broad construct that is informed by events and outcomes across the full spectrum of WFE resources' (Schaap & Koekemoer, 2021, p. 4). The high correlations among the MACE-W2FE subfactors (r = 0.54-0.64) and well-fitting second order model suggest that the WFE construct is probably hierarchical (in other words, high common variance underlies group-specific factors) (Schaap & Koekemoer, 2021). Consistent with Schaap and Koekemoer's (2021) study, the authors conceptualise the MACE-W2FE as a single substantive breadth factor (which is essentially unidimensional) that encompasses non-substantive narrow factors (group-specific dimensions) representing the four different resources of WFE (perspectives, affect, time management and social capital). If the assumption of strict unidimensionality (a narrow single latent variable) is not met, essential unidimensionality (a single latent variable with breadth) may be assumed, where the factor score is shown to be univocal with negligible biasing effects of the multidimensionality that is present in the item response data (Rodriguez et al., 2016).
Methodological issues
Studies suggest that different formats (e.g. item order) of a measure can cause systematic method effects in the data that result in a measurement model not replicating across studies (Loiacono & Wilson, 2020). Ordering items according to the construct measured (blocked item ordering) has shown the inclination to inflate reliability and bias construct validity statistics (e.g lower discriminate validity and higher factor loadings) and inflate systematic errors such as method biases (e.g. correlated residuals ascribed to similar item semantics or item adjacency) (Loiacono & Wilson, 2020; Wilson & Lankton, 2012). According to Lazarus (1966, 1993), the inflated statistics can be ascribed to respondents avoiding cognitive dissonance by responding in a conforming manner to items of the same construct that are in close proximation of each other through guessing or extrapolating the expected relationships (Loiacono & Wilson, 2020). Therefore, the use of the blocked item ordered version of the MACE-W2FE could inflate the factor loadings estimates, reliabilities, and increase correlated residuals in the factor models. Moreover, the random item ordering and the blocked item ordering versions of the MACE-W2FE could lead to different findings about the dimensionality of the measure and needed testing.
It is potentially dangerous to accept CFA models at face value using GoF indices without inspecting local indicator misspecifications (Greiff & Heene, 2017; Schaap, 2019). The CFA studies have shown that unidimensional measurement models containing numerous items are routinely rejected by GoF indices, because such models hardly ever describe the real data in social sciences (Bentler, 2009). Data in the social sciences have been reported to be fallible, and they therefore warrant more flexible approaches for effective evaluation of the plausibility of highly restrictive but more parsimonious measurement models (Asparouhov et al., 2015; Reis, 2017). In case a strict unidimensional model is rejected, as was reported for the MACE in the study by De Klerk (2013), researchers often accept the much less restricted multi-dimensional group-specific factor models that show good model fit, but fail to recognise that the group-specific factors may reflect a deceptive artefact or trivial substantive uniqueness (Rodriguez et al., 2016). Artefacts or pseudo-specific group factors that are characterised by narrow specifics blown into bloated specifics are difficult to detect without skilful factor analysis, and one may end up with a systematically biased measure (Cattell & Tsujioka, 1964). The multidimensional models of the MACE previously reported in various studies may have consisted of artefacts or pseudo-specific group factors despite showing good model fit (De Klerk et al., 2015; Koekemoer et al., 2017; Marais et al., 2014; Van Zyl, 2020). Moreover, Schaap and Koekemoer (2021) more recently found support for the notion in a study using extended SEM techniques and concluded the MACE should be regarded as an essentially unidimensional model despite the model fit indices showing a low model fit.
Thus, it can be concluded that where good model fit is obtained and appears to support the theory, researchers may still make erroneous conclusions about models. Clark and Bowles (2018) pointed out the importance of using supportive methods such as parallel analysis (Horn, 1965) and bifactor strength indices (Rodriguez et al., 2016) along with global fit indices in order to determine the dimensionality of a measure. In addition, Greiff and Heene (2017) emphasised the importance of doing local indicator misspecification analysis to explicate model (mis)fit.
The assumptions of unidimensionality and pure factors are rarely obtained from the questionnaire data that are so often used for research in the social sciences (Marsh et al., 2013). The assumption of unidimensionality in CFA models that assume zero misspecification (e.g. zero correlated residuals) is unrealistic and does not reflect substantive classical test theory, which allows for non-substantive deviation from zero, random error variance or 'white noise'. Correlated residuals are a major reason for model misspecification in CFA and need to be evaluated alongside GoF indices to avoid misleading or biased results (Sellbom & Tellegen, 2019). The BSEM is useful for evaluating local indicator misspecifications in CFA models such as correlated residuals to determine whether the data support a hypothesised model (Schaap, 2019). A nontechnical explanation of the rationality and value of BSEM relevant to this study is justified at this point.
Bayesian structural equation modelling uses Bayes' theorem in CFA plus prior information to:
'[P]arse out meaningful model misspecifications from small (ignorable) model misspecifications that can also be the cause of model rejections when such small misspecifications are in great number or the sample size is large'(Asparouhov & Muthén, 2017, p 2 as cited in Schaap, 2019).
Whereas the frequentist-based ML estimations in CFA ignore prior information for models tested (e.g. all correlated residuals are specified to be zero every time the model is tested), Bayes' estimations in CFA rely on prior information of what can be regarded as trivial model misspecifications (such as correlated residuals ranging from -0.20 to 0.20), and they use probability estimates to support or reject the assumption of triviality (Asparouhov et al., 2015). In BSEM, prior information from classical test theory is also used to specify small-variance priors or 'soft constraints' (such as correlated residuals between -0.20 and 0.20) (Liang, 2020, p.4). In BSEM, the product of the likely distribution of the sample data and simulated data from Monte Carlo simulations determines the probability that the parameter estimates (the posteriors) will be within the specified priors' variance range.
When the CFA model is run through the Bayes' estimator, all parameters that fall within the specified model are freed concurrently, allowing the evidence in the data - where such evidence exists - to drive the parameters away from zero (Asparouhov et al., 2015). The parameters that escape the small prior variances' settings are likely to be substantive and therefore improve model fit, calling for closer inspection of these parameters. All target factor loadings, or the free parameter estimates of a Bayes' CFA model, need to be estimated using noninformative priors (infinite variances from zero). Bayes' target factor loadings and error estimates closely represent ML estimates wherever zero misspecifications' priors apply (such as zero-correlated residuals) for moderate to large sample sizes (De Bondt & Van Petegem, 2015; Van de Schoot et al., 2014).
The BSEM allows for the effective parsing out of substantive misspecifications from trivial model misspecifications in a strict unidimensional CFA model by relaxing the untenable assumptions of zero model misspecification. Trivial model misspecifications are associated with an essentially unidimensional CFA model. Thus BSEM serves to diagnose misspecifications in conventional CFA models, rather than replacing CFA models (Asparouhov et al., 2015).
The BSEM's ability to concurrently free all small variance correlated residuals reduces chance effects and the risk of parameter misspecification, while sustaining model identification and successful convergence. If all correlated residuals are freed concurrently, it is not possible to use a ML estimator (Saris et al., 2009) for a CFA model, as it would lead to an unidentified model and thus to nonconvergence. Furthermore, the post hoc and sequential freeing of parameters, using modification indices and the ML estimator to study model fit, is susceptible to chance effects and a high risk of parameter misspecification (De Bondt & Van Petegem, 2015; Muthén & Asparouhov, 2012).
In this study, the authors seeked to test the tenable hypothesis that the data from two independent study samples support an essentially unidimensional measurement model for respectively a random and blocked item ordering format of the MACE-W2FE, using BSEM and local item misspecification analyses.
The authors hypothesised the following H1: the essentially unidimensional measurement model of the MACE-W2FE is supported by the data obtained from the two study samples and the different item ordering formats (random versus blocked) using BSEM.
Research design
Research approach
The authors used a quantitative research approach and cross-sectional survey data to test the essentially unidimensional model of the MACE-W2FE.
Research participants
The first convenience nonprobability study sample (N = 627) was South African employees from a wide range of industry sectors, namely agricultural, engineering, information technology (IT), manufacturing, services, finance, and education. Most of the sample consisted of Western Germanic language speakers (Afrikaans and English home or mother tongue language) (82%) of which 67% were female employees. In respect of qualifications, 4% did not obtain a National Senior Certificate, 30% had obtained a National Senior Certificate, 17% held a diploma, 45% possessed a degree or a postgraduate degree, and 3% did not report the qualification. The age of the sample ranged between 18 years and 74 years. Most of the respondents were in the age group of 24-33 years (36%), followed by the age group 34-43 years (24%).
The second convenience nonprobability study sample (N = 346) was drawn from six companies that are in the financial industry. The respondents represented diverse home language groups (African, Western Germanic, Asian) of which 63% were female employees. In respect of qualifications, 10% did not obtain a National Senior Certificate, 43% had obtained a National Senior Certificate, 15% held a diploma, 28% possessed a degree or a postgraduate degree and 10% did not report the qualification. The age of the sample ranged between 19 years and 65 years. The average age was 37.6 years, and the standard deviation was 9.6.
Measuring instruments
The 18-item version of the MACE-W2FE developed by De Klerk (2013) was used in the study. The items were presented in a random order (p2, a1, a3, sc1, tm1, p3, a2, sc2, tm2, p4, sc3, tm3, tm4, tm5, p5, p1, p6, tm6) for the original version used for Sample 1. The items were presented in a blocked order according to subscale or facet (p1, p2, p3, p4, p5, p6, a1, a2, a3, tm1, tm2, tm3, tm4, tm5, tm6, sc1, sc2, sc3) for Sample 2. The following original four subscales from De Klerk (2013) were used: work-family perspectives includes six items on skills gained by participants (e.g. 'My family life is improved by the viewpoints I have learned through my work'); work-family affect, includes three items on feelings gained (e.g. 'My family life is improved by my work that puts me in a good mood'); work-family time management, includes six items on time management (e.g. 'My family life is improved by using my time effectively at work') and work-family social capital, includes a three-item scale on the support that participants receive from colleagues (e.g. 'My family life is improved by having good relationships at work'). The authors used a four-point Likert-scale that ranged from 1 (strongly disagree) to 4 (strongly agree). Acceptable Cronbach's alpha coefficients were reported for the scales (De Klerk et al., 2015; Marais et al., 2014): work-family perspectives (0.91 and 0.94), work-family affect (0.84 and 0.95), work-family time management (0.90 and 0.91) and work-family social capital (0.80 - 0.87).
Research procedure and ethical considerations
The survey format for the two samples differed, however broad comparisons were possible to make on the biographical information. The gender groupings and age distribution were approximately the same for the samples, although qualifications levels were higher for Sample 1. Even though language group information was not elicited in the survey for Sample 2, it was safe to deduce that Sample 2 was more diverse than Sample 1 from prior knowledge of the employee demographics in the companies surveyed.
Field workers were used for data collection for Sample 1 and hard copies of the survey were distributed personally to the employees in each company. For Sample 2, an anonymous web-based survey link was distributed to the company employees with the assistance of the company's field workers. A response time of 3 weeks was applied. The participants were informed of the purpose of the survey and their consent was obtained. Participation in the research was voluntary. The research ethics committee of the relevant university approved the study.
Statistical analysis
In this study Mplus statistical software version 8 (Muthén & Muthén, Los Angeles, California, United States) (Muthén & Muthén, 2017) was used for all analyses. The authors adopted the Bayes' estimator in BSEM to test CFA models that were equivalent to ML-estimated models, but they included small variance priors for the correlated residuals to determine the substantiveness of parameter misspecifications at item level. In the BSEM analysis, the authors preserved the CFA model and allowed the evidence in the data to determine the plausibility of the measure, which contained minor impurities, or noise, that impacted the model fit. The BSEM analysis conducted in this study has previously been fully described by Asparouhov et al. (2015, pp. 1574-1577).
The BSEM fit assessments are calculated as the difference between the likely chi-square statistic for the observed sample data and the simulated data obtained from multiple draws from the posterior distribution of parameter values. In Mplus, the chi-square statistic is expressed as posterior predictive checking (PPc). The PPc of the observed data should match at least approximately 5% of the simulated data, on a 95% confidence interval (CI) where the difference between the observed and simulated data include the value of zero. The overlap or match is expressed as the posterior predictive p-value (PPp) and the optimal model fit is represented by a 50% match (PPp = 0.50) between the observed and simulated data and the zero positioned close to the centre of the interval.
However, because in this study the authors sought to evaluate misfit in the CFA models and not to obtain the optimal BSEM model, they adopted a PPp value slightly higher than 0.05. According to Asparouhov et al. (2015, p. 1566), 'the model slightly exceeding 0.05 would be the model of interest as it is considered the BSEM model closest to the CFA model that fits well (chi-square of p > 0.05) and resolves all the CFA model's misfits'. Simulation studies have shown that PPp cut-off values in the vicinity of 0.01, 0.05 and 0.10 for model fit appear to be reasonable (Muthén & Asparouhov, 2012).
In addition, the comparative fit index (CFI), Tucker-Lewis index (TLI) and the root mean square error of approximation (RMSEA) model fit index were used that were incorporated with the Bayes' estimator in the latest Mplus version 8.4 (Muthén & Muthén, 2019). Based on the CFI and TLI indices, model fit was considered acceptable when it exceeded 0.90 and good when it exceeded 0.95. The RMSEA values lower than 0.05 reflect a close fit and ones lower than 0.08 reflect a reasonably good fit to the data, in line with the recommendations of Hu and Bentler (1999) and Marsh et al. (2004). The authors used the scree-plot from a parallel analysis (Horn, 1965) in exploratory factor analysis with the ML estimator to verify the dimensionality of the measure.
Following the analysis routine stipulated by Schaap (2019), the authors started the local indicator misspecification analysis by including small variance correlated residuals in the models tested, as these are the largest source of potential model misspecification. Using the CFA model's diagonal residual covariance matrix (θ) as a basis, small variance priors were added to the residual correlates and allowed zero correlates to be converted to approximate zero correlates. Furthermore, the inverse Wishart prior θ~IW(Dd,d) for each parameter was calculated, where D is the residual from the CFA model tested and d is the degree(s) of freedom (detailed formulae are provided in Asparouhov et al., 2015, p. 5). A larger d is required for larger samples to maintain the same effect of the specified prior on the parameter estimation (Muthén & Asparouhov, 2012). When d increases, the prior variances on all correlated residuals will converge to zero, and the BSEM model produces a PPp of zero (PPp = 0), which is equivalent to a fully constrained CFA model. Therefore, the BSEM model is rejected, where the ML-estimated CFA model has a statistically significant chi-square value.
The authors performed a sensitivity analysis with four iterations, using different d values while monitoring model convergence, to obtain the required model as close as possible to PPp = 0.05, which resolves all model misfits. In other words, sensitivity analysis was carried out with a sequential increase of the constraints imposed on the correlated residuals through small variance prior settings, up to the point where all the model misspecifications were resolved (where PPp closely exceeds 0.05 and shows excellent model fit, e.g., CFI > 0.95, RMSEA < 0.05), while retaining a rapid convergence rate and the model structure. Statistically significant misspecifications below 0.20 on correlated residuals can be considered nonsubstantive. The lower the values (r < 0.15), the more they resemble random error or 'white noise' arising from indicator impurities. Values in excess of 0.20 should be considered as noteworthy in terms of substantive test theory, and values close to 0.30 should be regarded as important (Muthén & Asparouhov, 2012).
In addition, the deviance information criterion (DIC) index was used, which includes a model complexity penalty based on the number of estimated parameters, for selecting the preferred model (Asparouhov et al., 2015). As DIC does not penalise parameters fixed close to zero in calculating model complexity, the index is ideally suited to comparing BSEM models (Asparouhov et al., 2015). Lower DIC values signify the preferred model.
Similar to Schaap and Koekemoer's (2021) study, the authors used bifactor strength indices to evaluate the relative bias in the unidimensional model that can be ascribed to the correlated residuals (e.g. construct-relevant or irrelevant sources of variance) identified in the BSEM analysis. The indices used were coefficient alpha and omega reliabilities (McDonald, 1999), omega (ω), omega hierarchical (ωH and ωHS), explained common variance (ECV) (Sijtsma, 2009), the percentage of uncontaminated correlations (PUC), factor determinacy (FD) (Grice, 2001) and construct replicability (H) (Hancock & Mueller, 2001). The absolute average relative parameter bias (ARPB) index (Muthén et al., 1987) and at item level ARPB-I were used to assess bias on the factor loadings that are attributed to construct-relevant or -irrelevant sources of variance. A detailed explanation of the various indices has previously been given by Rodriguez et al. (2016).
In the BSEM analyses, four independent Markov chain Monte Carlo (MCMC) chains and a Gibbs sampler we used. The authors assessed model convergence using the potential scale reduction (the PSR value) factor diagnostic statistic and by visually inspecting the trends on the parameter trace and density plots. The PSR values that are below or close to 1.05 indicates convergence. In all the models tested, we used 50 000 iterations and thinning = 2 (thinning = 2 × 50 000) were used to ensure that 100 000 iterations and convergence were reached while reducing the burden on computer processing and storage capacity, as recommended by Link and Eaton (2012).
Ethical considerations
Ethical clearance to conduct this study was obtained from the North-West University Economic and Management Sciences Research Ethics Committee. (ref. no. NWU-00425-18-S4).
Results
Descriptive statistics showed that the average score for all items for the two samples was 2.72 (2.91) and the average score for the subscales varied between 2.60 (2.63) and 2.85 (3.13) (please note the values in brackets are for Sample 2). The mean standard deviation for the items was 0.82 (0.92) and it varied between 0.76 (0.83) and 0.91 (1.01). The mean item skewness was −0.40 (−0.79) and it varied between −0.24 (−0.25) and 0.55 (−1.19). The mean item kurtosis was −0.23 (0.45) and it varied between 0.14 (1.54) and -0.71 (−0.64). The normal distribution was approximated (skewness and kurtosis between −1 and +1) for both samples.
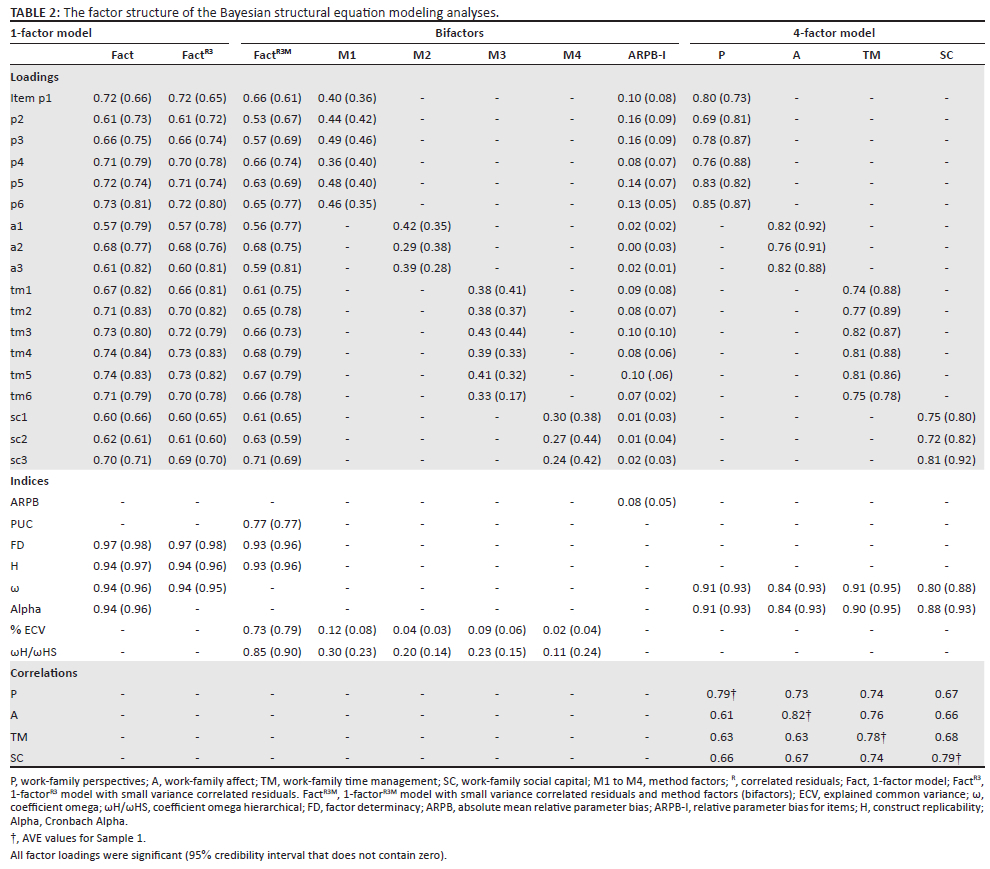
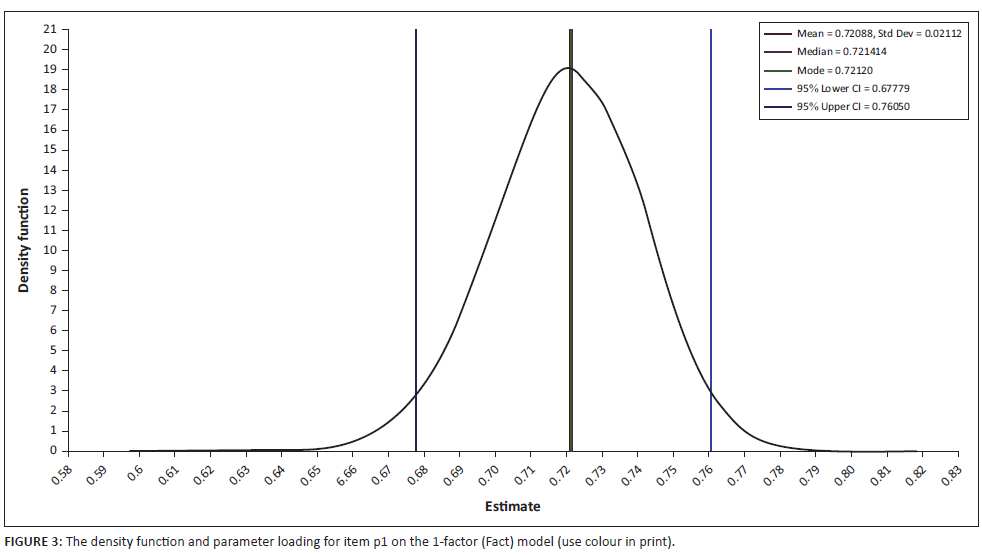
The results of the BSEM analysis for both samples are presented in Table 1 and Table 2 for each of the models tested (see Figure 1 for the models). All the analyses converged sufficiently, as all the PSR values were below 1.05, and visual inspections of the density and parameter trace plots indicated sufficient convergence for all parameters. An example of good convergence (item p1 factor loading for the 1-factor model in Table 2) is reflected on the parameter trace plot shown in Figure 2. The trace plots of the four chains displayed clear mixing. Figure 3 provides an example of good convergence, as can be clearly seen in the density plot, which shows a smooth normal distribution for item p1 factor loading for the 1-factor model.
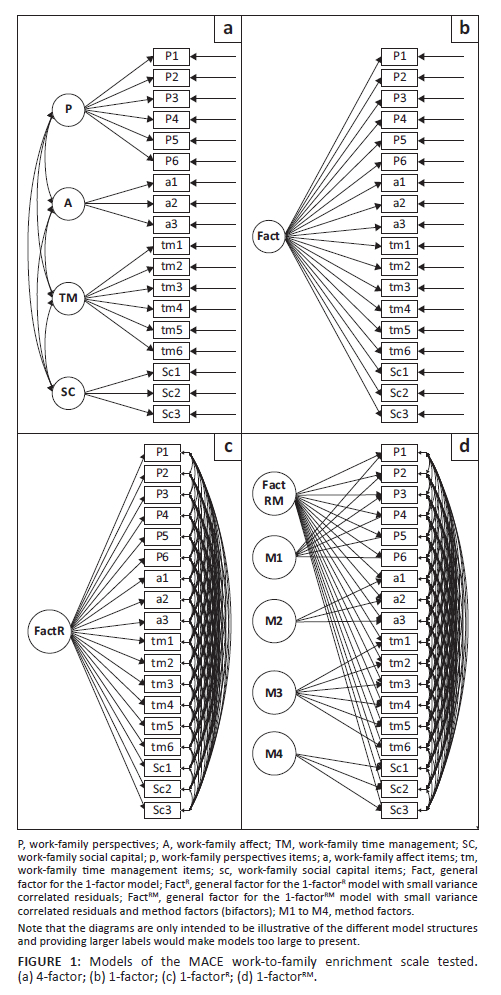
All the models tested in this study are depicted in Figure 1.
Firstly the results of Sample 1, are discussed. The CFA results for the 4-factor model proposed by De Klerk et al. (2013) presented in Table 1 suggest good model fit (CFI = 0.96, TLI = 0.95, RMSEA = 0.06) and a well-defined factor structure (see Table 2). In addition, the omega reliabilities (Sample 1: 0.80 - 0.91; Sample 2: 0.88 - 0.95) are high for all the subscales in the 4-factor model, showing acceptable factor uniqueness according to the average variance extracted (AVE) criterion (Fornell & Larcker, 1981). In Table 2, AVE values for Sample 1 are on the diagonal of the correlation matrix. Sample 1's intercorrelations between factors are shown below the diagonal and Sample 2's intercorrelations are above the diagonal. At face value, a multidimensional model appears to be supported by the data. This makes theoretical sense and would probably be readily accepted in a peer-reviewed publication without attracting much criticism. However, a more incisive analyst - one who understands the hierarchal nature of psychological measurement models, the limitations of global fit indices and the meaning of the common variance underlying the group-specific factors - would investigate the likelihood of an essentially unidimensional model as an alternative to the 4-factor model. The parallel analysis for Sample 1 showed that the data best represented a unidimensional model (with a single dominant eigenvalue = 8.8) or a weakly defined 2-factor model (with a second eigen value = 1.69, which marginally exceeds the eigenvalue of 1.30 [95% CI] of the random data set) (see Figure 4). However, there is no theoretical justification for a 2-factor model, which leaves us with the unidimensional model as the only model likely to be supported by the data. The parallel analysis conducted on Sample 2 resulted in the same findings. Unfortunately, despite the well-defined factor structure of the 1-factor model (Sample1: λ = 0.57 - 0.74, Mean λ = 0.68 and Sample 2: λ = 0.61 - 0.84; Mean λ = 0.76) for the two samples the global model fit indices results suggest that the model has to be rejected (see Table 1, 1-factor). An explication of the 1-factor model misfit was therefore called for and the analysis results in this regard are presented in Table 1 and Table 2.
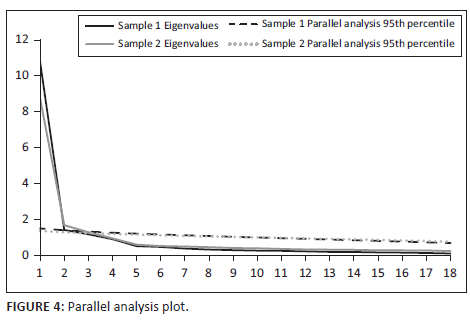
Table 1 shows the model fit results of four of the 1-factor models (R1, R2, R3, R4) used in the BSEM sensitivity analysis, where only the small variance priors set for the correlated residuals varied in size. The four models showed trivial differences on the GoFs, factor loadings and correlated residuals for Sample 1. The model with the PPp value slightly exceeding 0.05 was the model of choice (1-factorR3) in which all substantive misfit in the conventional CFA model was resolved. The model displayed a negative 95% PP lower limit (PP limit = −15.01), which in a frequentist paradigm implies a good fit (i.e χ2 > p = 0.05, RMSEA = 0.04, CFI = 0.99, TLI = 0.98). The model converged rapidly and was adequately identified, as required of a CFA model. The sensitivity analysis procedure was repeated for Sample 2 and the results of the model of choice (1-factorR3) could be considered close to being the same as for Sample 1. The model converged rapidly and was adequately identified, as required of a CFA model. The four models showed trivial differences on the GoFs, factor loadings and correlated residuals.
Firstly, the results (not in the brackets) for Sample 1 (the results in brackets are for Sample 2) will be discussed in detail. The factor structure for the 1-factorR3 model (FactR3) depicted in Table 2 is well defined (λ = 0.57 - 0.73; Mean λ = 0.67) and notably similar (ARPB = 0.01) to the conventional 1-factor CFA model (Fact) (λ = 0.57 - 0.74; Mean λ = 0.68). The ARPB for a factor must be below 0.10 to 0.15 to be considered nonsubstantive or of little concern (Muthén et al., 1987). Figure 5 shows that 15% (23/153) of substantive correlated residuals were close to or exceeded 0.20. These signify residual variance that was not taken up in the main construct and may point to the presence of interpretable multidimensional constructs that were not modelled or nuisance factors such as parallel wording (verbatim repetitions, synonyms and similar sentence structure).
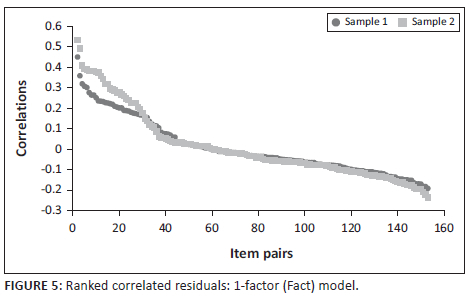
Most of the substantive correlated residuals were among items within each subscale and could be clarified with further inspection (only two substantive correlated residuals, p6 with tm3 (r = −0.19) and p6 with tm1 (r = −0.20), were observed on items across subscales). The most important correlated residuals exceeding 0.30 were a1 with a3 (r = 0.45), p1 with p6 (r = 0.36), a1 with a2 (r = 0.30), p5 with p6 (r = 0.32) and p3 with p5 (r = 0.31). Interestingly, all the correlates close to or exceeding 0.20 displayed strong evidence of parallel wording or item redundancy (e.g. a1: 'My family life is improved by my work that puts me in a good mood' versus a2: 'My family life is improved by my work that makes me feel happy'; p3: 'My family life is improved by my work that helps me to understand different viewpoints' versus p5: 'My family life is improved by my work showing me different perspectives'. The existence of method artefacts among synonymously worded items was prevalent and consequently modelled as method factors where there were substantive correlated residuals. More specifically, all items from a subscale that correlated substantively (r = 0.20) with at least one other item from the same subscale, were included in the method factor. When dealing with method artefacts, Morin et al. (2016) recommends the use of method factors that explicitly estimate construct-irrelevant sources of variance as opposed to correlated residuals which simply partials them out.
The BSEM model fit indices for the 1-factorR3M model (FactR3M) that included both correlated residuals and methods factors are reported in Table 1. The method factors (M1 - M4) were partial out from the common factor in FactR3M and effectively represent a bi-factor model with small variance correlated residuals (Rodriguez et al., 2016) (See Figure 1d). The model showed a negative 95% PP lower limit (PP limit = −15.01) and good global model fit (PPp = 0.05, RMSEA = 0.04, CFI = 0.99, TLI = 0.98), suggesting that the reasons for model misfit had been resolved. The model converged rapidly and was identified. The factor structure for FactR3M is provided in Table 2 and represents a well-defined factor (λ = 0.53 - 0.71; M = 0.63). The absolute relative differences in factor loadings (ARPB = 0.08) between models Fact and FactR3M are small, with items p2, p3 and p5 contributing most to the difference in factor loadings in the factor structures (ARPB-I; p2 = 0.16, p3 = 0.16, p5 = 0.14). These three items display a unique but trivial substantive element of the MACE-W2FE. Fact and FactR3M has essentially a similar factor structure and differences in factor scores should be negligible (Rodriguez et al., 2016).
Figure 6 shows only 1.3% (2/153) substantive correlated residuals close to or exceeding 0.20. The highest is 0.30, suggesting that local indicator misspecifications have largely been resolved with the inclusion of method factors in FactR3M. The ECV (0.73) and PUC (0.77) exceeded 0.70 and ωH exceeded 0.80, suggesting that the relative bias in FactR3M is slight and can be regarded as an essentially unidimensional model (Rodriguez et al., 2016, p 232). The omega HS suggests highly reliable variance for the substantive general factor (FactR3M ωH = 0.85) but not for the method factors (ωHS; M1 = 0.30, M2 = 0.20, M3 = 0.23, M4 = 0.11). The method factors (M1, M2, M3, M4) can be considered nonsubstantive, as the ωHS values were below 0.50 and there were very low ECV values (0.12, 0.04, 0.09, 0.02) (Rodriguez et al., 2016). The factor determinacy coefficient (FD = 0.97) and the H measure of construct reliability (H = 0.94) proved to be high (> 0.90) for the Fact model, suggesting that the manifest scale scores (e.g. item aggregates) closely represent the latent variable scores (Rodriguez et al., 2016).
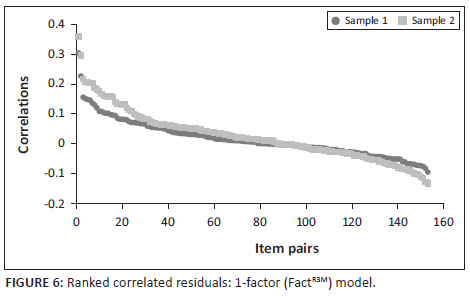
The statistical results of Sample 2 are provided in Table 2. The results (provided in the brackets) follow the same pattern as was obtained in Sample 1 but showed a more pronounced 1-factor model (Fact) and a general factor (FactR3M) in the methods bifactor model. The low ARPB (0.05) and high ECV (0.79), PUC (0.77) and ωH (0.90) values suggested that the relative bias in Fact is small and can be regarded as a purer essentially unidimensional model (Rodriguez et al., 2016, p 232) when compared with Sample 1's random ordered items. The substantive correlated residuals (18% = 27/153) were all among items within each subscale and were slightly more pronounced (see Figure 5) for Sample 2 and replicated the method factors (M1, M2, M3, M4) identified in Sample 1. Figure 6 shows only 3.3% (5/153) substantive correlated residuals close to or exceeding 0.20 for the FactR3M model, suggesting that the local misspecifications identified in the FactR3 model had largely been resolved. The method factors can be considered nonsubstantive, as the ωHS values (M1 = 0.23, M2 = 0.14, M3 = 0.15, M4 = 0.24) were well below 0.50 and there were very low ECV values (0.08, 0.03, 0.06, 0.04) (Rodriguez et al., 2016). The factor determinacy coefficient (FD = 0.98) and the H measure of construct reliability (H = 0.97) proved to be high (> 0.90) for the Fact model, suggesting that the manifest scale scores (e.g. item aggregates) closely represent the latent variable scores (Rodriguez et al., 2016).
Overall, there was sufficient support for hypothesis H1: the essentially unidimensional measurement model of the MACE-W2FE is supported by the data obtained from both the study samples and the different item ordering formats (random versus blocked) after explicating the model misfit obtained for a strict unidimensional model using BSEM. Both the random item version of the MACE-W2FE and the blocked item version of the MACE-W2FE showed support for an essentially unidimensional measurement model. However, the blocked item version of the MACE-W2FE showed more pronounced parameter estimates and could be ascribed to the inflationary effects of respondents avoiding cognitive dissonance by responding in a conforming manner to items of the same construct that are in close proximation of each other (Loiacono & Wilson, 2020). The overall common variance across items was higher for Sample 2 resulting in a less biased unidimensional model. The authors acknowledge that sampling variations between studies may have also impacted the results. Irrespective of the observed differences in the statistics, the overall findings for the two versions of the MACE-W2FE can be considered conceptually similar and will be further discussed as such going forward.
Discussion
Outline of the results
This study corroborates the finding of Schaap and Koekemoer (2021) that the MACE-W2FE can be conceptualised as an essentially unidimensional measurement model. The conceptual replication of the MACE-W2FE's breath factor across samples, measurement formats and statistical theorems is supported. The methodical-substantive synergetic approach used in this study to test the conceptual replicability of the theoretically supported essentially unidimensional measurement model of the MACE-W2FE proved to be valuable. More details on the substantive and methodological arguments and findings are supplied next.
Substantive arguments and findings
The 'WFE can be understood as a general experience directed by particular events or outcomes [across the full range of WFE resources]' (Schaap & Koekemoer, 2021, p 12). The MACE-W2FE appears to best represent an essentially unidimensional WFE construct for the blocked and random item order versions of the measure that includes trivial elements of multidimensionality, subscale item redundancy and white noise across samples. Subdomain redundancy or bloated specifics commonly occur in published scales - the problem arises when test authors run out of unique questions for specific subscales that form part of a broader construct (Rodriguez et al., 2016). Moreover, participants respond conceptually to related items at a general and specific level, which gives rise to an essentially unidimensional factor structure that incorporates elements of multidimensionality (strong communality among items that underlie group-specific uniqueness).
According to Gustafsson and Alberg-Bengtsson (2010), the more items in the model the more dominant the common variance become and the more meaningful the interpretation. As depicted in FactR3M of this study, the multiple item MACE-W2FE reflects a perfectly interpretable common variable regardless of the multidimensionality caused by group-specific factors, method artefacts (e.g. item redundancies) or noise. Rodriguez et al. (2016) argued in favour of adopting an essentially unidimensional model supported by a sound theory (such as WFE) wherever justified. Measures of broader constructs where multiple domains of construct relevant item content are included increases construct representativeness and ultimately construct validity (Reise, 2012).
Slocum-Gori and Zumbo (2011) made a strong case for regarding quality of life measures as essentially unidimensional - inherently tapping multiple minor domains. Corroborating the evidence from Schaap and Koekemoer's (2021) study, there was no evidence that the MACE-W2FE consists of related but distinct group-specific factors that represent substantively unique subdomains of WFE resources.
Methodological arguments and findings
Methodologically based evidence from this study suggests that the rejection of the highly constrained 1-factor model (Fact) based on the GoF index results alone would have been unwarranted without a further investigation of the local indicator misfit. The global model misfit obtained can be attributed to the cumulative effect of local indicator misfit, which can be ascribed to a combination of minor substantive elements, method artefacts and insignificant random errors or white noise. It was found that the identified random correlated residuals and method artefacts in the 1-factor model had a negligible effect on factor structure and the interpretation of the 1-factor CFA model. Overall, this analysis showed that the 4-factor model was deceptive in showing a good model fit and well-defined 4-factor structure which corroborates the findings of Schaap and Koekemoer (2021). The parallel analyses and local indicator misfit analysis revealed that the 4-factor model was actually the product of shared common variance between all the items in the measure and the differentiating effect of method artefacts as opposed to substantively meaningful subscales. Moreover, accepting the GoF index results in measurement model testing without doing local indicator misfit analysis can lead to questionable published SEMS and raise questions about the theories they are based on (Greiff & Heene, 2017; Ropovik, 2015).
Study contribution
This study contributes to the field of WFE by providing a sound basis and support for WFE as an essentially unidimensional construct for future research. Using local indicator misspecification analysis in BSEM, the authors have effectively determined that the sources of GoF misfit for the strictly unidimensional model were trivial and of little consequence. This research enables one to understand the dimensionality and intricacies and the MACE-W2FE and the supporting WFE theory better, which enhances the validity of inferences made from the scale scores. The methodological-substantive synergies obtained in this study are likely to have an impact on WFE theory development and will hopefully guide approaches to future WFE measurement model testing, including the WFES of Carlson et al. (2006).
Practical implications
Despite the weak GoF indices, treating the MACE-W2FE as a single latent variable should have few practical implications in terms of regression estimates in SEM models. The use of essentially unidimensional models in studies with external variables has a practical advantage over complex bifactor and second-order models that are prone to identification problems (Zhang et al., 2020). Moreover, Schaap and Koekemoer (2021) demonstrated that the second-order factor model of the MACE-W2FE should be interpreted with caution because the proportionality constraints in the model had been violated. However, the weak GoF indices of the MACE-W2FE measurement model may reflect negatively on a SEM model's GoF where the focus is on the reflective or causal relationship between latent or manifest variables. Therefore, it is recommended that researchers consider incorporating aggregated MACE-W2FE scores in SEM studies, because the FD and H values for the Fact model proved to be high (> 0.90), suggesting that the manifest scale scores closely represent the latent variable scores (Rodriguez et al., 2016). Therefore, bias in regression path coefficients in SEM models with factor scores from the MACE-W2FE unidimensional measurement model should be negligible (Reise et al., 2013a; Rodriguez et al., 2016).
Moreover, researchers may consider more sophisticated approaches of including the MACE-W2FE in SEM models such as generating weighted scale scores using the maximum a posteriori method as implemented by Mplus (MAP) and the Bartlett method (McNeish & Wolf, 2020). Subsequently, Croon's (2002) correction can be implemented in Lavaan on the saved MAP and Bartlett scores that yield unbiased estimates and serves as a proxy for latent variables. Moreover, plausible values that accurately reflect latent variables as implemented in MPlus can be used in SEM path models without having to simultaneously estimate the full measurement model (Asparouhov & Muthén, 2010).
Limitations and recommendations
The study could have benefitted from more inclusive and larger study samples in respect of representativeness (demographics) of the broader international community to improve the generalisability of the findings. However, the demographic representation of the study samples (strongly skewed in favour of white women) is similar to that in previous studies carried out on the MACE-W2FE, which reduces the effect of sampling fluctuations on the measurement models reported. Furthermore, it is recommended the MACE-W2FE items be reviewed for redundancy. Ongoing validity research would benefit the future use of the scale.
Conclusion
The authors conclude that the call for more vigilance in model testing and less reliance on 'golden rules' for model fit seems to be justified for the MACE-W2FE, and for WFE theory development in general. Model-fit indices are not sufficiently reliable in evaluating the plausibility of essentially unidimensional models and should be complemented with local indicator misspecification analyses techniques to ensure that the model is replicable. More specifically, the authors urge researchers to be vigilant about accepting multidimensional models without doing local indicator misspecification analysis for the danger of such models consisting of pseudo-factors or bloated specifics with little theoretical meaning.
Acknowledgements
Competing interests
The authors declare that they have no financial or personal relationships that may have inappropriately influenced them in writing this article.
Authors' contributions
P.S. conceptualised the article and contributed to the literature review, methodology, formal analyses, results and discussion section. E.K. contributed to data collection, literature review, reviewing and refining the article. M.B. contributed to data collection, original research on the MACE, reviewing and refining the article.
Funding information
This research received no specific grant from any funding agency in the public, commercial or not-for-profit sectors.
Data availability
The data that support the findings of this study are available from the corresponding author, P.S., upon reasonable request.
Disclaimer
The views and opinions expressed in this article are those of the authors and do not necessarily reflect the official policy or position of any affiliated agency of the authors.
References
Asparouhov, T., & Muthén, B. (2010). Plausible values for latent variables using Mplus. Mplus technical report. Retrieved from http://www.statmodel.com/download/Plausible.pd [ Links ]
Asparouhov, T., & Muthén, B. (2017). Prior-posterior predictive p-values. Retrieved from https://www.statmodel.com/download/PPPP.pd [ Links ]
Asparouhov, T., & Muthén, B. (2019). Advances in Bayesian model fit evaluation for structural equation models. Retrieved from http://www.statmodel.com/download/BayesFit.pdf [ Links ]
Asparouhov, T., Muthén, B., & Morin, A.J.S. (2015). Bayesian structural equation modeling with cross-loadings and residual covariances. Journal of Management, 41(6), 1561-1577. https://doi.org/10.1177/0149206315591075 [ Links ]
Bentler, P.M. (2009). Alpha, dimension-free, and model-based internal consistency reliability. Psychometrika, 74(1), 137-143. https://doi.org/10.1007/s11336-008-9100-1 [ Links ]
Brown, T.A. (2006). Confirmatory factor analyses for applied research. Guilford Press. [ Links ]
Carlson, D.S., Kacmar, K.M., Wayne, J.H., & Grzywacz, J.G. (2006). Measuring the positive side of the work-family interface: Development and validation of a work-family enrichment scale. Journal of Vocational Behavior, 68(1), 131-164. https://doi.org/10.1016/j.jvb.2005.02.002 [ Links ]
Cattell, R.B., & Tsujioka, B. (1964). The importance of factor-trueness and validity, versus homogeneity and orthogonality, in test scales. Educational and Psychological Measurement, 24(1), 3-30. https://doi.org/doi:10.1177/001316446402400101 [ Links ]
Clark, D.A., & Bowles, R.P. (2018). Model fit and item factor analysis: Overfactoring, underfactoring, and a program to guide interpretation. Multivariate Behavioral Research, 53(4), 544-558. https://doi.org/10.1080/00273171.2018.1461058 [ Links ]
Croon, M. (2002). Using predicted latent scores in general latent structure models. In G. Marcoulides & I. Moustaki (Eds.), Latent variable and latent structure modeling (pp. 195-223). Lawrence Erlbaum. [ Links ]
De Bondt, N., & Van Petegem, P. (2015). Psychometric evaluation of the overexcitability questionnaire-two applying Bayesian Structural Equation Modeling (BSEM) and multiple-group BSEM-based alignment with approximate measurement invariance. Frontiers in Psychology, 6, 1963. https://doi.org/10.3389/fpsyg.2015.01963 [ Links ]
De Klerk, M. (2013). Work-family enrichment: Development, validation and application of a new instrument within the South African context (North-West University, South Africa). Retrieved from https://repository.nwu.ac.za/handle/10394/11537 [ Links ]
De Klerk, M., Nel, J.A., & Koekemoer, E. (2015). Work-to-family enrichment: Influences of work resources, work engagement and satisfaction among employees within the South African context. Journal of Psychology in Africa, 25(6), 537-546. https://doi.org/10.1080/14330237.2015.1124606 [ Links ]
De Klerk, M., Nel, J.A., Hill, C., & Koekemoer, E. (2013). The development of the MACE work-family enrichment instrument. South African Journal of Industrial Psychology, 39(2), 1-16. https://doi.org/10.4102/sajip.v39i2.1147 [ Links ]
Fornell, C., & Larcker, D.F. (1981). Evaluating structural equation models with unobservable variables and measurement error. Journal of Marketing Research, 18(1), 39-50. https://doi.org/10.2307/3151312 [ Links ]
Greenhaus, J.H., & Powell, G.N. (2006). When work and family are allies: A theory of work-family enrichment. Academy of Management Review, 31(1), 77-92. https://doi.org/10.5465/AMR.2006.19379625 [ Links ]
Greiff, S., & Heene, M. (2017). Why psychological assessment needs to start worrying about model fit. European Journal of Psychological Assessment, 33(5), 313-317. https://doi.org/10.1027/1015-5759/a000450 [ Links ]
Grice, J.W. (2001). Computing and evaluating factor scores. Psychological Methods, 6(4), 430-450. https://doi.org/10.1037/1082-989x.6.4.430 [ Links ]
Gustafsson, J.-E., & Alberg-Bengtsson, L. (2010). Unidimensionality and interpretability of psychological instruments. In S.E. Embretson (Ed.), Measuring psychological constructs: Advances in model-based approaches (pp. 97-121). American Psychological Association. [ Links ]
Hancock, G.R., & Mueller, R.O. (2001). Rethinking construct reliability within latent variable systems. In R. Cudeck, S. Du Toit, & D. Sörbom (Eds.), Structural equation modeling: Present and future - A Festschrift in Honor of Karl Joreskog (pp. 195-216). Scientific Software International. Retrieved from https://www.amazon.com/Structural-Equation-Modeling-Present-Future/dp/0894980491 [ Links ]
Hayduk, L.A. (2014). Seeing perfectly fitting factor models that are causally misspecified: Understanding that close-fitting models can be worse. Educational and Psychological Measurement, 74(6), 905-926. https://doi.org/10.1177/0013164414527449 [ Links ]
Hayduk, L.A., Cummings, G., Boadu, K., Pazderka-Robinson, H., & Boulianne, S. (2007). Testing! testing! one, two, three - Testing the theory in structural equation models! Personality and Individual Differences, 42(5), 841-850. https://doi.org/10.1016/j.paid.2006.10.001 [ Links ]
Horn, J.L. (1965). A rationale and test for the number of factors in factor analysis. Psychometrika, 30(2), 179-185. https://doi.org/10.1007/BF02289447 [ Links ]
Hu, L., & Bentler, P.M. (1999). Cutoff criteria for fit indexes in covariance structure analysis: Conventional criteria versus new alternatives. Structural Equation Modeling, 6(1), 37-41. https://doi.org/10.1080/10705519909540118 [ Links ]
Jackson, D.L., Gillaspy, J.A., & Purc-Stephenson, R. (2009). Reporting practices in confirmatory factor analysis: An overview and some recommendations. Psychological Methods, 14(1), 6-23. https://doi.org/10.1037/a0014694 [ Links ]
Koekemoer, E., Olckers, C., & Nel, C. (2020). Work-family enrichment, job satisfaction, and work engagement: The mediating role of subjective career success. Australian Journal of Psychology, 72(4), 1-12. https://doi.org/10.1111/ajpy.12290 [ Links ]
Koekemoer, E., Strasheim, A., & Cross, R. (2017). The influence of simultaneous interference and enrichment in work-family interaction on work-related outcomes. South African Journal of Psychology, 47(3), 330-343. https://doi.org/10.1177/0081246316682631 [ Links ]
Lazarus, R.S. (1966). Psychological stress and the coping process. McGraw-Hill. [ Links ]
Lazarus, R.S. (1993). Why we should think of stress as a subset of emotion. In L. Goldberger & S. Breznitz (Eds.), Handbook of stress: Theoretical and clinical aspects (2nd ed) (pp. 21-39). Free Press. [ Links ]
Liang, X. (2020). Prior Sensitivity in Bayesian Structural Equation Modeling for Sparse Factor Loading Structures. Educational a nd Psychological Measurement, 80(6), 1025-1058. https://doi.org/10.1177/0013164420906449 [ Links ]
Link, W.A., & Eaton, M.J. (2012). On thinning of chains in MCMC. Methods in Ecology and Evolution, 3(1), 112-115. https://doi.org/10.1111/j.2041-210X.2011.00131.x [ Links ]
Loiacono, E., & Wilson, E.V. (2020). Do we truly sacrifice truth for simplicity: Comparing complete individual randomization and semi-randomized approaches to survey administration. AIS Transactions on Human-Computer Interaction, 12(2), 45-69. https://doi.org/10.17705/1thci.00128 [ Links ]
Marais, E., De Klerk, M., Nel, J.A., & De Beer, L. (2014). The antecedents and outcomes of work-family enrichment amongst female workers. SA Journal of Industrial Psychology, 40(1), 1-14. https://doi.org/10.4102/sajip.v40i1.1186 [ Links ]
Marsh, H.W., & Hau, K.-T. (2007). Applications of latent-variable models in educational psychology: The need for methodological-substantive synergies. Contemporary Educational Psychology, 32(1), 151-170. https://doi.org/10.1016/j.cedpsych.2006.10.008 [ Links ]
Marsh, H.W., Hau, K.-T., & Wen, Z. (2004). In search of golden rules: Comment on hypothesis-testing approaches to setting cutoff values for fit indexes and dangers in overgeneralizing Hu and Bentler's (1999) findings. Structural Equation Modeling: A Multidisciplinary Journal, 11(3), 320-341. https://doi.org/10.1207/s15328007sem1103_2 [ Links ]
Marsh, H.W., Lüdtke, O., Nagengast, B., Morin, A.J.S., & Von Davier, M. (2013). Why item parcels are (almost) never appropriate: Two wrongs do not make a right-camouflaging misspecification with item parcels in CFA models. Psychological Methods, 18(3), 257-284. https://doi.org/10.1037/a0032773 [ Links ]
McDonald, R.P. (1999). Test theory: A unified treatment. Erlbaum. [ Links ]
McNeish, D., & Hancock, G.R. (2018). The thorny relation between measurement quality and fit index cut-offs in latent variable models. Journal of Personality Assessment, 100(1), 43-52. https://doi.org/10.1080/00223891.2017.1281286 [ Links ]
McNeish, D., & Wolf, M.G. (2020). Thinking twice about sum scores. Behavior Research Methods, 52(6), 2287-2305. https://doi.org/10.3758/s13428-020-01398-0 [ Links ]
Morin, A.J.S., Katrin Arens, A., & Marsh, H.W. (2016). A bifactor exploratory structural equation modeling framework for the identification of distinct sources of construct-relevant psychometric multidimensionality. Structural Equation Modeling, 23(1), 116-139. https://doi.org/10.1080/10705511.2014.961800 [ Links ]
Muthén, B., & Asparouhov, T. (2012). Bayesian structural equation modeling: A more flexible representation of substantive theory. Psychological Methods, 17(3), 313-335. https://doi.org/10.1037/a0026802 [ Links ]
Muthén, B., Kaplan, D., & Hollis, M. (1987). On structural equation modeling with data that are not missing completely at random. Psychometrika, 52(3), 431-462. https://doi.org/10.1007/BF02294365 [ Links ]
Muthén, L.K., & Muthén, B. (2017). Mplus user's guide (8th edn). Muthén & Muthén. [ Links ]
Reis, D. (2017). Further insights into the German version of the Multidimensional Assessment of Interoceptive Awareness (MAIA). European Journal of Psychological Assessment, 35(3), 1-9. https://doi.org/10.1027/1015-5759/a000404 [ Links ]
Reise, S.P. (2012). The rediscovery of bifactor measurement models. Multivariate Behavioral Research, 47(5), 667-696. https://doi.org/10.1080/00273171.2012.715555 [ Links ]
Reise, S.P., Bonifay, W.E., & Haviland, M.G. (2013). Scoring and modeling psychological measures in the presence of multidimensionality. Journal of Personality Assessment, 95(2), 129-140. https://doi.org/10.1080/00223891.2012.725437 [ Links ]
Reise, S.P., Moore, T.M., & Haviland, M.G. (2010). Bifactor models and rotations: Exploring the extent to which multidimensional data yield univocal scale scores. Journal of Personality Assessment, 92(6), 544-559. https://doi.org/10.1080/00223891.2010.496477 [ Links ]
Reise, S.P., Scheines, R., Widaman, K.F., & Haviland, M.G. (2013). Multidimensionality and structural coefficient bias in structural equation modeling: A bifactor perspective. Educational and Psychological Measurement, 73(1), 5-26. https://doi.org/10.1177/0013164412449831 [ Links ]
Rodriguez, A., Reise, S.P., & Haviland, M.G. (2016). Applying bifactor statistical indices in the evaluation of psychological measures. Journal of Personality Assessment, 98(3), 223-237. https://doi.org/10.1080/00223891.2015.1089249 [ Links ]
Ropovik, I. (2015). A cautionary note on testing latent variable models. Frontiers in Psychology, 6, 1715. https://doi.org/10.3389/fpsyg.2015.01715 [ Links ]
Saris, W.E., Satorra, A., & Van der Veld, W.M. (2009). Testing structural equation models or detection of misspecifications? Structural Equation Modeling: A Multidisciplinary Journal, 16(4), 561-582. https://doi.org/10.1080/10705510903203433 [ Links ]
Schaap, P. (2019). Explicating the South African Psychological Ownership Questionnaire's confirmatory factor analysis model fit: A Bayesian structural equation modelling approach. SA Journal of Industrial Psychology/SA Tydskrif vir Bedryfsielkunde, 45(1), a1643. https://doi.org/10.4102/sajip.v45i0.1643 [ Links ]
Schaap, P., & Koekemoer, E. (2021). Determining the dimensionality and gender invariance of the MACE work-to-family enrichment scale using bifactor and approximate invariance tests. SA Journal of Industrial Psychology, 47, 1-16. https://doi.org/10.4102/sajip.v47i0.1821 [ Links ]
Sellbom, M., & Tellegen, A. (2019). Factor analysis in psychological assessment research: Common pitfalls and recommendations. Psychological Assessment, 31(12), 1428-1441. https://doi.org/10.1037/pas0000623 [ Links ]
Sieber, S.D. (1974). Toward a theory of role accumulation. American Sociological Review, 39(4), 567-578. https://doi.org/10.2307/2094422 [ Links ]
Sijtsma, K. (2009). On the use, the misuse, and the very limited usefulness of Cronbach's Alpha. Psychometrika, 74(1), 107-120. https://doi.org/10.1007/s11336-008-9101-0 [ Links ]
Slocum-Gori, S.L., & Zumbo, B.D. (2011). Assessing the unidimensionality of psychological scales: Using multiple criteria from factor analysis. Social Indicators Research, 102(3), 443-461. https://doi.org/10.1007/s11205-010-9682-8 [ Links ]
Van de Schoot, R., Kaplan, D., Denissen, J., Asendorpf, J.B., Neyer, F.J., & Van Aken, M.A.G. (2014). A gentle introduction to Bayesian analysis: Applications to developmental research. Child Development, 85(3), 842-860. https://doi.org/10.1111/cdev.12169 [ Links ]
Van Zyl, P. (2020). The development and empirical evaluation of a structural model of enrichment among female academics. Stellenbosch University. Retrieved from http://scholar.sun.ac.za/handle/10019.1/108212 [ Links ]
Wilson, E.V., & Lankton, N.K. (2012). Some unfortunate consequences of non-randomized, grouped-item survey administration in IS research. Proceedings of the 2012 International Conference on Information Systems (pp. 1-16). [ Links ]
Zhang, B., Sun, T., Cao, M., & Drasgow, F. (2020). Using bifactor models to examine the predictive validity of hierarchical constructs: Pros, cons, and solutions. Organizational Research Methods, 24(3), 530-571. https://doi.org/10.1177/1094428120915522 [ Links ]
Zwaan, R.A., Etz, A., Lucas, R.E., & Donnellan, M.B. (2017). Making replication mainstream. Behavioral and Brain Sciences, 41, e120. https://doi.org/10.1017/S0140525X17001972 [ Links ]
 Correspondence:
Pieter Schaap
pieter.schaap@up.ac.za
Received: 14 Oct. 2021
Accepted: 05 Aug. 2022
Published: 31 Oct. 2022

