


Services on Demand
Article
 English (pdf)
 Article in xml format
 Article references
Indicators

Related links
-
 Cited by Google
 -
 Similars in Google
Share

 Permalink
SAIEE Africa Research Journal
On-line version ISSN 1991-1696
Print version ISSN 0038-2221
SAIEE ARJ vol.113 n.3 Observatory, Johannesburg Sep. 2022
A New Method to Distinguish between Nearby and Direct Lightning Strikes for Long Operational Medium Voltage Lines
Willem J. Dirkse van SchalkwykI; Chandima GomesII; John M. van CollerIII
IMember, SAIEE; Eskom Holdings SOC Ltd, Bloemfontein, Free State, South Africa (e-mail: vschalwj@eskom.co.za)
IIFellow, SAIEE; University of the Witwatersrand, Johannesburg, Gauteng, South Africa (e-mail John.VanColler@wits.ac.za)
IIIMember, SAIEE; University of the Witwatersrand, Johannesburg, Gauteng, South Africa (e-mail: chandima.gomes@wits.ac.za)
ABSTRACT
Lightning strikes near Medium Voltage (MV) electricity distribution lines cause voltage transients to be induced onto the conductors of the power lines. The resultant Lightning Induced Overvoltage (LIOV) on the phase conductors may be estimated using computer models or measurements. Models and measurements are mostly limited to short floating lines to simplify calculations and to ensure accurate results that can be easily compared between different models. Existing measurement methods cannot be used to distinguish between nearby lightning and direct lightning strikes to an operational MV network by using only one instrument on a line that is more than 100 km long. The instrument needs to be less than a hundred meters from where the LIOV amplitude on the line is the highest. The new method described in this paper allows one to distinguish between nearby and direct lightning strikes to the line; by comparing the polarity of the current transient recorded at the substation to the lightning return-stroke polarity obtained from a lightning detection network. The new method also allows one to determine whether the LIOV of a particular lightning transient exceeded the Basic Insulation Level (BIL) of the line, by observing the power frequency fault current. The new method was applied to an operational 714 km network operating at 22 kV, and the results were compared with predictions in IEEE Std 1410-2010. Significantly fewer line faults due to nearby lightning were observed than predicted; the reason for this is explained.
Index Terms: Basic Insulation Level (BIL), lightning coupling model, line lightning performance, line flashover rate, Lightning Induced Overvoltage (LIOV), Lightning Generated Current (LGC), Lightning Detection Network (LDN).
I. Introduction
Asignificant number of flashovers can be experienced on an MV line due to LlOVs caused by nearby lightning, especially if the line BIL is low and the soil resistivity is high [1]. Line faults during a lightning storm can be due to direct lightning strikes to the line, nearby lightning and other elements in the lightning storm such as moisture and wind. The line faults in each of these categories required different mitigation interventions.
Numerous lightning channel models [2] [3] and lightning coupling models that describe the electromagnetic coupling between the lightning channel and the line are available. The main purpose of these models is to calculate the LIOV on the line at the position closest to the earth-termination point of nearby lightning, i.e., where the amplitude is normally the highest. The second purpose is to calculate the LIOV along a short line. The models break the line and lightning channel into small sections (dipoles) and then calculate the coupling between each section of the lightning channel and the line. The total LIOV on each section of the line is then calculated. Data needed for the model includes the lightning channel tortuosity, the distance between the lightning channel and the line, the changing soil properties and other line parameters that are generally difficult to obtain. Line lengths that were used for comparing models and measurements were a few hundred meters. The method cannot be reliably applied to long operational lines. Results from these models were published in the IEEE Std 1410-2010 [4] in a format that can be used to estimate the lightning performance of long operational lines. The accuracy of these models for long operational lines was not verified by measurement.
The polarity of the LIOV has the same polarity as the return-stroke current for direct lightning strikes to the line and, due to the finite soil conductivity, the opposite polarity for nearby lightning (this applies for the LIOV measured further than 250 m from the nearby lightning earth-termination point). This can be used to distinguish between direct lightning strikes to the line and nearby lightning. The charge that is transferred from the cloud to the line by the return-stroke generates a LIOV as well as a LGC on the line. The LGC, which is a common-mode current on the MV line, is more reliable and easily distinguishable in the measured data than the LIOV. The polarity of the LGC measured at the feeder substation was therefore used for comparison with the return-stroke current polarity captured by the LDN. A power frequency fault current would indicate whether the amplitude of the LIOV exceeded the BIL of the line, and hence whether a line flashover resulted. The LGC polarity was therefore used to determine whether the lightning was nearby lightning or whether it was a direct strike to the line, and the presence of power frequency fault current was used to determine whether the LIOV amplitude exceeded the BIL of the line. The limitation of this method is that the feeder substation measurement point needs to be further than 250 m from the nearby lightning channel earth-termination point.
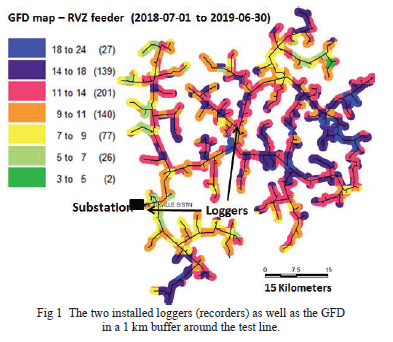
The research reported in this paper was done on a 714 km unshielded overhead distribution network operating at 22 kV in the Free State Province of the Republic of South Africa. The 714 km includes branches of the network. There were 234 pole-mounted transformers (each one fitted with surge arresters) connected to the MV line. The average lightning Ground Flash Density (GFD) was 11.9 flashes/km2/year during the year that the measurements were made. The average soil resistivity along the line was approximately 300 Ω-m. The terrain consisted mostly of flat grasslands. A continuous-sampling logger (recorder) was installed at the feeder substation where the voltage and common-mode current were recorded. A similar logger was installed in the middle of the line as a reference - see Fig 1. Both these loggers had a 400 kHz sampling frequency, were GPS time-stamped and the time correlation between the logger data and the LDN data was within 10 ms.
Section II shows the results of previous research to distinguish between nearby and direct lightning strikes to operational lines. Section III describes the methodology and procedures followed in the research. The results will then be analyzed, normalized and compared to the IEEE Std 14102010.
II. Previous work performed to distinguish between nearby lightning and direct lightning strikes to an MV line
A. Previous Research
Much work has been performed by several researchers to study the LIOV amplitude due to nearby lightning for MV lines. The two methods that are normally used are measurements [5] and computational models. These provided results for short floating lines (< 2.8 km). The LIOV was measured as close as possible to the nearby lightning earth-termination point since the LIOV waveform gets attenuated and distorted as it propagates along the line.
The models [6] [7] require an accurate estimate of the distance between the line and the earth-termination point. The earth-termination point was determined by either a camera triggered by the lightning [8] or the GPS coordinates of a rocket launcher [9] that triggered the lightning. Some information such as the lightning return-stroke peak current amplitude can be obtained from the LDN. The soil properties that affect the LIOV amplitude and polarity are mostly unknown and make modelling difficult [10]. The lightning channel properties and tortuosity are also needed in the lightning coupling models. These parameters are generally not known and are approximated by lightning channel models [2].
The lightning performance of a 15 kV operational line in Italy was measured over one year [11]. The circuit breaker operations were linked to LDN lightning data. LIOV-EMTP was used to compute the LIOV on the line due to the identified nearby lightning that could possibly cause a line flashover. Three different methods were proposed to correlate the LIOVs that caused line flashovers with lightning strikes which revealed three significantly different results. The data was also not in a format to compare with the estimated (using the IEEE Std 1410-2010 method) lightning performance of the line.
Research done by the Council for Scientific and Industrial Research (CSIR) in South Africa [12] used a camera to determine the nearby lightning earth-termination point and stated that the polarity of the LIOV will be opposite to the lightning return-stroke current polarity for nearby lightning and the same polarity for direct lightning strikes to the line. At that time no details about the lightning return-stroke peak current or polarity were known.
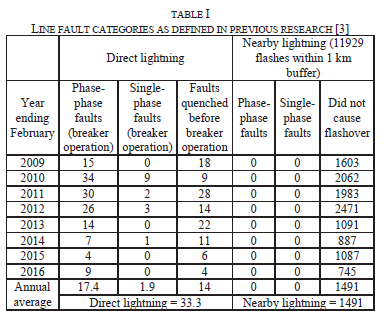
Similar research was done on a 156 km line built with a 300 kV BIL [13]. The insulators had a 170 kV BIL and were in series with a wood-gap to increase the line BIL to 300 kV, but poles with stay wires reduced the actual line BIL. It is important to note that no flashover due to nearby lightning was recorded over the eight-year measurement period. The results of the eight-year measurement period are shown in Table I below. The line faults were categorized in a format that distinguish whether it was caused by nearby lightning or direct lightning strikes to the line.
The IEEE Std 1410-2010 [4] is a guide for the prediction of the number of faults per year for different BILs due to nearby lightning and direct lightning strikes to the line. The predictions are based on the predicted flashover rate of a floating conductor - which is the worst-case scenario. The effect of surge arresters, soil resistivity [14], conductor height and earthing configurations are also shown. However, the predicted lightning performance due to nearby lightning and direct lightning strikes to a long operational line has never been verified with actual measurements.
III. Methods and procedures
Previous research could determine the LIOV amplitude and polarity by either measurement or calculation on short floating lines. simulation inputs needed included the BIL of the line, soil resistivity, distance between the nearby lightning earth-termination point and the line as well as the lightning flash information (from the LDN). These had to be known or assumed for the long operational line that was used for the research.
The cost and effort to install loggers (recorders) and cameras along a long operational line of several 100 km (including branches) to distinguish between nearby lightning and direct lightning strikes to the line as well as to measure the LIOV amplitudes are high. A new method had to be formulated to distinguish reliably between nearby lightning and direct lightning strikes to the line as well as to determine whether the BIL of the line was exceeded.
A. Method to distinguish between nearby lightning and direct lightning strikes to the line
Most LIOV waveforms are bipolar [15] (i.e. they consist of both positive and negative half-cycles), but for this research the polarity of the first half-cycle of the LIOV oscillation was of interest. A direct lightning strike to the line will cause a LIOV (that can be several megavolts in magnitude [16]) and a LGC measured at the feeder substation, both of which have the same polarity as the lightning return-stroke current. If nearby lightning is closer than 60 m to a 10 m high conductor, the lightning is assumed to terminate on the line and hence is considered to be a direct lightning strike to the line according to IEEE Std 1410-2010. The transient magnetic field generated by nearby lightning generates an electric field that can be resolved into a horizontal electric field component and a vertical electric field component for modelling purposes. The vertical and horizontal electrical field components induce voltages and currents with the same polarity as the lightning return-stroke current if the soil conductivity is infinite. If the soil conductivity is finite, the current through the soil generates a horizontal electric field component of opposite polarity to the lightning return-stroke current and this becomes dominant after about 250 m along the line. Measurements and calculations of the polarity of the LIOV and LGC further than 250 m from the nearby lightning earth-termination point showed that the induced voltage and current on the line are of opposite polarity to the nearby lightning return-stroke current.
The Alternative Electromagnetic Transient Program (ATP-EMTP) lightning model [17] based on the Transmission Line (TL) return-stroke model [18] and the Agrawal model [19] estimates the LIOV amplitude and polarity accurately up to 3 km from the nearby lightning earth-termination point. This model was then extended to include part of a long operational line. However, for this research only the polarity of the LIOV and LGC were of interest.
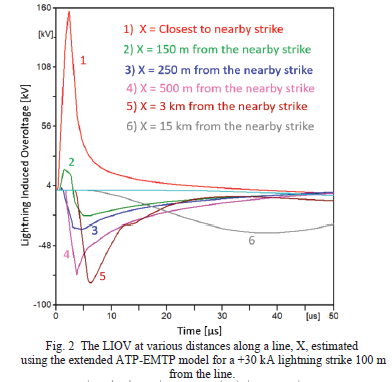
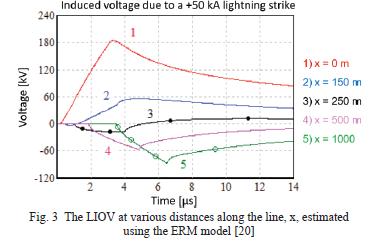
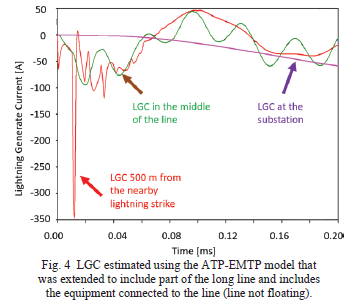
Fig. 2 shows a simulation of a 15 km line using the ATP-EMTP model, without any equipment associated with an operational line. The first curve (red) shows the LIOV on the section of line closest to the nearby lightning strike earth-termination point. Curves 2 to 6 show the LIOV amplitude and polarity along the line between 150 m and 15 km from the section of line closest to the nearby lighting strike earth-termination point. It was noticed that at distances beyond 250 m the LIOV on the line changed polarity. This agrees with simulations done with the Extended Rusck Model (ERM) [20] as shown in Fig. 3 as well as with the LIOV-ATP model [21]. These polarity changes were also confirmed by measurements [22] [5]. Fig. 4 shows a simulation using the ATP-EMTP model that was extended with part of the line having equipment associated with an operational line. Oscillations can be seen on the LGC close to the nearby lightning, but although the LGC was attenuated and distorted the polarity of the LGC was still of opposite polarity to the lightning return-stroke current at more than 250 m from the earth-termination point of the nearby lightning strike.
It can be concluded that nearby lightning will cause a LIOV and LGC on the line with opposite polarity compared to the nearby lightning return-stroke current. This same behavior can also be seen in calculations performed by Leal et al [23] and measurements performed by Yokoyama et al [5]. Only one nearby lightning event in the research presented in this paper was closer than 250 m from the feeder substation where the measurements were made.
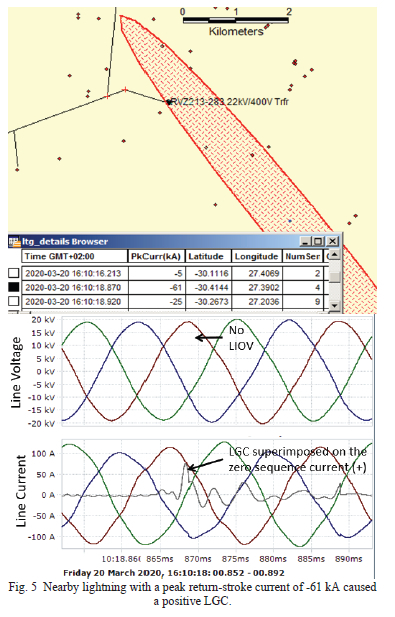
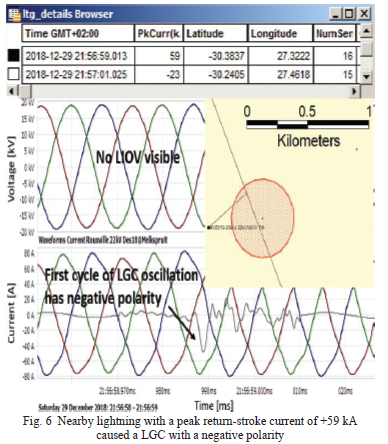
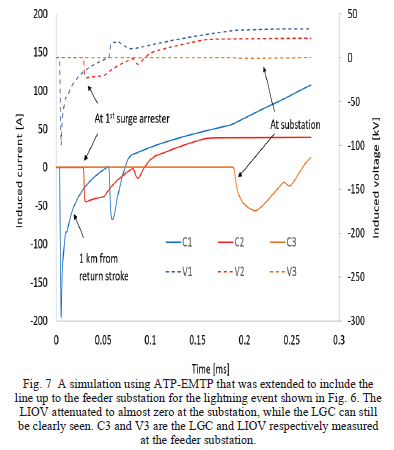
The line's surge impedance was 350 Ω. For a direct lightning strike, a lightning return-stroke current in excess of 1714 A is expected to cause the LIOV to exceed a line BIL of 300 kV. The LIOV and LGC of a negative nearby lightning return stroke current (-61 kA in Fig. 5) and positive nearby lightning return-stroke current (+59 kA in Fig. 6) were measured at the feeder substation. In both cases the LIOV was attenuated to a point where it was not visible. In contrast, the LGC was clearly visible and was of opposite polarity to the nearby lightning return-stroke current. A simulation of the +59 kA nearby lightning event using the ATP-EMTP model (that was extended to include the line up to the feeder substation) confirmed the observation that the LIOV attenuated to almost zero while the LGC was clearly visible at the feeder substation (compare Fig. 6 to Fig. 7)
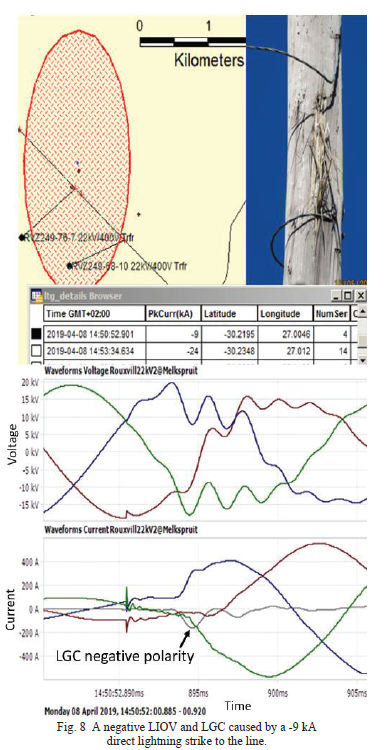
Lightning terminating 60 m from the line with a peak return-stroke current of -9 kA would have caused a LIOV of less than 69 kV and would not have caused flashover on a line with a BIL larger than 150 kV. Fig. 8 shows that the - 9 kA lightning event caused a line flashover and can therefore be classified as a direct lightning strike to the line. For this case the LGC had the same polarity as the lightning return-stroke polarity.
The geographical inaccuracy [24] of the LDN was too large to determine whether the LIOV due to nearby lightning exceeded the line BIL. However, it is a clear indication that the line BIL was exceeded if the LGC was followed by a power frequency fault current.
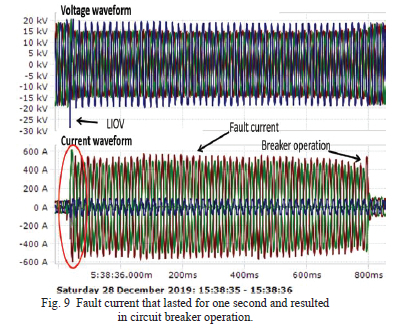
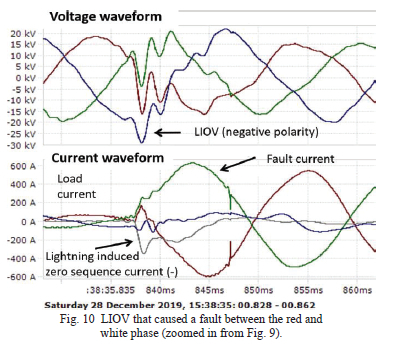
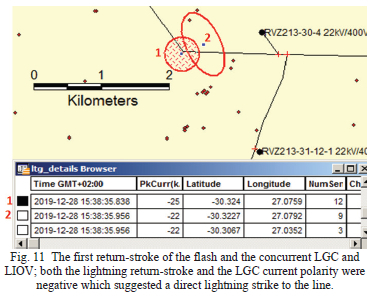
Fig. 9 shows a typical example of a recording of the fault current and the breaker operation. Fig. 10 zooms into where the LIOV caused an insulation failure and resulted in a 50 Hz fault current between the white and red phases. The polarity of both the LIOV and the LGC was negative. The polarity of the lightning return-stroke current (shown in Fig. 11) was also negative, which indicates a direct lightning strike to the line. This direct lightning strike caused a phase-phase fault, resulting in a circuit breaker operation and was tabled in the yellow block in Table III.
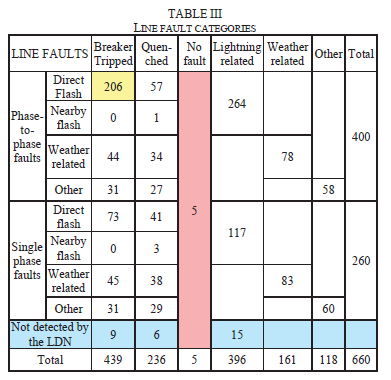
The first stroke in the flash that caused a line flashover was used to represent the lightning return-stroke current polarity and clasification (nearby or direct). should the LDN not detect this stroke, the complete flash was classified as "not detected by the LDN" because the polarity of the return-stroke current of this undetected lightning strike was not known (the blue line in Table III).
A. Measurement method
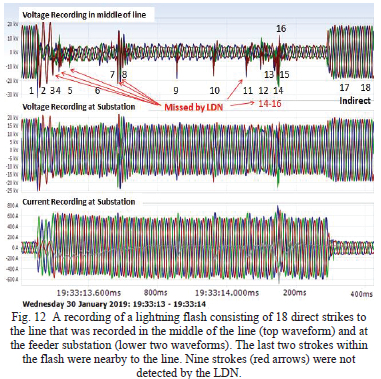
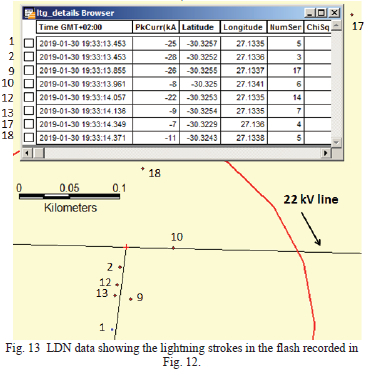
A logger that sampled continuously at 400 kHz was installed at the feeder substation. The power frequency voltages and currents were measured, as well as the LIOVs and LGCs. The common-mode LGCs were calculated using the three phase currents. The recordings were GPS time-stamped and the time correlation with the LDN was within 10 ms. Each recorded lightning event could be correlated with the particular lightning stroke within a flash, as shown in Fig. 12 and Fig. 13.
The logger was configured to vary the sampling rate according to the rate of change in the voltage and current. The logger would then increase the sampling rate to a maximum of 400 kHz only when lightning activity (high frequency current and voltage components) was present.
B. The actual BIL of an MV line
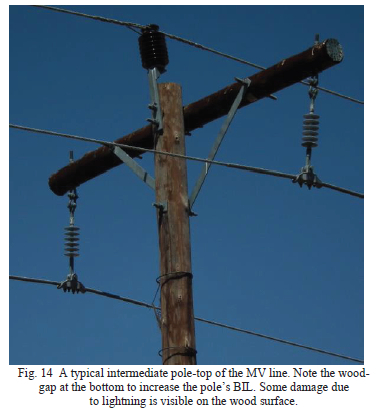
It is necessary to determine the actual BIL of the line for comparison with the IEEE Std 1410-2010 data. Many MV lines have a BIL that varies along the line. The BIL at mid-span to earth is normally larger than 1 MV. Depending on the insulation coordination philosophy adopted, the insulation level at the poles varies between that of the insulator only (on a fully bonded and earthed pole) and several MV for a fully insulated wood pole structure. The line in this research had 150 kV BIL insulators and was mostly built according to a 300 kV BIL insulation coordination philosophy. Fig. 14 shows a typical intermediate pole-top with a 300 kV BIL. At poles where equipment was installed and where stays were attached to the poles (strainer poles), the effective BIL of the line dropped to that of the insulator only (150 kV).
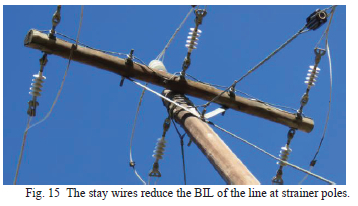
Stays were installed at least every kilometer on the line, lowering the line BIL to 150 kV at these poles. An example is shown in Fig. 15. A LIOV with sufficient amplitude would cause a line flashover at this point even if the nearby lightning was closer to a pole further away with a 300 kV BIL. The highest actual BIL in the section between the strainer poles was simulated using ATP and was found to be 176 kV and 206 kV with a surge arrester far away (4 km) and nearby (700 m) respectively. The effective BIL in the middle of the section was about 300 kV if there were surge arresters at the strainer poles.
For the purpose of this research, each nearby lightning event that caused a line flashover (insulation failure) was investigated and the BIL at that point was calculated. The complete line was divided into sections and an average BIL for the line was calculated to be 165 kV.
The recorded LIOVs and LGCs were compared to the LDN data. For a match (within 10 ms) between the recordings and the LDN data, the polarity of the return-stroke current, the LIOV and the LGC were used to classify the lightning event as either nearby lightning or a direct lightning strike to the line. If a fault occurred during a lightning storm, but was not due to lightning, the fault was classified as a weather-related fault. In this case the fault was likely due to moisture or wind that caused an insulation failure. Faults that occurred outside the lightning storm was classified as "other".
Each fault was classified as a phase-earth fault, as a phasephase fault or - if it turned out that way - to be a "no fault". Lastly the faults were categorized as either being cleared by circuit breaker operation or being quenched before circuit breaker operation. The BIL of the line was verified in cases where a fault occurred due to nearby lightning and in cases where a direct lightning strike to the line did not cause an insulation failure.
IV. Lightning statistics
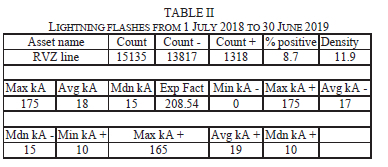
The measurements were performed between 1 July 2018 and 30 June 2019. Lightning details during this period as captured by the LDN are shown in Table II. A total of 15 135 lightning flashes (45 861 lightning strokes) that terminated within 1 km from the line were recorded by the LDN. The average lightning ground flash density was 11.9 flashes/km2/year. More information on the lightning flashes over the one-year period is shown in Table II.
V. Results
A. Measurements
The lightning performance of the line was worse than predicted by the IEEE Std. 1410-2010. There were 89 thunder days, which caused a total of 381 lightning-related insulation failures. These resulted in only 279 circuit breaker operations, with the remaining 102 flashovers resulting in arc quenching before circuit breaker operation could occur. This underestimates the number of lightning-related insulation failures if protection operation was compared with the LDN data to identify the lightning-related faults [11]. There were 264 three-phase lightning-related faults and 117 single-phase lightning-related faults, which differ with [25] and [26] that estimated that between 50% and 80% of the faults would be single-phase faults. Table III shows that a large number of faults were due to direct lightning strikes to the line that tend to cause three-phase faults.
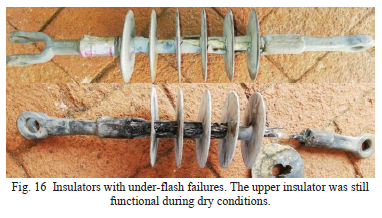
There were only four nearby lightning events that caused a line flashover. This finding agrees with [12] that measured a maximum LIOV amplitude of 160 kV and 40 kV for a floating line and an operational line with surge arresters installed, respectively, and estimated that flashovers due to nearby lightning for operational MV lines are rare. The flashover between phases occurred in a section where the line BIL was 162 kV while the single phase to earth flashovers occurred where the line BIL was 165 kV, 189 kV and 150 kV respectively. Previous research [13] where no faults due to nearby lightning were recorded was performed on a new line, while in this research the RVZ line was more than 30 years old, such that the age-degraded insulators could cause faults for nearby lightning. Insulators as shown in Fig. 16 that failed due to under-flashes were found in the vicinity of these four cases.
Five direct lightning strikes to the line (red block in Table III) did not result in any insulation failure. This was due to surge arresters very close to the lightning stroke termination point. This was also experienced by [27].
There were fifteen lightning flashes where the LDN did not detect the first strokes that caused a line flashover, these recordings were ignored (blue row in Table III). A total of 24% of the faults that occurred during lightning storms were not due to lightning, but postulated to be due to other elements within the storm such as wind and moisture. Other faults accounted for 118 events (17.6%)
VI. Comparison between the above measurements and IEEE Std. 1410-2010 data.
A. Faults caused by nearby lightning
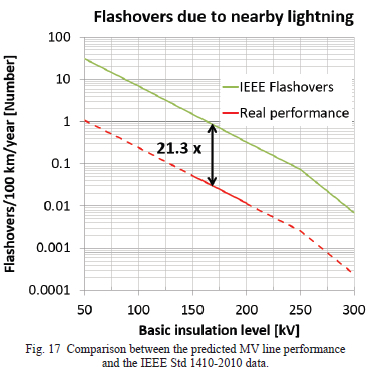
The main purpose of this research was to find a way to distinguish between nearby lightning and direct lightning strikes to a line and hence to determine the line's performance due to nearby lightning. The result was then compared with the IEEE Std 1410-2010 data for the estimated number of line flashovers. Measured flashovers due to nearby lightning were normalized to a ground-flash density of 1 ground-flash/km2/year for comparison with the IEEE Std 1410-2010 data for a soil resistivity of a 100 Ω-m. A total of four line flashovers due to nearby lightning were measured while the IEEE data estimated 85 flashovers for this 714 km line with a 166 kV BIL and lightning ground-flash density of 11.9 ground-flashes/km2/year.
According to the IEEE Std 1410-2010, surge arresters will decrease the number of faults due to nearby lightning if surge arresters are closer than 600 m from each other. The average surge arrester spacing on the RVZ line was 3051 m. The general effect of surge arresters was therefore neglected, it was only considered for determining the actual BIL of the line. The comparison could only be done between 150 kV BIL and 200 kV BIL due to the line BIL limitations. Fig. 17 shows that the number of flashovers/100 km/year during the research period on the operational line was 21.3 times less than predicted by the IEEE Std 1410-2010 data for a floating line.
B. Faults caused by direct lightning strikes to the line
According to IEEE Std 1410-2010 data [4], 99% of the direct lightning strikes to the line will cause a flashover. This agrees with this research, that showed a 98.7% flashover rate due to direct lightning strikes to the line. The estimated number (N) of direct lightning flashes to the line can be calculated from the lightning ground-flash density (Ng), the line height (h) and line width (b):
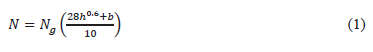
The number of direct lightning flashes to the line was predicted using Equation (1) and was found to be 135 direct flashes/100 km/year, while the measured number of direct lightning flashes (381 to a 714 km line) was 53 flashes/100 km/year. A further fifteen lightning events that appeared to be direct flashes to the line were recorded but were ignored as they could not be confirmed by the LDN (the LDN did not detect these lightning flashes). A methodology that used circuit breaker operation [11] to identify faults could have missed 98 faults due to direct lightning flashes to the line because of faults that quenched before circuit breaker operation.
In general, it can be concluded that the line attracted fewer direct lightning strikes to the line than predicted.
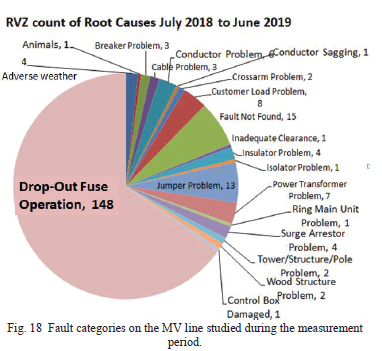
C. Permanent fault categories on the line
Fig. 18 shows the different permanent fault categories that caused outages on the MV line. Maintenance staff reported that 80% of equipment failures were experienced during lightning storms.
VII. Recommendations
The lightning performance of other operational MV lines could be determined using the new method described in this research. A large difference between the estimated and actual performance of the operational line for nearby lightning was found. It is important to measure the actual lightning performance of operational MV lines, as atmospheric and environmental conditions may cause significant lightning performance deviation from predictions.
The floating-conductor scenario to estimate the nearby lightning performance of operational MV lines could introduce a large overestimation of the number of line flashovers due to nearby lightning along an operational line. This may lead to a line BIL overdesign. A higher BIL would cause higher stresses on equipment attached to the line due to a higher LIOV amplitude.
Insulators and surge arresters should be monitored, as their condition can compromise the line's lightning performance significantly - up to 24% in this case.
The research showed that the effective BIL of the line was reduced by equipment and stays. MV line designers need to take this into account when they estimate the nearby lightning performance of the line.
As 58% of the flashovers and about 80% of the equipment failures were due to lightning, more attention should be given to designs that protect the line and equipment against lightning. Equipment failures can be reduced if the surge amplitudes due to direct lightning strikes to the line are limited by flashover from the line directly to earth instead of through wood, fuses or surge arresters.
VIII. Summary
Existing methods give only a rough estimate of the lightning performance for long operational MV lines. Some LIOV measurements have been made on operational MV lines [11], but they could not determine the LIOV reliably and were not in a format for comparison with the computed estimations [4]. A new methodology has been developed to distinguish reliably between nearby lightning and direct lightning strikes to long operational lines. The predicted lightning performance of future operational lines is required for insulation design purposes.
The finite soil conductivity that made modeling of the LIOV difficult, was used to simplify the classification of lightning events as either nearby lightning or a direct lightning strike to the line. This eliminates the need for a large number of cameras to distinguish between nearby and direct lightning.
The new method makes it possible to measure the lightning performance of a long operational MV line without accurate information about the lightning return-stroke channel, the line properties, the distance of the lightning earth-termination point from the line, variable soil resistivity and environmental conditions.
This method revealed that the IEEE Std 1410-2010 data for a floating conductor overestimates the number of flashovers due to nearby lightning and the number of flashovers due to direct lightning strikes to long operational lines. For this method, the instrument installation cost was low and few resources were required to conduct the research.
Acknowledgement
Authors would like to thank ESKOM Power Plant Engineering Institute (EPPEI-HVAC) for the financial support and research data and also the School of Electrical and Information Engineering, University of the Witwatersrand, for the research facilities.
References
[1] A. Piantini, A. Borghetti and C. A. Nucci, Lightning Interaction with Mediumm-Voltage Overhead Power Distribution Systems. In: Piantini, A(ed.) Lightning Interaction With Power Systems Volume 2, London: IET Press, 2020, pp. 113-172.
[2] C. A. Nucci and F. Rachidi, "Panel discussion "Distribution Lightning Protection", slides 6 to 11," in IEE 99 T&D Conference, New Orleans, April 1999.
[3] J. D. Schoene, Direct and Nearby Lightning Strike Interaction with Test Power Distribution Lines, Florida: University of Florida, 2007. [ Links ]
[4] IEEE Std 1410 - 2010, "IEEE Guide for Improving the Lightning Performance of Electric Power Overhead Distribution lines," IEEE, 2010.
[5] S. Yokoyama, K. Miyaki, H. Mitani and N. Yamazaki, "Advanced obrservations of Lightning Induced Voltages of Power Distribution Lines," IEEE Transactions of Power Systems, Vols. PWRD-1, no. 1, pp. 129-137, April 1986.
[6] A. Piantini, "Extension of the Rusck Model for Calculating Lightning-Induced Voltages on Overhead Lines Considering the Soil Electrical Parameters," IEEE Transaction on Electromagnetic Compatibility, vol. 59, no. 1, pp. 154-161, February 2017.
[7] S. P. Mzeleni, R. Morake and K. J. Nixon, "Finite-Difference Time-Domain Simulation of Lightning Induced Voltages in a Photovoltaic Array," in SAUPEC, Johannesburg, 2018.
[8] T. Miyazaki, S. Okabe and S. Sekioka, "An Experimental Validation of Lightning Performance in Distribution Lines," IEEE Transactions Power Delivery, vol. 23, no. 4, pp. 2182-2187, October 2008.
[9] P. Barker, T. Short, A. R. Eybert-Berard and J. P. Berlandis, "Induced Voltage Measurements on an Experimental Distribution Line During Nearby Rocket Triggered Lightning Flashes," IEEE Transactions on Power Delivery, vol. 11, no. 2, pp. 980-995, April 1996.
[10] V. Cooray, M. Rubinstein and F. Rachidi, "Field-to-Transmission Line Coupling Models With Special Attention to the Cooray-Rubinstein Approximation," IEEE Transactions on Electromagnetic Compatibility, vol. 63, no. 2, pp. 484 - 494, April 2021.
[11] C. A. Nucci, A. Borghetti, M. Paolone, P. Boselli, M. Bernardi, S. Malgarotti, I. Mastandrea and F. Rachidi, "Lightning-Induced Voltages on Overhead Distribution Lines: Theoretical and Experimental Investigation of related Problems and their Impact on Power Quality," Cigre C4-303, p. 4, 2004.
[12] H. J. Geldenhuys, "MV test line lightning recording CSIR 1983-1984 report," Pretoria, South Africa, CSIR, 1984, p. 28. [ Links ]
[13] W. J. Dirkse van Schalkwyk and J. M. Van Coller, "A feeder BIL to benefit Quality of Supply and Network Performance in high lightning areas," in CIGRE International Colloquium on Lightning and Power Systems, Bologne, 2016.
[14] R. Alipio, M. T. C. de Barros, M. A. O. Schroeder and K. Yamamoto, "Analysis of the lightning impulse and low-frequency performance of wind farm grounding systems," Elsevier, vol. 180, no. 10.1016, pp. 3-9, 2020.
[15] M. N. N. Santos and A. Piantini, "Characteristics of lightning-induced voltages based on experimental data," The Institute of engineering and Technology, vol. DOI: 10.1049/hve2.12055, no. High Voltage 2020, pp. 1-7, 2020.
[16] L. Mari, "EEPower," Understanding the Interaction between Lightning and Power Transmission Lines, pp. 1-2, 21 November 2020.
[17] H. K. Heidalen, "Calculation of Lightning-induced Voltages in MODELS Including Lossy Ground Effects," in International Conference on Power System Transients, New Orleans, USA, 2003.
[18] M. A. Uman and D. K. McLain, "Lightning Return Stroke Current From Magnetic and Radiation Field Measurements," J.Geophys.Res, vol. 75, pp. 5143-5147, 1970.
[19] A. K. Agrawal, H. J. Price and S. H. Gurbaxani, "Transient Response of a Multiconductor Transmission Line Excited by a Nonuniform Electromagnetic Field," IEEE Transactions on Electromagnetic Compatibility, Vols. EMC-22, pp. 119-129, May 1980.
[20] A. Piantini, "Lightning-Induced Overvoltages on Overhead MediumVoltage Lines," in IEEE International Conference on High Voltage Engineering andAppliation (ICHVE), Chengdu, China, 2016.
[21] D. H. Ha, J. K. Choi and Y. B. Yoon, "Parametric Analysis of Lightning Induced Voltage on Distribution Lines using EMTP," Journal of the Korean Institute of Illuminating and Electrical Installation Engineers, vol. 68, no. 3, pp. 19-26, 2019.
[22] A. De Conti, O. E. S. Leal and A. C. Silva, "Lightning-induced voltage analysis on a three-phase compact distribution line considering different line models," Elsevier, vol. 180, no. 10.1016, pp. 3-4, 2020.
[23] O. E. S. Leal and A. De Conti, "Lightning-Induced Voltages on an Overhead Dielectric-Coated Conductor," Elsevier, vol. 194, no. May 2021, pp. 2-4, 2021.
[24] L. Schuwalt, S. Pack and W. Schulz, "Ground truth data of atmospheric discharges in correlation with LLS detections," Elsevier, vol. 180, no. 10.1016, pp. 1-8, 2019.
[25] R. Smeets and P. Knol, "Verification of Lifetime arcing stress withstand of circuit breakers for testing," in Cigre 6th South Africa conference Paper no. P402, Cape Town, August 2009.
[26] A. M. Dan, Z. S. Czira and D. Raize, "Comparison of Different Methods to Decrease the Harmonic Content of the Fault Current during Single-Phase to Ground Faults in Compensated Networks," in Power Tech, 2005 IEEE, Russia, July 2005.
[27] R. P. Barradas, G. V. S. Rocha, J. R. S. Muniz, U. H. Bezerra, M. V. A. Nunes and J. S. Silva, "Methodology for Analysis of Electric Distribution Network Criticality due to Direct Lightning discharges," Energies, vol. 13(7), no. 1580, pp. 11-20, 2020.
This paper was submitted for review on 22 March 2021

Willem J Dirkse van Schalkwyk was born in Graaff- Reinet, South Africa in 1962. He graduated with B.Eng and M.Eng at the university of Stellenbosch, South Africa in 1984 and 2001 respectively.
He is currently Chief Engineer at Eskom Holdings SOC Ltd, Bloemfontein, Free State, South Africa. His research interest includes lightning and surge protection on MV lines as well as integration of renewable energy in HV and MV networks. Mr. Dirkse van Schalkwyk is a registered professional electrical engineer in South Africa and a Member of SAIEE.

John M. Van Coller was born in Nairobi, Kenya. He graduated with BSc (Eng), MSc (Eng) and PhD degrees in Electrical Engineering from the university of the witwatersrand, Johannesburg, South Africa, in 1975, 1982 and 1989 respectively.
He is an associate professor in the School of Electrical and Information Engineering at the university of the witwatersrand. He teaches and supervises students in the areas of High Voltage Engineering, Power Systems, Power Electronics and Power System Economics.
Prof van Coller is a Distinguished Member of Cigre and a senior member of the Institute of Electrical and Electronics Engineers.

Chandima Gomes was born in Colombo, Sri Lanka, in 1966. He obtained a First Class Degree in Physics from the University of Colombo in 1993. He has done his PhD Degree (1999) and some postdoctoral research on lightning protection and high voltage experiments at Uppsala University, Sweden. He is in addition to lightning protection, grounding and bonding, also an expert in electromagnetic compatibility, occupational safety, atmospheric physics and research methodology. For the last ten years he has conducted over 100 training programs on lightning and transient protection technologies and several other topics on electrical safety to the engineers in Saudi Arabia, Sweden, Dubai, South Africa, Uganda, Namibia, China, India, Sri Lanka, Bangladesh, Bhutan, Pakistan, Nepal, Indonesia, Malaysia and Colombia. He is currently professor at the University of Witwatersrand, Johannesburg, South Africa, and the Chair, ESKOM Power Plant Engineering Institute (EPPEI-HVAC). Prof. Gomes is a Fellow of the SAIEE

