


Services on Demand
Article
 English (pdf)
 Article in xml format
 Article references
Indicators

Related links
-
 Cited by Google
 -
 Similars in Google
Share

 Permalink
SAIEE Africa Research Journal
On-line version ISSN 1991-1696
Print version ISSN 0038-2221
SAIEE ARJ vol.111 n.2 Observatory, Johannesburg Jun. 2020
ARTICLES
Stochastic Assessment of the Impact of Distributed Synchronous Generators on Voltage Sags due to System-Wide Faults
N. MbuliI; R. XezileII; J. H. C. PretoriusIII
ISenior Member, IEEE; Eskom Holdings SoC Limited, ERIC, Lower Germiston Road, Rosherville, 2022, South Africa, (e-mail: mbulin@eskom.co.za) Mbuli is also a visiting
IIEskom Holdings SoC Limited, ERIC, Lower Germiston Road, Rosherville, 2022, South Africa, (e-mail:xezilerm@eskom.co.za)
IIISenior Research Associate at the University of Johannesburg, Faculty of Engineering and the Built Environment. J. H. C. Pretorius is with the University of Johannesburg, corner Kingsway and University Road, Auckland Park, 2006, Johannesburg, South Africa (e-mail: jhcpretorius@uj.ac.za)
ABSTRACT
In this paper, the authors use a stochastic approach to investigate the impact of distributed synchronous generation (DSG) on the severity of voltage sags due to system-wide occurring faults. Based on the method of fault positions, faults of various types are applied at pre-determined locations along all lines in the system and remaining voltages on the faulted phase at a monitoring point are recorded. This is done for a base case and a case with DSG. The results show with DSG, there is a general improvement in magnitudes of remaining voltage. Comparison of the populations of voltages for the two cases, using The Wilcoxon Signed Rank Sum Test, showed that these improvement are statistically significant. Further analysis showed that DSG either reduces severity of or eliminates some voltage sags. In addition, the number of expected trips due voltage sags is reduced with DSG, for any voltage sensitivity level assumed. The study concluded that incorporation of distributed synchronous generation is beneficial to the improvement of voltage sags and this should be a further incentive for their integration, especially into weak networks.
Index Terms: Distributed generation, quality of supply, voltage sags, Wilcoxon Signed Rank Sum Test
I. Introduction
THE traditional electrical supply structure is characterized by large, centralized generation plants located near primary energy sources. In the recent past, there has been a steady and significant growth in the uptake of distributed generation (DG) which may broadly be described [1] as sources of power that are closer to the consumption point and are sufficiently smaller than central generation plants.
It is estimated that the installed capacity of DG [2] will almost double from 2014 levels of 88 GW to 165 GW in 2023 and the financial investment will [3] grow from $150 billion in 2012 to $ 206 billion in 2020.
Among the key factors [4] that have led to increased penetration levels of DG are the need to diversify the energy mix for energy security, the need to protect the environment from emissions, technical advances that have been made in distributed generation technology, and the liberalization of the electric power markets to bring more generators to the grids. Further, other benefits of connecting DG include, inter alia, [5] possibility to defer network expansions, modularized power plants, ease of finding sites as plants are smaller, shorter construction times, and siting of plants closer to loads resulting in lower system technical loss.
With such high expected levels of penetration, the impacts of incorporating DG on quality of supply (QoS) need to be understood so ensure that minimum QoS levels [6] are met. Voltages sags, which according to the IEEE Standard 11591995 [7] are described voltage as reductions in root means square voltages to values between 0.1 and 0.9 per unit for durations in the range of 0.5, cycles and one minute, are one of the QoS phenomena that lead to most interruptions.
Voltage sags primarily affect the customers and are major contributors to the unwanted trips. A literature review on the impact of generators on voltage sags identified several publications. These studies include the evaluation of the effect of transmission and distribution system faults on voltage sags for a load connected at low voltage by Ramos et al. [8], investigation by Rojas et al. into how the number and locations of DG units affect voltage sags [9], and the assessment by Ramos et al. of how the system short circuit level, rated output of DG and model of generator used [10] affect voltage sags.
Further studies include that conducted by García-Martínez and Espinosa-Juárez [11] on how penetration levels of DG influence voltage sags and that by Renders et al. [12] on the impact of different types of DG units (i.e., converter-connected, asynchronous and synchronous) on voltage sags.
The studies on the impact of DG on voltage sags reported above were conducted on the basis of a single fault at one location only. These studies do give insights into the impacts, however, voltage sags do depend [13] on location of a fault in the network and, realistically, faults can occur anywhere on the system. Thus, improved insights can be obtained by considering many fault locations in the system.
In this paper, the main aim of the authors is to use a stochastic approach to study the impact of a distributed synchronous generator (DSG) on voltage sags at a monitoring point considering system-wide occurring faults. The specific objectives and contributions of the paper are as follows:
This work was supported by the University of Johannesburg and Eskom Holdings SoC Limited.
• To assess whether incorporation of DSG has the impact on the magnitudes of remaining voltages, following system-wide faults, at a monitoring bus. A stochastic method for estimating the expected number of voltage sags based on the method of fault positions that is developed in [14] is utilized in this paper. Transient stability studies are then used to determine magnitudes of remaining voltages at the monitoring point following faults at various locations along the lines.
• To evaluate the impact of incorporation of DSG on the probability of having higher remaining voltages following faults. The Wilcoxon Signed Rank Sum Test will be conducted to assess whether the changes in voltage magnitudes to incorporation of DSG are significant.
• To determine the impact of incorporation of DSG on the expected number of voltage sags.
The remainder of the paper is structured as follows. Section II explains how DSG impacts on voltage sags. In Section III, the method of fault positions used in the estimation of the expected number of voltage sags is discussed. The Wilcoxon Signed Rank Sum Test to be used for statistical comparison of two populations of voltages is presented in Section IV. The methodology of the case study (Section V), results and discussion (Section VI), and conclusions (Section VII), form the remainder of the paper.
II. Analysis of Impact of Distributed Synchronous Generation on Voltage Sags
In Fig. 1, a radial power system with a sensitive load located at the point of common coupling (PCC) is shown within the dotted box, with a distributed generator connected at the PCC. In the absence of distributed generation, the voltage at the PCC following a fault is the voltage sag experienced by the load and by applying the voltage divider rule [15], this voltage can be expressed as


where Vsag is the voltage at the PCC following a fault, Zfis the impedance between the location of fault and PCC, and Zs is the source impedance at the PCC.
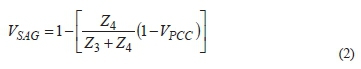
If DSG with an internal reactance of Z4is incorporated at the PCC using a reactance Z3, the sensitive load is located at the terminals of the DSG. The DSG will mitigate the severity of voltage sags [7], firstly, by increasing the short circuit strength of networks, which is more beneficial in weak networks, although care has to be taken not to exceed fault ratings of switchgear.
Secondly, the DSG reduces the severity of voltage sags in the system during faults by maintaining the voltage at its terminals by feeding into faults. By applying the voltage divider rule in Fig. 1 above, between points El(letting El=1 per unit) and the PCC, the expression for voltage sag, Vsag, experienced by the load during a fault can be written as
III. Estimation of the Expected Number of Voltage Sags
In order to determine how a system performs from a voltage sag perspective, information about the expected number of voltage sags [7] is critical in order to determine the appropriate measures to design customer facilities to ensure least impact on their production. This is usually described as the number of expected voltage sags/annum [16] at a particular node in the system.
The most direct way of obtaining this information is by power quality monitoring. However, this requires long periods if accuracy is to be reasonable and is influenced by network changes which can affect credibility of results. Also, this method cannot be used to assess performance of future networks. An alternative [17] is to use probabilistic prediction methods to obtain the information, with the advantages that information becomes available instantly and performance of future networks can also be assessed. These probabilistic methods have been used in both analytical assessments [17, 18] and in simulation-based studies [19-21].
A stochastic method for estimating the expected number of voltage sags based on the method of fault positions is developed in [14]. This method is then implemented in [22] and used to compare the expected voltage sag performance of various topologies of distribution networks.
This method is used again in [23] to assess the impact of different transformer winding arrangements on the propagation of voltage sags, caused by faults in higher voltage networks, to lower voltage areas.
The method of fault positions is utilized in the research reported in this paper. The key features of this method are
• Selection of a number of discrete positions along a line that are placed at equal distances.
• Thereafter, faults at applied at these positions and the magnitudes of remaining voltage at each position are recorded. If a large number of positions is chosen, the accuracy of results will be increased.
• Calculation of the expected number of critical voltage sags/annum. The procedure for calculating the total number of voltage sags at bus 1 due to single phase to ground faults in the system can be encapsulated by the expression (3)
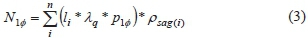
where is the total number of expected critical voltage sags/annum for the system, n is the number of lines in the system, U is the length of line i, historical λqis the faults/ km/annum, is the probability of having a single phase to ground fault, and pSag(i)is the probability of a voltage sag at bus 1 due to a fault on line i.
IV. Signed Rank Sum Test in Statistical Comparison of Populations
The key element in this study determining the magnitudes of voltages remaining at monitoring point following the faults occurring at the predetermined points on the lines. The magnitudes are calculated before and after installing DSG. Two voltages are thus recorded for each fault location studied and this experiment constitutes a matched pair experiment. The two resulting populations of data, before (population 1) and after DSG (population 2), can be compared to determine if DSG has impact on voltage sags.
Nonparametric approaches, i.e., those that do not rely on knowing the distribution that describe a population, can be used to compare two populations of data. The main concern is determining whether the locations of the two populations are the same, population 1 is to the right of population 2, or population 2 is to the right of population 1.
In the case of this study, i.e., a matched pair experiment with observations being interval data, the Wilcoxon Signed Rank Sum Test [24] is the appropriate nonparametric technique to use. In order to carry out the test, the following steps are involved:
• The null and alternative hypotheses are as follows:
H0: The locations of the two populations are the same, i.e., the median of the differences of magnitudes of paired voltages (observation from population 1 - observation from population 2) is zero (0).
H1: The location of population 2 is to the right of the location of population 1, i.e., the median of the differences of magnitudes of paired voltages is greater than zero (0).
• Calculate the difference for each pair of observations, di= yi- xi, where xiis from population 1 and yi is from population 2. Eliminate all the instances where the difference is 0.
• Rank the nonzero dis, ignoring the signs, i.e., assign rank 1 to the smallest /di/, rank to next, until all differences have a rank. Assign an averaged rank for ties.
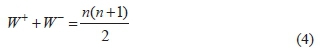
• Determine the sum of positive dis (W +) and negative dis (W-). As a check, confirm that equation (4) below, holds, where n is the number of pairs of observations in the sample.
• Select W+ as test statistic, W.
• For large samples (n > 30), the test statistic, W is approximately normal and with mean

and standard deviation
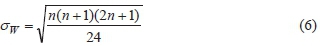
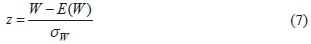
and thus the standardized test statistic is
• At a specified significance level, a, the null hypothesis is rejected in favour of the alternative (signifying the median is greater than zero and population 2 is to the right of population 1), both as described above, if z > Zcritical
• Alternatively the null hypothesis is rejected if the probability value (p-value) of the standard normal score (Z) is less than the significance level (a), i.e., If p-value < a, then H0 is rejected otherwise we do not reject H0.
V. Case Study: Description of the Methodology
This section discusses the details of the case study done. The Power System Simulator for Engineering (PSS/E) [25] software was used. The single line diagram of the network used is shown in Fig. 2. The network comprises a 150 kV level that is linked to a 20 kV component via a step down transformer.

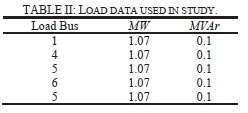
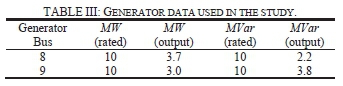
Tables I and II contain data for lines and loads, respectively. The generator data is summarized in Table III, with bus 8 being the system's swing bus. For the DSG case, a synchronous generator is connected to bus 1, the monitoring point. To represent the dynamics of the generators, the PSS/E round rotor machine model, GENROU, is used. For the exciter, the model IEEET2 is utilized.

The approach taken in the case study is explained as follows:
• Set-up a properly solving loadflow model, incorporate dynamic data for generators and controllers, and run transient stability simulations, ensuring that the system initializes correctly.
• Apply a fault in the simulation and record the magnitude of the remaining voltage on the faulted phase at the monitoring point (i.e., bus 1).
• Carry out the studies for every 5% of the length of the line and for all lines. Four fault types (i.e., single phase to ground, phase to phase, phase to phase to ground, and three phase faults) are evaluated. This translates to 672 individual transient stability runs.
• The probabilities of occurrence of faults of various types assumed are as shown in Fig. 3.

• In order to calculate the number of faults occurring on a particular line [23], one (1) and 0.1 fault/km/annum are assumed for 20 kV and 150 kV lines, respectively.
• Classify remaining voltage magnitudes into ranges of 0.1, from first range of 0.0 to 0.1, to the penultimate range of 0.8-0.9 and a final range of all magnitudes greater than 0.9 kV per unit.
• Calculate the differences in voltage magnitudes, subtracting base case voltage from DSG case and classify them into same ranges as in the most previous case.
• Perform the Wilcoxon Signed Rank Sum Test to assess if population 2 (i.e., sample of voltage with DSG) is to the right of population 1. Here, test is aimed at determining whether, at a specified significance level of a=0.05, if DSG leads to higher voltages remaining following faults. This analysis is carried out in JMP [26] software, and version 7 is used.
VI. Results and Discussions
The magnitudes of remaining voltages at the monitoring point (bus 1) on the faulted phase at bus 1 for faults applied along various lines in the network are presented in Fig. 4. For all fault locations and for all fault types, the graphs show that the introduction of distributed synchronous generators lead to improved magnitudes of remaining voltages after occurrence of faults. Most noteworthy improvements are observed in lines 78, 7-9, and 8-9 for phase to phase, phase to phase to ground and 3 phase faults in the DSG case.
For the base case, results similar to the ones presented here were obtained in a study in the paper in [23]. In that paper, the authors aimed at assessing the effect of transformer winding configuration on propagation of voltage sags in the network. They used the same network as in the study here, but used PSCAD/EMTDC software to determine magnitudes of remaining voltages following faults. They obtained voltage profiles that are identical to those in Fig. 4.
The remaining voltages from above were then classified into ranges, shown in Figure 5, and the count in each range determined. There is a discernible change in the profile of the counts from base case to SDG case. With the introduction of SDG, counts of voltages in the lower ranges are markedly reduced, while the counts in the higher ranges increase profoundly. Many of these voltage sags are either ameliorated to less severe sags or are eliminated completely.

The differences (voltage in base case subtracted from DSG case) in magnitudes were calculated and counts of those falling in the ranges described above were made. The results are shown in Fig. 6. None of the differences in magnitudes are less than or equal to 0, showing a general improvement in voltages with the introduction of DSG.

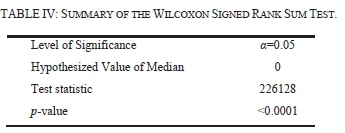
Further to the results above, the results of the Wilcoxon Signed Rank Sum Test conducted to assess whether the improvement in voltages could be claimed at a level of significance of a=0.05 were statistically significant, are shown in Table IV. The test showed that the median of differences was statistically significantly higher than zero (p<0.001). Thus, there is enough evidence to reject the null hypothesis, and concluded that the incorporation of DSG leads to the remaining voltages with higher magnitudes following faults.
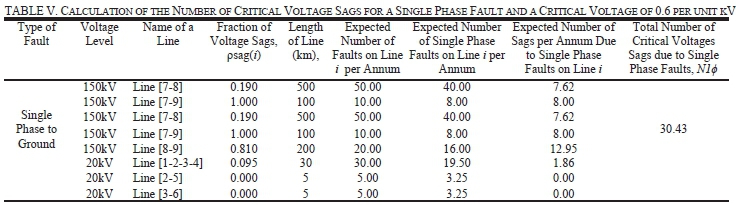
Based on the discussion in Section III, the calculation of the number of expected voltage sags per annum is illustrated in Table V, with the case of voltage sags due to single phase faults used. In this illustration, the critical voltage chosen is 0.6 kV, i.e., the voltage at the monitoring bus below which a sag is declared following a fault.
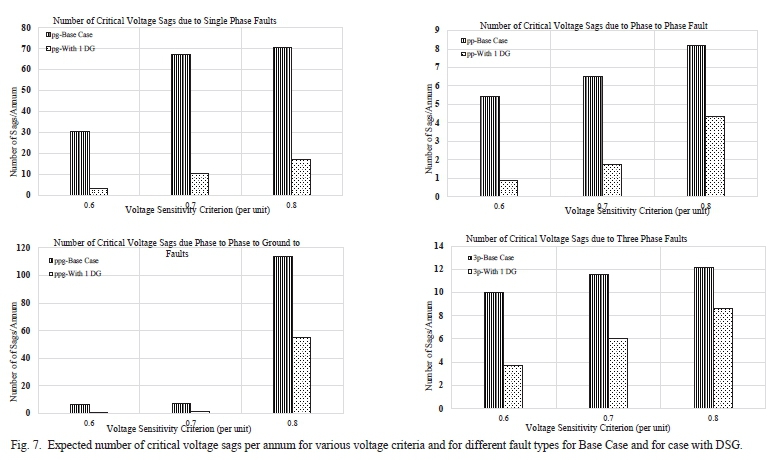
The expected number of voltage sags for various types of faults are then calculated following this procedure. In Fig. 7, the expected number of critical voltage sags per annum for Base Case and DSG Case, by fault type and according to various voltage criteria, are presented. For all fault types and for all voltage criteria, the expected number of critical voltage sags is reduced substantially when DSG is installed.
The number of critical voltage sags are calculated for various voltage sensitivity thresholds and are plotted for Base Case and DSG Case. As expected, the number of critical voltage sags increases as the voltage sensitivity threshold is increased in both Base Case and DSG Case. When comparing the results for the two cases, it can be observed that the number of critical voltage sags, for each fault studied and irrespective of the threshold considered is less for the DSG Case than the corresponding number for Base Case.
It can be inferred that the incorporation of DSG leads to more robust networks that are better able to deal with faults and associated adverse effects of reduction in voltages, and ultimately, the number of expected voltage sags that can be experienced by the power system.
VII. Conclusion
In this paper, the authors have studied the impact of a distributed synchronous generator on voltage sags at a monitoring point, considering system-wide occurring faults, using a stochastic approach based on the method of fault positions. The study demonstrated that the incorporation of DsG had the effect of improving the magnitudes of remaining voltages at the monitoring point following faults in the system.
Further, the study also showed that the probability of having higher remaining voltages following faults increased with the incorporation of DsG. Lastly, the investigation showed that number of expected voltage sags was reduced when DsG was incorporated into the system.
It can thus be concluded that incorporation of DsG leads to a more robust system that is less prone to adverse impacts of general voltage reductions, and specifically voltage sags, following system-wide faults. Thus, DsG enables a more reliable operation in which disruption of customer operations and associated financial losses can be reduced.
Acknowledgments
The authors wish to express their appreciation to the University of Johannesburg and Eskom Holdings SoC, both in south Africa, for resources they provided to the project.
References
[1] F. Gonzales-Longatt and C. Fortoul, "Review of the Distributed Generation Concept: Attempt of Unification," in Proc. International Conference on Renewable Energies and Power Quality (ICREPQ' 05), Zaragoza: Spain, 16-18 March 2005, pp. 281-284.
[2] The Annual Installed Capacity of Distributed Generation is Expected to Double by 2023. [Online]. Available: https://www.navigantresearch.com/newsroom/the-annual-installed-capacity-of-distributed-generation-is-expected-to-double-by-2023. Last accessed on 09 January 2018.
[3] B. Owens, "The Rise of Distributed Power,". [Online]. Available: https://www.eenews.net/assets/2014/02/25/document_gw_02.pdf. Last accessed on 09 January 2018.
[4] D. T. Wang, L. F. Ochoa and G. P. Harrison, "DG Impact on Investment Deferral: Network Planning and Security of Supply," IEEE Transactions on Power Systems, Vol. 25, No. 2, 2010, pp. 1134-1141. [ Links ]
[5] A. A. Bayod Rujula, J. M. Amada, J. L. Bernal-Agustin, J. M. Yusta Loyo, J. A. Dominguez Navarro, "Definitions for Distributed Generation: A Revision," in Proc. International Conference on Renewable Energies and Power Quality (ICREPQ' 05), Zaragoza: Spain, 16-18 March 2005, pp. 340-343.
[6] S. Chattopadhyay, M. Mitra and S. Sengupta, "Electric Power Quality, " Springer: New York, 2011.
[7] M. H. J. Bollen, "Understanding Power Quality Problems: Voltage Sags and Interruptions," IEEE Press Series on Power Engineering, The IEEE, lnc., New York: USA, 2000.
[8] A. C. L. Ramos, A. J. Batista, B. P. Alvarenga and R. C. Leborgne, "A First Approach on the Impact of Distributed Generation on Voltage Sags Studies," in Proc. International Conference on Renewable Energies and Power Quality (ICREPQ' 14), University of Cordoba: Spain, Paper 432, 8-10 April 2014, pp. 1-6.
[9] H. E. Rojas, A. S. Cruz and H. D. Rojas, "Voltage Sags Assessment in Distribution Systems Using Distributed Generation," SICEL VII Simposio Internacional sobre Calidal de la Energia Electrica, Medellin: Colombia, 27-29 Noviembre 2013, pp. 1-6.
[10] A. C. L. Ramos, A. J. Batista, R. C. Leborgne and P. H. M. Emiliano, "Distributed Generation Impact on Voltage Sags," in Proc. Brazilian Power Electronics Conference 2009 (COBEP 09), 27 September - 1 October 2009, Bonito-Mato Grosso do Sul: Brazil, pp. 446-450.
[11] S. García-Martínez and E. Espinosa-Juárez, "Analysis of Distributed Generation Influence on Voltage Sags in Electrical Network," in Proc. 3rd International Multi-Conference on Engineering and Technological Innovation, (IMETI2010), Florida: USA, 29 June - 02 July 2010, pp. 26.
[12] B. Renders, K. De Gussemé, W. R. Ryckaert, K. Stockman, L. Vandevelde and M. H. J. Bollen, "Distributed Generation for Mitigating Voltage Dips in Low-Voltage Distribution Grids," IEEE Transactions on Power Delivery, Vol. 23, No. 3, July 2008, pp. 1581-1588. [ Links ]
[13] P. Chen, V. Malbasa, Y. Dong and M. Kezunovic, "Sensitivity Analysis of Voltage Sag Based Fault Location With Distributed Generation," IEEE Transactions on Smart Grid, Vol. 6, No. 4, July 2015, pp. 2098 - 2106. [ Links ]
[14] J. V. Milanovic and C. P. Gupta, "Probabilistic Assessment of Financial Losses due to Interruptions and Voltage Sags-Part I: The Methodology, IEEE Transactions on Power Delivery, Vol. 21, No. 2, April 2006, pp. 918-924. [ Links ]
[15] A. R. Hambley, "Electrical Engineering: Principles and Applications," 6th Edition, Pearson Education Limited, Essex: England, 2014.
[16] Dugan, R.; McGranaghan, C.; Santoso, M. F.; Beaty, H. W., Electrical Power Systems Quality, 2nd Edition, McGraw-Hill, 1996, New York, USA.
[17] E. Espinosa-Juárez and A. Hernandez, "An Analytical Approach for Stochastic Assessment of Balanced and Unbalanced Voltage Sags in Large Systems," IEEE Transactions on Power Delivery, Vol. 21, No. 3, July 2006, pp. 1493-1500. [ Links ]
[18] M. N. Moschakis and N. C. Hatziargyriou, "Analytical Calculation and Stochastic Assessment of Voltage Sags," IEEE Transactions on Power Delivery, Vol. 21, No. 3, pp. 1727-1734, July 2006. [ Links ]
[19] M. H. J. Bollen, G. Yalcinkaya, J. Pellis and M. R. Qader, "A Voltage Sag Study in a Large Industrial Distribution System," 31st IEEE Industry Applications Conference, San Diego: USA, 6-10 October 1996, Vol. 4, pp. 2372-2377.
[20] T. Thasananutariya and S. Chatratana, "Stochastic Prediction of Voltage Sags in an Industrial Estate," IEEE Proceedings, Industrial Applications Conference, 2005, Vol. 2, pp. 1489-1496.
[21] T. Thasananutariya and S. Chatratana, "Investigation of Voltage Sags due to Faults in MEA's Distribution System," 18th International Conference on Electricity Distribution (CIRED 2005), Session No. 2, Turin: Italy, 69 June 2005, pp. 1-5.
[22] J. V. Milanovic and C. P. Gupta, "Probabilistic Assessment of Financial Losses due to Interruptions and Voltage Sags-Part II: Practical Implementation, IEEE Transactions on Power Delivery, Vol. 21, No. 2, April 2006, pp. 925-932. [ Links ]
[23] N. Patne and K. L. Tharke, "Effect of Transformer Type on Estimation of Financial Loss due to Voltage Sag-PSCAD/EMTDC Study," IET Generation, Transmission, and Distribution, Vol. 4, Issue 1, 2010, pp. 104-114. [ Links ]
[24] G. Keller, "Statistics for Management and Economics," 10th Edition, C ENGAGE: Conecticut, USA, 2014.
[25] PSS/E, Power System Simulator for Engineering: Online Documentation: Ver. 32 (Siemens Energy, Inc., 2009).
[26] JMP, Statistical Analysis Software. [Online]. Available: https://www.jmp.com/en_us/software.html 7. Last accessed on 09 January 2018.

Nhlanhla Mbuli (SM'2012, M'2011) received the BScEng from the University of Natal in 1994, MEng from University of Pretoria in 2000, and DEng from the University of Johannesburg in 2006.He works as Corporate Specialist for Grid Planning and Operation at Eskom Holdings SoC Limited and is affiliated with University of Johannesburg as a Senior Research Associate. His current research interests include Power System Planning, Power System Performance, and Statistics.

Ronald Xezile received the BScEng (Electrical Engineering) from the University of Cape Town in 2003 and the MEng from the University of Johannesburg in 2016. At present he is a Senior Engineer at Eskom Holdings SoC Limited, within the Research, Test and Demonstration Department. His area of specialization is Grid Planning and Operation. His main research focus is Integration of Renewable Energy Sources and Power System Stability.

Jan-Harm C. Pretorius obtained his BSc (Hons) (Electrotechnics) (1980), MIng (1982) and DIng (1997) degrees in Electrical and Electronic Engineering at the Rand Afrikaans University, as well as the MSc (Pulse Power and Laser Physics) at the University of St Andrews in Scotland (1989)(Cum Laude). He is currently a Professor in the Faculty of Engineering and the Built Environment.

