


Services on Demand
Article
 English (pdf)
 Article in xml format
 Article references
Indicators

Related links
-
 Cited by Google
 -
 Similars in Google
Share

 Permalink
SAIEE Africa Research Journal
On-line version ISSN 1991-1696
Print version ISSN 0038-2221
SAIEE ARJ vol.109 n.1 Observatory, Johannesburg Mar. 2018
Energy efficient statistical cooperative spectrum sensing in cognitive radio networks
E. KatakaI; T. WalingoII
IDiscipline of Electrical Electronic and Computer Engineering, University ofKwaZulu-Natal, Durban 4041, South Africa, E-mail: kataka.edwin@gmail.com
IIDiscipline of Electrical Electronic and Computer Engineering, University ofKwaZulu-Natal, Durban 4041, South Africa, E-mail:walingo@ukzn.ac.za
ABSTRACT
Cooperative spectrum sensing (CSS) alleviates the problem of imperfect detection of primary users (PU)s in cognitive radio (CR) networks by exploiting spatial diversity of the different secondary users (SUs). The efficiency of CSS depends on the accuracy of the SUs in detecting the PU and accurate decision making at the fusion center (FC). This work exploits the higher order statistical (HOS) tests of the PU signal for blind detection by the SUs and combination of their decision statistics to make a global decision at the FC. To minimize energy, a two stage optimization paradigm is carried out, firstly by optimal iterative selection of SUs in the network using Lagrange criterion and secondly optimized fusion techniques achieved by Neyman Pearson. The probability of detecting the PU based on HOS and hard fusion schemes is investigated. The results indicate that the Omnibus HOS test based detection and optimized majority fusion rule greatly increases the probability of detecting the PU and reduces the overall system energy consumption.
Key words: Cognitive radio, cooperative spectrum sensing, fusion techniques, higher order statistics, primary user, secondary user.
1. INTRODUCTION
Cooperative spectrum sensing (CSS) utilizes multiple secondary users (SUs) to sense the vacant spectrum and send their decision to the fusion center (FC) for a final global decision to be made regarding the presence of the primary user (PU) on the channel. CSS overcomes the challenges of wireless channel characteristics such as multipath fading, shadowing or hidden terminal problem experienced when only one SU is employed to detect the PU. This is due to the spatial diversity of the different SUs cooperating to make the final decision on the status of the PU on the channel [1,2]. A number of spectrum detection schemes have been proposed to detect the presence or absence of PU, among them include energy, matched filter and cyclostationary methods [3]. In most practical systems the transmission channels are usually noisy hence causing tremendous reduction in signal to noise ratio (SNR) of the PU received signals. This has prompted the need for the higher order statistical (HOS) detection techniques which have very high sensitivity at low SNR signal condition while maintaining reasonable circuit complexity [4]. CSS can generally be divided into two detection stages; local update stage and global fusion stage. At the local update stage, the individual SUs detect the received PU's signals based on HOS. The SU then computes a local decision and sends it to the FC for fusion. The commonly used metrics that utilize the HOS properties to detect the PU's received signals include Jarque-Bera, kurtosis, skewness and omnibus tests. These statistical tests are utilized to determine the probability distribution function (PDF) of a group of data samples. This is crucial for benchmarking the distribution in order to make an informed inference on a physical phenomena (existence of PU on the channel) [5].
In this paper, the performance analysis of the HOS tests on the PU signal is investigated with aim of selecting the best statistical technique in determining the status of the PU on the channel. This has not been adequately addressed in literature.
The global fusion stage is performed at the fusion centre where either soft or hard combination schemes are employed to fuse the received signals from individual SUs [6]. Furthermore to reduce energy consumption in the cooperative network not all the SU need to report their individual decisions. To optimize on the number of SUs selected to participate in the fusion process, this paper proposes a two stage optimization strategy. The first stage is to select the SUs which qualify to transmit their individual decision data to the fusion center. To achieve this an iterative optimization threshold algorithm is employed and determined based on the SUs' SNR. However, this is at the cost of minimizing on the error probability formulated by the Lagrange optimization criterion. The rest of SUs that do not meet this threshold are rejected at this sensing point in time (they are not allowed to transmit). Those SUs selected during the first optimization stage are subjected to the second stage optimization process, realized by a prudent and optimal choice of hard fusion criteria taken to fuse the SUs binary decisions. A strategic k out of n counting rule is adopted to determine the optimal combinatorial order of the SUs to be considered for final global fusion. To realize this, Neyman-Pearson optimization criterion is employed through an iterative Bisection numerical search algorithm formulated on k out of n rule. The cost function is to maximize the probability of detection subject to minimizing of the probability of false alarm. In summary, a hybrid detection strategy of HOS local detection test and optimal global fusion technique was implemented. The simulated results show that an optimal k out ofn fusion rule based on omnibus test perform better than other HOS tests in terms of detection probability. In this model, not all SUs participate in detection at any one sensing time frame hence great energy cost saving in the whole cooperative spectrum sensing network.
The rest of the paper is organized as follows. Section II presents the related work, section III describes the system model, section IV is devoted on local spectrum sensing, section V focuses on the fusion techniques, section VI presents the energy efficiency. Simulation results illustrating the effectiveness of the scheme are given in section VII and finally, section VIII, draws the conclusions.
2. RELATED WORK
Cooperative spectrum sensing schemes have not exhaustively been studied in the current literature. In [7], authors investigated the performance of energy based CSS scheme where a group of SUs cooperated to detect the presence or absence of primary user (PU) in fading channel environment. They also made comparative study on the three main hard fusion techniques i.e. OR-logic, AND-logic and Majority-logic to make global decisions at the fusion center. In [8], authors proposed selection technique based on iteratively setting different thresholds for different signal to noise ratio (SNR) of SUs in cooperative spectrum sensing with OR logic fusion technique done at the fusion centre. This scheme highly outperformed the traditional energy spectrum sensing with the same threshold in terms of reduced probability of false alarm. Higher order test (HOS) have been utilized in literature to analyze data distribution and its degree of departure from the normal distribution. The concept of separation is based on the maximization of the non-Gaussian property of separated signals to improve the robustness against noise uncertainty. The authors in [9], proposed kurtosis and skewness (goodness-of-fit) test to check the non-Gaussianity of an averaged periodogram of received SUs signal. This is computed from the Fast Fourier transform (FFT) of the PU signal to justify its existence and hence the availability or not of the spectrum for a cognitive radio transmission. Their findings showed improved detection of the PU signals especially under very low SNR conditions i.e. the SUs are able to detect the primary channel with certainty even under very noisy environment. In [10], authors proposed Jarque-Bera tests based spectrum sensing algorithm and compared it to a kurtosis & skewness combination test statistics. From their simulated results they concluded that Jarque-Bera showed better detection performance than the kurtosis & skewness in terms of the reliability i.e. improved probability of detection for different values of SUs' SNR. In the emerging research on spectrum sensing schemes, researchers considered a number of modulation schemes on multipath fading channel based on Jarque-Bera test in detection of the primary user. These schemes were considered to transcend the absence of a priori information of the spectrum occupancy under additive white Gaussian noise channel [4]. In [11], authors showed Jarque-Bera as having rather poor small data sample properties, slow convergence of the test statistic to its limiting distribution. In their findings the power of the statistical tests showed the same eccentric form, the reason being skewness and kurtosis are not independently distributed, and the sample kurtosis especially attains normality very gradually. However, the JB test is simple to calculate and its power has proved to match other powerful statistical tests. A genuine omnibus tests should be consistent to any departure from the null hypothesis. In [12], authors formulated omnibus test which is based on the standardized third and fourth moments. This was done to assess the normality of random variables by calculating the transformed samples of kurtosis & skewness. In the computational economics these authors showed omnibus's simplicity provided by the chi-squared framework. In this work the omnibus test is applied in CSS and compared to other well known Jarque-Bera, kurtosis and skewness tests. Fusion of the decisions received at the fusion center with a view to make the final global decision on the status of the primary user is also another important challenge that has not been exhaustively studied. Fusion techniques are classified into soft and hard combination schemes. In hard decision strategy the FC combines binary decisions using standard hard decision rules to achieve the global decision. Three hard combining decision rules used to arrive at the final decision are classified as AND, OR and majority also called k out ofn counting rule [13]. In [14], authors made a comparative study of the performance of the three hard fusion techniques. In their findings they concluded that AND rule was the most reliable fusion scheme followed by majority and the lastly the OR rule. Another comparative study on the performance of hard fusion schemes and soft decision schemes was done by authors in [15]. In their study they confirmed earlier research done to justify that soft fusion decision reported better PU signal detection, albeit having significant data communication overheads. Hard combination schemes however have attracted most attention from researchers since these fusion schemes are easy to implement by simple logics gates. The authors in [16], proposed strategies on how the AND, majority and OR fusion rules are optimized based on the Neyman-Pearson criterion. Under this strategy the sensing objective was to maximize the probability of detection with the constraint on the probability of false alarm of less than 10 percent. Their findings showed AND rule had higher detection performance than the other two. Spectrum sensing in the IEEE 802.22 standard, for example requires stringent sensing of a false alarm probability of less than 0.1 for a signal as low as -20 dB (SNR) [17]. In [18], authors proposed an the iterative threshold cooperative spectrum technique. Their objective was to optimize the thresholds of the cooperative spectrum sensing with different fusion rules including AND logic & OR logic. This was done in order to obtain the optimal SUs in cooperative spectrum sensing and their optimal thresholds. Their algorithm achieved better detection performance for SUs' with different SNR. The optimal scheme also employed fewer SUs in collaborative sensing at the fusion center. In [19], the authors proposed an optimized detection threshold in order to minimize both the error detection probabilities of single-channel and multichannel cooperative spectrum sensing. In single-channel cooperative spectrum sensing, they performed an iterative optimal thresholds with AND logic, OR logic and k out of n rule respectively. Their findings showed a great decrease in the error on detecting PU status on the channel. Energy efficiency in the cognitive radio network is defined as the ratio of throughput (average amount of successfully delivered bits transmitted from SUs to the fusion centre) to the total average energy consumption in the system [20]. In order to reduce the energy consumed in spectrum sensing network, not all SUs in each cluster send their sensed results to the fusion center of local cluster. In [21], authors optimized k out ofn by allowing those SUs with reliable sensing results to transmit to the FC. This showed some reduction in energy consumption of the cognitive radio network. In this paper an optimal k out ofn is applied to improve on the probability of detection and reduce on the energy system consumption by employing fewer SUs in the final detection on the presence or absence of the PU.
Notations: E[•] is the expectant operator, var is the variance, Im[•]and Re[•] are the imaginary and real parts of the signal X(•), erfc(•) is complementary error function and h is the circular Gaussian channel.
3. SYSTEM MODEL
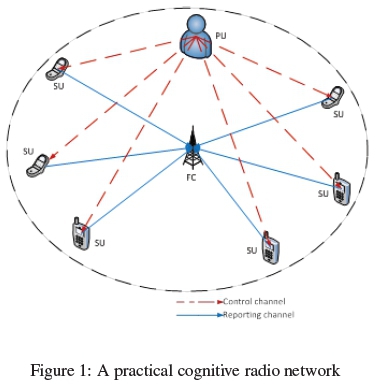
3.1 Practical cooperative sensing model
The system model in figure 1 shows a practical CSS network. In this scheme, a group of SUs sense the spectral band to determine the presence or absence of PU. They receive this information through the control channel and independently analyze it by utilizing the statistical properties of the received PU's signal, and subsequently communicate their individual decisions through the reporting channel to the FC. At the fusion center, the decisions from individual SUs are integrated together to finally make the global decision on whether the PU is transmitting on the channel or not. The SUs can then opportunistically access and transmit on the channel if found idle.
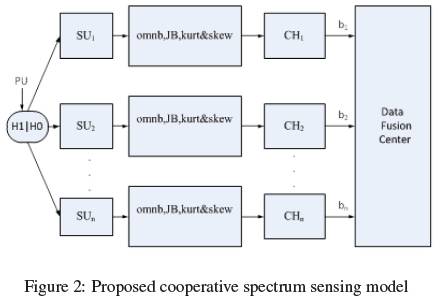
3.2 Proposed Cooperative Spectrum Model
In the proposed lower level system model of figure 2, the secondary users (SU1;SU2,...,SUn) collectively sense the PU channel based on HOS tests namely, kurtosis & skewness (kurt & skew), omnibus (omnb) and Jarque-Bera ( JB) statistics tests. The hard binary local decisions made by SUs are transmitted over wireless Gaussian channel represented as (CH1,CH2, ...,CHn) to the data FC. The binary data (b1,b2,...,bn) is fused to achieve the final global decision on the presence or absence of the primary user.
4. LOCAL SPECTRUM SENSING
4.1 Spectrum sensing hypothesis
Generally the spectrum sensing problem can be formulated by the following two hypothesis [4,9]
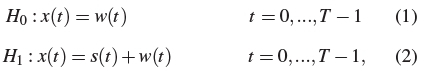
where H0 and H1 are null and alternative hypothesis respectively, t is the digital samples numbering T , w(t) is the additive white Gaussian noise, s(t) is the PU's signal and x(t) is the signal received at the fusion center. The received signal plus additive white Gaussian noise x(t) as function of SNR (y) is given as

where y is the PU signal to noise ratio (SNR). The probability of detection is formulated as hypothesis test Pd = Prob(Signal Detected | H1), whereas the probability of false detection is determined as Pf = Prob(Signal not Detected | H1). Another form of formulation is thresholding on the statistical test parameter. To detect the PU's spectrum effectively there is need to first estimate and analyze the power spectral density (PSD) of the SUs received signal. A strategic periodogram PSD estimation technique can be used to accurately present the frequency-domain statistical properties of a signal [9]. Based on the periodogram method and as formulated in algorithm 1, the received signal x(t) of T samples is firstly subdivided into L smaller segments. Then the i-th segment signal can be formulated as [9]
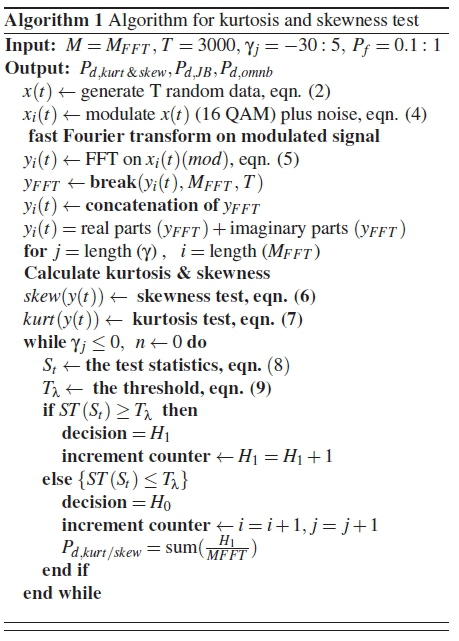
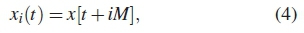
where i = 0,..., T - 1 is the number of data samples, M = T/L is the length of each segment and t = 0,..., M - 1 are the Fast Fourier transforms (FFT) points in one segment. Performing FFT on signal sample xi(t), periodogram of the i-th SU, yi(t) is given by
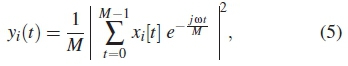
where i Є [t, T] is the number of samples, M is the length of each segment representing the elements of discrete Fourier transform (DFT) and  The function yi(t) is modeled as the PU signal and is utilized in the next section to determine the skewness and kurtosis.
4.2 Spectrum sensing HOS techniques
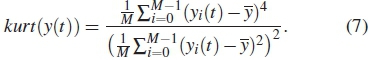
Skewness and kurtosis: The estimated skewness (skew) is defined as third standard moment of a random variable xi(t) of a Gaussian distribution. Estimated kurtosis (kurt) on the other hand is given by fourth standard moment of a random distribution. The value tends to 3 as the sample size considered for the test increases [20]. For given sample set of yi(t) the estimated sample of skew is given as
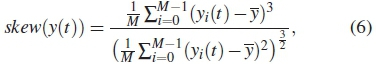
where y is the mean of a given signal data. Similarly, the estimated kurt of a random sample is formulated as
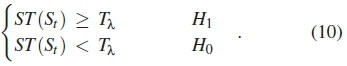
The test statistics ST(st) of the periodogram (power spectral density) is represented as the square root of the sum of squares of skew(y(t) and kurt(y(t)) as calculated in algorithm 1. When the value of test statistics is larger than a set threshold Tλ, the distribution of the received signals averaged periodogram deviates from the AWGN's power spectral density, which is an indicator of the presence of PUs signal. The test statistics of the periodogram estimate can be formulated as
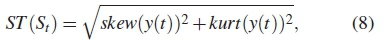
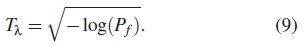
where skew(y(t)) and kurt(y(t)) are the test statistics for skew and kurt respectively of the signal x(t). For a given probability of false alarm (Pf), the threshold (Tλ) for skew and kurt tests the null hypothesis (H0). This is a chi-squared distribution defined as Pf = 1 - f (Tλ : H0) and hence is formulated as [9]
In order to derive the probability of detection (Pd) and ( Pf) , the PDF for the test statistic is developed for both H0 and H1 as
Jarque-Bera (JB): The Jarque-Bera statistic has asymptotic chi-squared distribution with two degrees of freedom [10], formulated by considering the estimated skew and kurt on the transmitted PU signal, defined as [11]
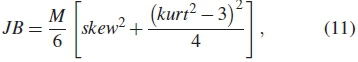
where M=MFFTis the number FFT points. In order to derive the Pdand Pfthe hypothesis tests H1 and H0 are formulated as
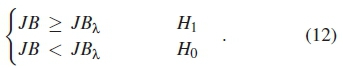
For a given probability of false alarm (Pf), the threshold for JB test based on null hypothesis (H0), for an MFFT points is expressed as [12]
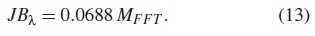
For the null hypothesis to be accepted the test statistics must be smaller than a critical value that is positive and near zero. Higher values of JB indicate the sample do not follow the Gaussian distribution. The probability of detection is iteratively determined as shown in the pseudo code for algorithm 2.
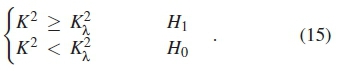
Omnibus (K2) test: Omnibus is defined as the square root of a transformed skewness (skewT) and kurtosis (kurtT) test statistics. The asymptotic normal values for (skew) and (kurt) are used to construct a chi-squared test involving the first two moments of the asymptotic distributions [12], mathematically expressed as
The hypothetical omnibus test is derived by comparing to defined threshold (K2λ) formulated as
For a predetermined Pf the threshold for omnibus test is a fixed value determined by
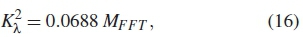
where MFFTis the number of FFT points. The skewT on the estimated data sample is given as [11,12]
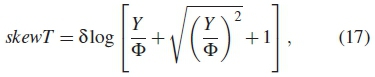
where Φ = is a small deviation from the critical value on the skewness of the estimated distributed random data, W2 =
  is a constant of normalization on skewness, δ =
  is the skewness parameter and (Y ) is the estimated skewness value of the random distributed data given as
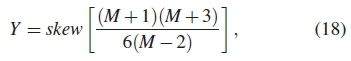
where skew = skew(y(t)) is estimated skewness of the sampled signal data as given in equation (7), M is the number FFT data sample points. The skewness as a function of the variance ji2(skew) is formulated as
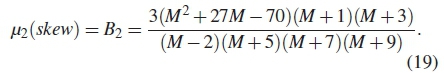
The transformed kurtosis (kurtT) on the random distributed received PU's signal is also formulated as [11,12]
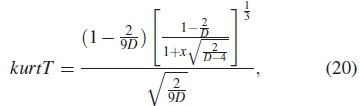
where D is a constant that denotes the degrees of freedom for the chi-squared distribution. Solving for D to equate the third moment of theoretical and sampling distributions, it is possible then to compute D as follows
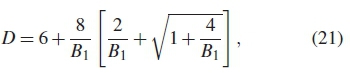
where B1 = μ1(kurt) is the kurtosis as a function of the mean (μ1)given as
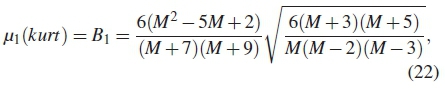
where kurt = kurt(y(t)) is the estimated kurtosis given in equation (7) and M is the number of samples. It is possible to standardize kurtosis by formulating the expression as
where the mean as a function of kurtosis is given as  and variance as a function of kurtosis is expressed as var [kurt] =
 , are all computed to determine transformed estimated kurtosis s shown in algorithm 2.
5. FUSION SCHEMES
5.1 Fusion strategy hypothesis tests
The null hypothesis (H0) for decision statistics of the omnibus test can be derived as
where X is the decision threshold which has to be optimized. The cost functions are formulated in terms of probability of misdetection and false alarm as conditioned on the channel, the probability of misdetection is formulated as [22]
where  is given as the instantaneous SNR. The instantaneous channel phase angle 0 is defined as
  , w(t) is the AWGN. The probability of misdetection
  is the sum of the lower bound probability
  and upper bound probability
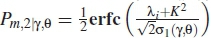
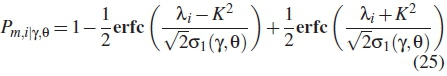
Unlike in [22], this paper uses omnibus test (K2) instead of kurtosis. λiis the decision threshold, 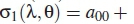

 is expressed in terms of instantaneous SNR and phase angle of a circular Gaussian channel. The following constants; a00, a10, a20, a21, a30, a31, a40, a41 & a42 are given in table 1. The conditional (on the channel) probability of false alarm is given as
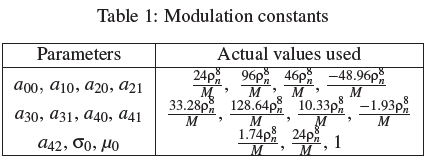
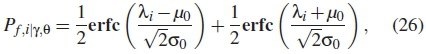
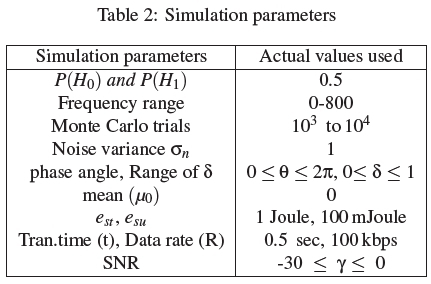
where 0 is the phase angle, y is the SNR of the signal, O0 is the modulation constant and u0 is the mean of the data distribution as given in table 2.
5.2 First stage optimization on SU selection criteria
The aim of the first stage optimization is to iteratively select n SUs in 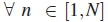 SUs, in an r out of n counting rule where r is the number of SUs that form the combinatorial n fusion order and N is the total number of SUs in CSS network. The criteria on selection is based on SUs decrementing SNR as formulated in algorithm 3. The error probability is further expressed as
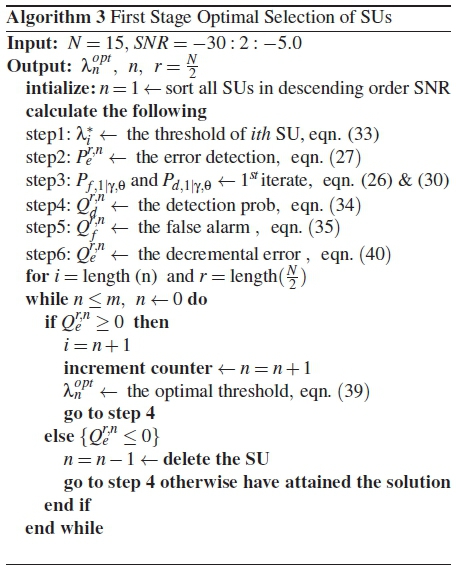
where P(H0) is the null hypothesis, P(H1) is the alternative hypothesis, Qf is the global probability of false alarm and Qmis probability of misdetection. The sum of probability of false alarm and misdetection is derived as a cost function to determine the global decremental error probability (Qe) in the detection of the primary user in CSS network. The minimization problem is formulated as [15, 16, 18, 19]
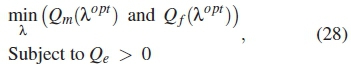
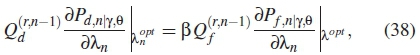
where λoptis the optimal decision threshold. Considering equation (25) and equation (26), the optimal threshold is formulated as
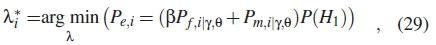
where  is the detection factor, Pf,i|y,0 is the false alarm and Pm,i|y,0 is the misdetection of the ith SU. From equation (25), the probability of detection is similarly given as
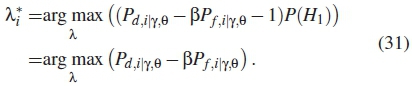

Consequently from equation (29), the threshold is maximized as follows
By the Lagrange theorem, the maximum threshold is obtained by differentiating by parts as follows
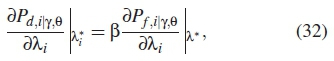
where i = 1,...,n is the number of SUs selected to participate in fusion and λi is the initial optimal threshold derived as
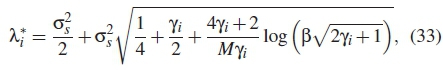
where σ2s is the noise variance, yi is the SNR of the i-th SU and M is the number of signal data samples. The global probability of detection in r out of n rule is derived as
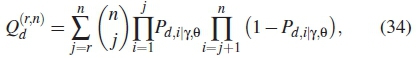
where n ε {j = 1,..,N}, N is the total number of SUs, 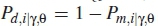 is probability of detection as given in equation (25), r is the actual number of SUs that form r out ofn counting rule and n is the total number of SUs selected to participate in decision making. Similarly, the global probability of false alarm is formulated as
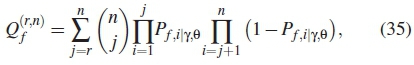
where n ε{j = 1,..,N},  is probability of false alarm as given in equation (26). The selection criteria is done by the iterative calculation of global probability detection and false alarm simultaneously, as performed in algorithm 3. The minimization problem stated in equation (28) is formulated mathematically as

where Qd = 1 - Qmis the global probability of detection, the probability of false alarm is similarly derived as

The final iteration gives the optimal threshold  given for n number of SUs, formulated as
where the optimal threshold is given in this scenario as
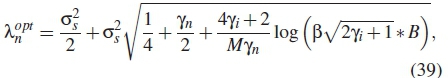
where B =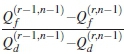 is the detection factor, yn is the SNR for the n-th SU, σ2S is the noise variance and M is the signal data samples. The decremented detection error is expressed as
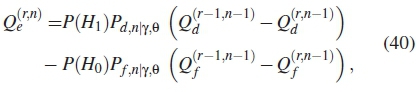
where the P(H0) and P(H1) are the weights for probability of false  and probability of detection
  respectively, n is the number of SUs participating in detection of the presence or absence of the PU on the channel, y is the SNR and 0 is the uniformly distributed phase angle.
5.3 Second stage optimal strategy
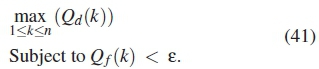
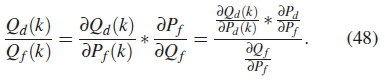
At the FC, a specific k out of n strategy is employed to process the SUs' received decisions at the FC. Where k is number of SUs in the range of (1 < k < n) and n is the total number of SUs selected from a total of N as realized in the first optimization stage. The idea behind this rule is to find the number of SUs whose local binary decisions is 1. If this number is larger than or equal k, then the spectrum is said to be used otherwise the spectrum is unused. An iterative numerical search determined in algorithm 4 is carried out to find an optimal number of k SUs in k out ofn combinatorial order is done at the FC. To achieve this an upper-threshold of global probability false alarm (Qf) of less than utilization level (ε) is set. The maximization problem can be formulated as [7,15,16]
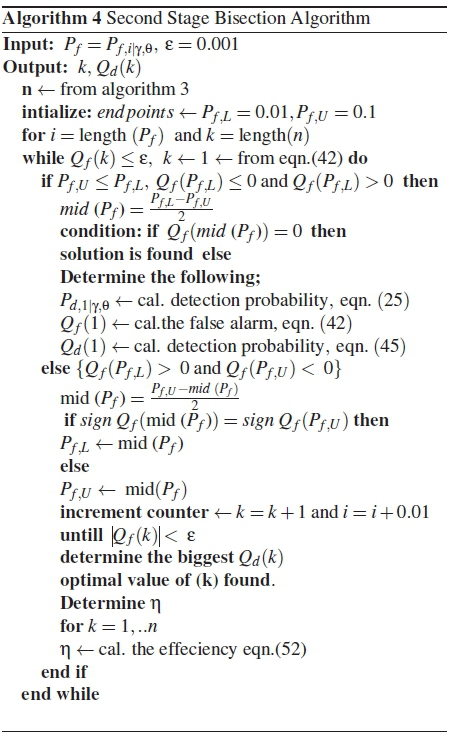
The global probability of false alarm Qf based on k out ofn counting rule is formulated in algorithm 3 and mathematically derived as
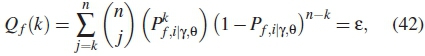
where ε is the utilization level, k is number of SUs selected to participate in the k out of n fusion process, n is number of SUs iteratively found in the first optimization stage in section 5.2. The derivative of global probability of false alarm (Q f) as function of (Pf) is derived as
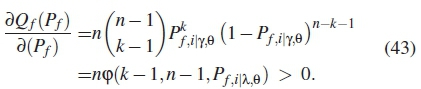
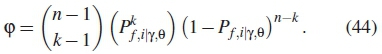
From equation (43) it follows that cp is the binomial cumulative function give as
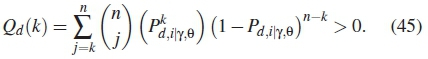
Subsequently the global probability of detection in k out of n case is given as
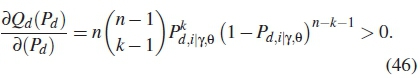
To optimize equation (45), we differentiate by parts the function as follows
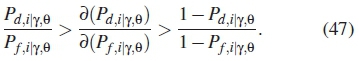
From equations (25) and (26) the following probabilities must hold true.
Similarly the above equation can be further formulated as follows
From the above equation it is true to say Qd (k) is linearly increasing function of Qf (k). For all k Є [1,n] then the roots of Qf (k, Pf) are formulated in Bisection algorithm 3. The algorithm is broken down as follows, for each  determine the corresponding Pd,i|y,0 and Qd(k, Pf), select the highest global probability, the value of k is the optimal number of SUs.
6. ENERGY EFFICIENCY
Energy efficiency is the ratio of throughput to average energy consumed during the cooperative spectrum sensing time. The throughput (THR) is formulated as [21,23]
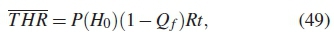
where R is the data rate, t is the transmission time length, P(H0) is the probability that the spectrum is not being used, Q f is the global probability of false alarm. The average energy consumed in the network by all SUs Ecis derived as

where n is the total number of SUs selected from first optimization stage, esuis the energy consumed during CSS by all the SUs, estis the energy consumed during data transmission, Pu is the probability of identifying if the spectrum is idle, given as

where P(H1) = 1 - P(H0) is the probability of the spectrum being used, Q f is the global probability of false alarm and Qd is the probability of detection. Note that the energy consumption during transmission occurs only ifthe spectrum is identified as unused. The efficiency (n) can be formulated as [20, 21]
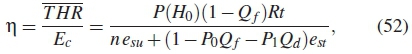
where n is number of SUs in equation (52), computed as
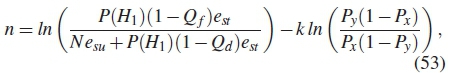
where N is the total SUs in CSS network, k is the number of SUs in the k out ofn counting rule. A noisy channel is modeled as binary symmetric channel with error probability ( Pe) and it is the same among all SUs.  is the probability of receiving a local binary decision of 1 when the spectrum is busy and
  is the probability of receiving a local binary decision of 1 when the spectrum is idle.
7. SIMULATION RESULTS
In order to evaluate the HOS test for cooperative spectrum sensing capability, we considered a cognitive radio network with 15 SUs transmitting on 16 QAM constellation modulated signal built in matlab software for simulation and analysis. It should be noted that any other modulation scheme can be used to model the PU signal. In all subsequent figures, the numerical results are plotted on receiver operating characteristics curves (ROC). Simulation results are denoted with discrete marks on the curves. The simulation parameters are give in table 2.
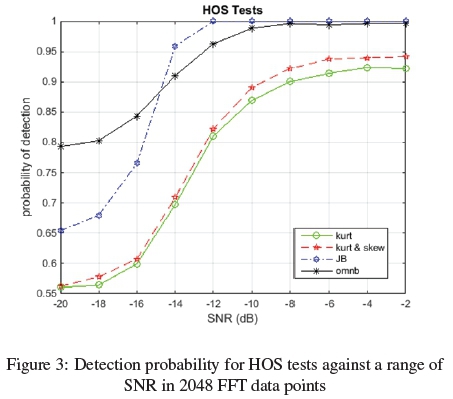
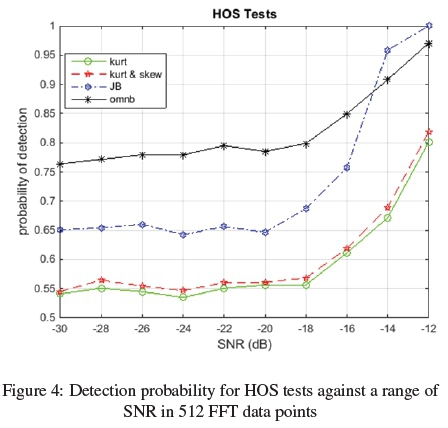
In figure 3, the ROC curves show the performance of omnibus (omnb), Jarque-Bera (JB), kurtosis & skewness (kurt & skew) and kurtosis (kurt) test statistics as function of the SNR. In this scheme 2048 FFT sample points were considered. From the plot, as expected the probability of detection increased with increase in SNR starting from a low SNR. The omnb test displayed the highest probability of detection progressively from a low SNR up to about -16 dB. The plot shows that omnb perform better at low SNR. This was followed by JB, then kurt & skew. The results of the other HOS tests are close to those in [9,10,20]. In figure 4, the graph illustrates performance of the four HOS test considered under a smaller data sample of 512 FFT points. The plot shows omnb still has higher detection probability for all ranges of SNR and even better under extremely low SNR (-30dB). The omnb test technique therefore tends to suppress the Gaussian noise showing an improved performance. From the two results displayed in figures (3) and (4), it can be concluded that omnibus is a superior statistical test for both small and big data sample at low SNRs.
In figure 5, the performance of optimal k out ofn counting rule based on all HOS tests is displayed. The rules are for omnibus and majority rule (omnb and maj), Jarque-Bera and majority (JB and maj), kurtosis & skewness and majority (kurt & skew and ma j). The optimal number of 8 out of 10 SUs was realized through a two stage optimization as given in algorithms (3) and (4). From ROC curves it can deduced that a combination of omnb and ma j displayed a higher probability of detection for a false alarm of less than 0.1. This is as per the requirement of IEE 802.22 standards [17]. The performance was then followed by JB and ma j and lastly kurt & skew and ma j. Figure 6, shows a comparative performance HOS based optimal majority rules; omnb and ma j, JB and ma j, kurt & skew and maj and lastly kurt and maj. The optimal number of 8 out of 10 SUs was realized in the algorithm 3. From the plot, it can be deduced that omnb and ma j combination strategy displayed the lowest probability of misdetection for all values of probability of false alarm as compared to the three other combinations. In conclusion, based on the figure (5) and (6), omnb and ma j rule showed the highest probability of detection and the lowest misdetection as compared to all the other HOS based majority rule for all ranges of false alarm.
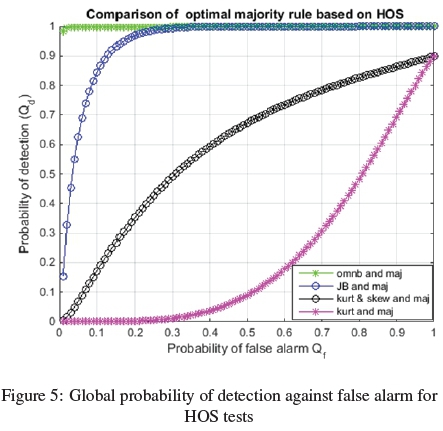
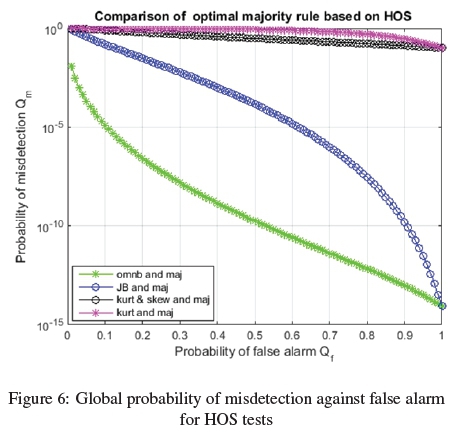
Figure 7, shows the performance of hybrid sensing scheme of k out of n counting rule based omnibus test for different numbers of SUs was investigated. The plot showed the comparative performance of different numbers of SUs as selected in single stage compared to two stage optimization. Where n = 10, k = 5 and k = 8 respectively. From this plot, it can be deduced that omnibus a local detection test based on a two stage optimization global detection scheme displayed higher probability of detection to that of single stage optimization for all ranges of false alarm.
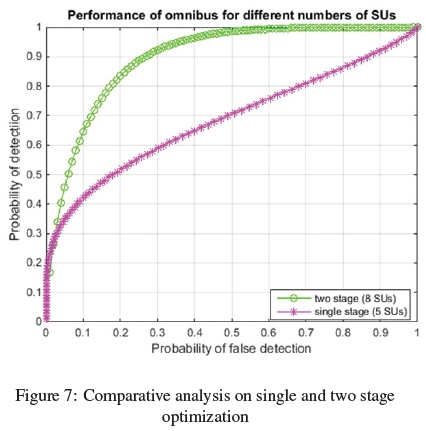
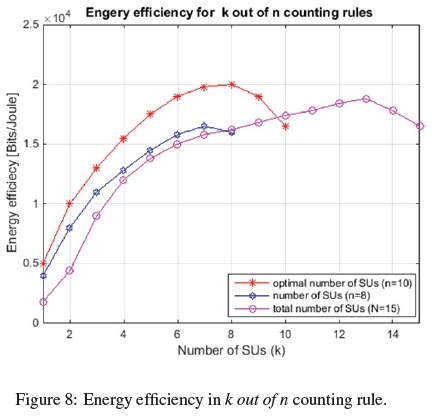
Figure 8, shows the energy efficiency for the different k out of n counting rules representing three scenarios. The first case is when all the SUs in the cooperative spectrum sensing N = 15 participate in the detection of the PU. The second case is when an optimal number of SUs as found in the first optimization stage n = 10 and the third case is when n = 8 just for the purpose of benchmarking. From this plot the optimal case showed the greatest energy efficiency of about 2 * 104 Bits per Joule. This was achieved when k = 8 SUs in the combinatorial order of 8 out o f10 counting rule. Note that due to the k out ofn rule the number of k can only go up to n number of SUs.
8. CONCULSION
In our proposed hybrid model, an optimal k out ofn based omnibus (K2) statistics test was shown to be more superior to the other HOS tests. This model would be preferred to detect the PU in cognitive radio networks operating under noisy conditions. Another advantage of this model is the overall reduction in energy consumption in the network due to the two stage optimization. Fewer SUs make the final decision on the status of the PU on the channel but still maintain reliable decision outcomes.
REFERENCES
[1] Li, Hongjuan and Cheng, Xiuzhen and Li, Keqiu and Hu, Chunqiang and Zhang, Nan and Xue, Weilian: "Robust collaborative spectrum sensing schemes for cognitive radio networks", IEEE Transactions on Parallel and Distributed Systems, Vol. 25, No.8 pp. 2190-2200, April 2014. [ Links ]
[2] S. Althunibat, M. Di-Renzo, and G. Fabrizio: "Towards energy-efficient cooperative spectrum sensing for cognitive radio networks:An overview ", Telecommunication Systems, Vol. 59 No. 1, pp. 77-91, May 2015. [ Links ]
[3] I. F. Akyildiz, L. F. Brandon and B. Ravikumar: "Cooperative spectrum sensing in cognitive radio networks: A survey", Physical communication, Vol. 4 No. 1, pp. 40-62, March 2011. [ Links ]
[4] S. Suresh, P. Shankarand M. R. Bhatnagar: "Kurtosis based Spectrum Sensing in Cognitive Radio ", Elsevier Journal on Physical Communication, Vol. 5 No. 3, pp. 77-91, January 2012 [ Links ]
[5] T. Tsiftsis, F. Foukalas, G. Karagiannidis, and T. Khattab: "On the higher-order statistics of the channel capacity in dispersed spectrum cognitive radio systems over generalized fading channels", IEEE Transactions Vehicular Technology, Vol. 65 No. 5, pp. 3818-3823, May 2016. [ Links ]
[6] D. H. Mohamed, S. Aissa, and G. Aniba: "Equal gain combining for cooperative spectrum sensing in cognitive radio networks", IEEE Transactions on Wireless Communications, Vol. 1 No. 9, pp. 1-12, April 2014. [ Links ]
[7] S. Attapatu, C. Tellambura, and H. Jiang: "Energy Detection Based Cooperative Spectrum Sensing in Cognitive Radio Networks", IEEE Transactions on Wireless Communications, Vol. 10 No. 4, pp. 1232-1241, April 2011. [ Links ]
[8] E. Ataollah, M. Najimi, S. Mehdi, H. Andargoli, and A. Fallahi: "Sensor Selection and Optimal Energy Detection Threshold for Efficient Cooperative Spectrum Sensing", IEEE Transactions on Vehicular Technology, Vol. 64 No. 4, pp. 1565-1577, April 2015. [ Links ]
[9] L. Ma, L. Peng, M. Ji, Y. Jing, B. Niu: "Robust Spectrum Sensing for Small-Scale Primary Users under Low Signal-to-Noise Ratio", IEEE International Conference on High Performance Computing and Communications, Vol. 2 No. 8, pp. 1566-1570, November 2013. [ Links ]
[10] J. S. Rocha, J. Ewerton, P. de-Francis, M. S. de-Alencar: "Spectrum sensing based on statistical test of Jarque-Bera for different modulation schemes", Journal of Microwaves Optoelectronics Application, Vol. 14 No. 2, pp. 240-248, September 2015. [ Links ]
[11] M. Panagiotis: "Three different measures of sample skewness and kurtosis and their effects on the Jarque Bera test for normality", International Journal of computational Economics and Econometrics, pp. 1-21, January 2011.
[12] G. Poitras: "More on the correct use of omnibus tests for normality", SEconomics Letters, Vol. 90 No. 3, pp. 304-309, March 2006. [ Links ]
[13] S. Sesham, A. Mishra, Kumar and Farooq, Shiba: "Cooperative sensing throughput analysis over fading channels based on hard decision", International Conference on Computer and Communications Technologies (ICCCT), 2014, pp. 1-5, December 2014.
[14] J. W. Lee: "Cooperative Spectrum Sensing Scheme over Imperfect FeedbackChannels", IEEEcommuni-cations Letters, Vol. 17 No. 6, pp. 1192-1195, June 2013. [ Links ]
[15] D. O. Chan, H. C. Lee and H. L. Yong: "Linear Hard Decision Combining for Cooperative Sensing in Cognitive Radio Systems", Vehicular Technology Conference Fall (VTC2010-Fall), pp. 1-5, September 2010.
[16] Q. Liu, J. Gao and c. Lesheng: "Optimization of Energy Detection Based Cooperative Spectrum Sensing in Cognitive Radio Networks", 2010 IEEE international conference on wireless communication and signal processing, pp. 1-5, October 2010.
[17] K. H. Chang: "IEEE Wireless Communications", IEEE 802 Standards for TV White Space, Vol. 21 No. 2, pp. 4-5, April 2014. [ Links ]
[18] F. Liu, J. Wang, Y. Han, H. Peng: "Joint Optimization for Cooperative Spectrum Sensing in Cognitive Radio Networks", 2012 8th international conference on wireless communications, networking and mobile computing, pp. 1-4, September 2012.
[19] L.Xin, M. Jia, and T. Xuezhi: "Threshold optimization of cooperative spectrum sensing in cognitive radio networks", Radio Science journal, Vol. 48 No. 1, pp. 23-32, February 2013. [ Links ]
[20] R. Saifan, G. Al-Sukar, R. Al-Ameerand and I. Jafar: "Energy efficient cooperative spectrum sensing in cognitive radio", International Journal ofComputer Networks & Communications (IJCNC), Vol. 8 No. 2, pp. 13-24, March 2016. [ Links ]
[21] S. Althunibat, D. M. Renzo and G. Fabrizio: Optimizing the K-out-of-N rule for cooperative spectrum sensing in cognitive radio networks, Global Communications Conference (GLOBECOM), 2013 IEEE, pp. 1607-1611, December 2013.
[22] S. Shanthan, S. Prakriya and M. R. Bhatnagar: "Kurtosis based spectrum sensing in cognitive radio", Physical Communication, Vol. 5 No. 3, pp. 230-239, September 2012. [ Links ]
[23] M. Zheng, L. Chen, W. Liang, H. Yu, J. Wu: "Energy-efficiency maximization for cooperative spectrum sensing in cognitive sensor networks", IEEE Transactions on Green Communications and Networking , Vol. 1 No. 1, pp. 29-39, March 2017. [ Links ]

