


Serviços Personalizados
Artigo
 Inglês (pdf)
 Artigo em XML
 Referências do artigo
Indicadores

Links relacionados
-
 Citado por Google
 -
 Similares em Google
Compartilhar

 Permalink
SAIEE Africa Research Journal
versão On-line ISSN 1991-1696
versão impressa ISSN 0038-2221
SAIEE ARJ vol.108 no.3 Observatory, Johannesburg Set. 2017
Analysis of Bursty impulsive noise in low-voltage indoor power line communication channels: local scaling behaviour
Mike O. AsiyoI; Thomas J.O. AfulloII
IDiscipline of Electrical, Electronic & Computer Engineering, School of Engineering, University of KwaZulu Natal, Durban, 4041, South Africa E-mail: mikeoasiyo@ieee.org
IIDiscipline of Electrical, Electronic & Computer Engineering, School of Engineering, University of KwaZulu Natal, Durban, 4041, South Africa E-mail: afullot@ukzn.ac.za
ABSTRACT
Power line communication (PLC) channels are prone to multipath propagation due to impedance mismatch, and impulsive noise whose characteristics are still not well established in the literature. Moreover, measurements show that this impulsive noise appear in bursts, non-Gaussian and cyclostationary and as such cannot be modeled as the convenient additive white Gaussian noise (AWGN). Transceivers optimized for AWGN may not necessarily perform well for the PLC noise. Therefore, investigating the characteristics of PLC noise is very important for accurate modeling of the same. This study presents multifractal analysis of bursty impulsive noise measured from power line networks from three different environments. We employ multifractal detrended fluctuation analysis, which is a well-developed multifractal analysis technique for non-stationary time series data and easy to implement to analyze measured noise data. Results show that power line noise exhibits both long-range dependence (LRD) and multifractal scaling behavior with different strengths depending on the environments where they were captured. The multiscaling behavior is due to long-range correlation inherent in the power line noise. The source of this local multiscaling behavior is determined by analysis a shuffled series of the original data captured from the power network. Multifractal analysis is able to show clearly both the strengths and frequency of occurrence of bursts occurring in PLC noise which can then be applied in accurate modeling of the noise. The significance of these results is that new power line noise models should be developed that captures both LRD and multifractal scaling for more accurate performance evaluation of power line communication systems. The existing noise models though able to replicate temporal dependence of PLC noise, are not able to capture this local scaling behavior which results show is inherent in PLC noise.
Key words: Power Line Channels, Bursty Impulsive Noise, Long range temporal correlations, Multifractal Analysis.
1. INTRODUCTION & MOTIVATION
Power line communication (PLC) is becoming popular for broadband applications, multimedia sharing and is part of smart grid systems due to its ubiquitous nature and it is economically viable since no extra wiring is required for communication purposes. However, like any other communication channel, PLC has challenges of multipath (due to impedance mismatch), path loss and impulsive noise [1, 2]. As such high speed data transmission is still a daunting task. The most difficult challenge is characterizing and modelling the PLC noise.
Noise in power line communication networks is non-Gaussian and as such can not be modelled as the convenient additive white Gaussian noise. The noise is known to be impulsive and in most cases, occur in bursts. Therefore, it can be referred as bursty impulsive noise [3]. Due to unique nature of this noise in power line channels, modulation and decoding schemes optimized for Gaussian channels may not necessarily work well in PLC systems. This has contributed to the increased growth in the interest of PLC noise modelling and analysis. PLC noise is generated from within and without the network and can be classified into: coloured background noise, narrowband interference, periodic impulsive noise synchronous to mains, periodic impulsive noise asynchronous to mains, and asynchronous impulsive noise [4]. For convenience in modelling, these five groups are normally classified into two major groups; background noise and impulsive noise [4-6].
A recent survey on impulsive noise modelling groups the models into models with memory and those without memory [7]. The popular memoryless models are Bernoulli-Gaussian, Middleton Class A and symmetric Alpha-Stable distribution models [6,7]. Even though the memoryless models are able to capture the non-Gaussian and impulsive nature of PLC noise, they fail to capture the temporal correlation that is inherent in PLC noise. To model this temporal correlation, Markov chain based models have been developed. A partitioned Markov chain model was developed in [4] which is able to capture the bursty nature of PLC noise by considering impulsive states and impulsive free states. This model is a generalization of Gilbert-Eliott model [8]. The main challenge with this model is that it has binary output and is only suitable for binary communication channels. In [5], a Markov-Gaussian model is developed from the same principle as the Bernoulli-Gaussian model, but with an additional parameter which quantifies the channel memory. Even though Markov-Gaussian model is a continuous noise model, its main drawback is that it is restricted to only two states: impulsive free and impulsive sequence states. In each of the states, noise samples follow Gaussian distribution with impulsive states having noise variance which is very high compared to the variance of the impulsive free state.
The authors in [3] extended Middleton Class A model by incorporating an additional parameter that allows for controlling noise impulse memory. The model known as Markov-Middleton introduces noise memory through hidden Markov chain and it is a continuous noise model with finite states and the same PDF as the Middleton Class A model. In each of the finite states, the noise variance is a function of the physical parameters of the noise (number of simultaneous impulsive emissions, impulsive index and strength of the impulsive noise). The noise can be assumed to be a superposition of impulsive source emissions that are Poisson distributed both in space and time and have temporal correlation. In all the memory models, the additional parameter capturing the noise memory is determined from noise measurements and details can be found in [4], [5] and [3].
There are also other studies on the characteristics of PLC noise which have concentrated on amplitude distributions, impulse width and impulse rate (see [4, 9-12]) without considering much the frequency and strength of bursts which are prevalent in PLC noise and impacts heavily on communication system development and performance analysis. Even though our interest is on indoor low-voltage PLC applications, it should be noted that impulsive noise is a challenge even in other applications (e.g., see [13]). A shift of focus has recently turned into models and analysis considering the cyclostationary nature of PLC noise [14-19]. This resurgence of interest in PLC noise modelling shows the importance as well as complexity of noise experienced in power line channels.
Fractal structure of PLC noise and its impacts on PLC systems is not yet well published in the literature. The authors in [20] have done studies on self-similarity and fractal analysis of PLC noise and they observe that PLC noise exhibits long-range dependence (LRD). Long-range dependence can be determined by estimating the Hurst parameter H, which is a measure of intensity of LRD. LRD measures high variability in flow or arrival in time series data/signal. There is a relationship between channel memory and H parameter. The questions that this studies is trying to answer is whether the Hurst parameter (derived from second order moment) alone is good enough to characterize the correlation structure of PLC noise. In other words, in this study, we perform multifractal analysis to PLC noise measured from three different locations (University Electronic Laboratory, Postgraduate Office, and stand-alone Apartment). Multifractal analysis is superior to LRD analysis. It is a statistical tool that is able to measure the frequency with which bursts of different strengths occur in a signal [21].
Multifractal theory is a well developed technique and has been used in various fields in analysis and modelling of scaling behaviour of measures/functions in time series processes. Some of the signal and processing analysis based on multifractal include bit error rate process analysis of 11 Mbps wireless MAC-to-MAC channels [22], internet traffic and network traffic measurement estimations [21, 23], image feature extraction [24], stock market analysis [25,26], biomedical analysis [27,28] and so on. We stress that in this study, noise model is not being developed, but the study is concerned with investigating multifractal nature of PLC noise and the origins of these multifractals in PLC noise. Noise model that captures the multifractal nature of PLC noise and its impact on the performance analysis of PLC systems is still work in progress and will be published later. To the best of knowledge of the authors, this is the first paper addressing the issue of multifractal analysis of PLC noise and sets a very good background into multiplicative cascades modelling of PLC noise.
The rest of paper is organized as follows: Section 2. details the methodology employed in this study; Section 3., the procedure for obtaining noise measurements used in the study is outlined and noise measurement samples are also provided to show the different data being analysed. Results and discussion are in Section 4., where we specifically show that PLC noise is long-range correlated and exhibits multifractal scaling behaviour. The models discussed from the previous section even though have been extensively utilized in error performance analysis in PLC networks, they do not capture this new finding. In Section 5., conclusion of the paper is presented with a proposal for further study emanating from the results in this paper.
2. MULTIFRACTAL ANALYSIS
Multifractal spectrum provides a good measure of characterizing non-stationary time series signals. Methods for estimating multifractal spectrum are well developed and continue to excite much research. Selection of methods to be used for analysis depend on the required precision, type of data and computational speed [24]. Moreover, the methods are not equivalent and quite often produce different results. The interest is normally to extract fractal/multifractal properties of a given signal rather than seeking for exact fractal dimension. Among the well developed and most accurate is the wavelet transform modulus maxima (WTMM) [29-32]. However, its computational cost is the major hindrance to its application.
This paper is an extension of [33] in which preliminary results of multifractal analysis were reported. Here we apply two methods: multifractal detrended fluctuation analysis (MDFA) [34] and multifractal detrending moving average analysis (MDMA) [26]. Their choice is due to ease of implementation and fast computational applicability. Again, their accuracy have been seen to be comparable to WTMM [34, 35]. Both have been developed for non-stationary time series signals and there are MATLAB codes available on-line that can be modified by the ntended users for their implementation [26,36].
2.1 Autocorrelation Function
Autocorrelation function (ACF) can be a good starting point for correlation analysis of time series data. It provides correlation of ith measurement with that of ( i + l)the one for different time lags l. It can be used as a preliminary indicator of existence of long-range dependence in a time series data. Considering a time series lata  with i = 1,..., N, N representing the length of the series, the auto-covariance function is given by
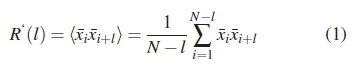
Where  and
and  is the mean of the series
 . The ACF Rxx(l) is then given by R(l) normalized by the ariance of the series (
 ). The time series is short range dependent when its ACF declines exponentially
 When ACF declines as power-law
  then the series is said to have long-range dependence.
Due to unknown trends and noise in time series data, direct Calculations of Rxx(l) is usually not advisable. Moreover, autocorrelation analysis and power spectrum analysis fail to capture the correlation behaviour in most non stationary time series due to unknown trends that might be in the ime series. However, there are methods available for determining the local scaling behaviour of time series data. These methods differ in the way fluctuations are determined and the type of polynomial trend eliminated in :ach window size [37].
2.2 Multifractal Detrended Fluctuation Analysis
Multifractal Detrended Fluctuation Analysis is a generilization of DFA to cater for non-stationary time series data and the procedure consists of five steps [34]. Let us consider a series xiof length n and is of compact support, he procedure for MDFA involves the following: The first tep involves the construction of time series 'profile' (this step converts the noise time series to random walk-like series) from the original data as
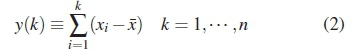
where  is the mean of the time series.
On the second step, the profile y(k) is then divided into ion-overlapping segments of equal length s, that is, ns =int(n/s). If the length n of the series is not a multiple of s, then a small portion of it may remain. To utilize this portion also, the procedure is repeated from the opposite end, making 2ns segments altogether.
In the third step, local trend for each of the 2ns segments s determined by least-square fit of the series. Then the variance is determined as
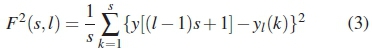
for each segments, l = 1 , , ns and,
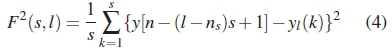
for each segments l = ns + 1,...,ns, where yl(k) is the polynomial fit in segment l.
The qth order fluctuation function can then be obtained by averaging of all the segments in the fourth step as
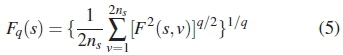
where q is a variable that can take any value apart from zero. Steps (2) to (4) are repeated for several different time scales s.
The last step is to determine the scaling behaviour of the fluctuation functions by plotting on log-log scale Fq(s) versus scale s for each value of q. If the time series exhibits long-range correlation, then Fq(s) increases with increase in scale s as a power-law
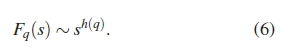
The multifractal scaling exponent h(q) in (6) is known as generalized H exponent and is the well-known H parameter for q = 2 for stationary time series. For monofractal series, the exponent h(q) is independent of q and it is dependent on q for multifractal time series data. Multifractal scaling exponent h(q) is related to standard multifractal formalism scaling exponent π(q) as
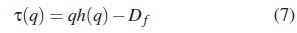
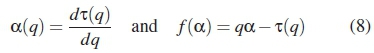
where Df is the fractal dimension of the geometrical support of the multifractal measure and for time series data, Df = 1 [34] [26]. For multifractal time series, α(q) is a non linear function of q. An alternative way of characterizing multifractal series is by the singularity strength function α(q) and the multifractal spectrum function f (α) [26,34] via Legendre transform
2.3 Multifractal Detrending Moving Average Algorithm
Multifractal detrending moving average (MDMA) algorithm [26] is a generalization of the detrending moving average (DMA) algorithm [38] initially designed for fractal analysis for non-stationary time series data. MDMA was developed to analyse both multifractal time series and multifractal surfaces. Its algorithm can be summarized as follows [26].
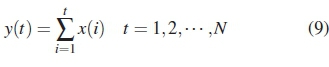
The first step is to construct a sequence of cumulative sums y(t) assuming a time series  , where N is the length of the time series, i.e.,
The second step is to determine the residual sequence by detrending the signal series by subtracting the moving average function from the cumulative sums series computed in step one.
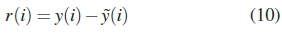
where 
 is the moving average function in a moving window,
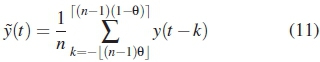
where n is the window size and θ is a parameter determining the position of the window. θ takes values in the range [0,1]. Mostly, three special cases are normally considered, namely, θ = 0 (backward moving average), in which the moving average function is calculated over the past n - 1 data points of the signal. The second case is for θ = 0.5 (centred moving average) for which moving average function is calculated over half past and half future data points of the signal. The last case is when θ = 1 (forward moving average) on which the moving average function is calculated on n - 1 data points of the signal in the future.
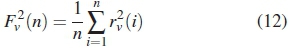
In the third step, the residual sequence r(i) is divided into N non overlapping segments of the same size n, where N = [N/n - 1]. Denoting each segment by rv, the root-mean-square function Fv(n) can be calculated by
The forth step involves determining the qth order overall fluctuation function Fq(n) as
Finally, in the last step, the values of segment size n can be varied to determine the power-law relation between the function Fq(n) and scale n as
When h(q) has been estimated, then scaling exponent dependent on q can be determined from (7). Similarly, singularity strength and multifractal spectrum can be estimated from (8).
3. MEASUREMENT SET-UP AND ACQUISITION PROCEDURE
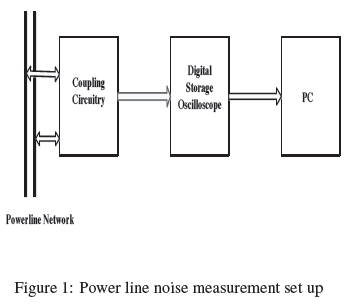
Characterization and modelling of noise present in power line communication system requires rigorous noise measurement campaign. For this study, PLC noise measurements were recorded using the set up shown in Figure 1. The set up comprises a coupling unit used for protecting Digital Storage Oscilloscope (DSO) from high power network currents. The coupling unit also acts like a high pass filter, allowing only signals of interest to pass through. The DSO employed here as a receiver is capable of recording 14 million data point samples and was set to sample noise at a rate of 50 Mega-samples per second. This implies that we are able to capture noise from lower cut-off frequency of the coupling unit (100 KHz) to 25 MHz frequency range.
Three scenarios are used in this study. First, noise measurements was done in one of the postgraduate study offices with electrical loads being fluorescent lights, desktop computers and air conditioners. Sample is shown in Figure 2(a). It should be noted that these electric loads are the PLC noise generators and the adjacent offices connected to the same bus-bars have similar loads. Secondly, noise from Electronic Laboratory (Figure 2(b)) was measured when students were undertaking their practicals. In addition to fluorescent lights and air conditioners, electronic loads with components like SCRs and measurement equipment were connected to the power network. Lastly, PLC noise was measured in a stand-alone five bedroomed apartment (Figure 2(c)). The electrical loads here include lights, television set, washing machine, two fridges and a vacuum cleaner. The first two scenarios are situated within University of KwaZulu Natal and the third one is located away from the University. These scenarios are just representatives of actual PLC channels and there is nothing so special about their location apart from the different loads in these locations which also act as noise generation sources.


Noise measurements were done when all of these loads were running/switched on, and from Figure 2, it can be seen that each of the different environments generate unique noise samples due to different noise sources. Moreover, the switching times (ON and OFF) of these loads are also random and the noise is expected to show this randomness without correlation. However, previous studies have established that PLC noise though generated from different sources randomly, is correlated as reported in the previous section. It is also known that some extra noise from without the power grid are coupled to the indoor network via conduction or radiation [4].
4. RESULTS & DISCUSSION
4.1 Unfiltered PLC Noise Analysis
Multifractal spectrum and their corresponding q-order dependent scaling exponent estimated from two methods (MDFA and MDMA) for PLC noise data measured from various environments are shown in Figures 3 and 4 respectively. From these figures, it is evidenced that the PLC noise has a scaling behaviour that is sensitive to small fluctuations within its segments. This is characterized by the left truncated multifractal spectrum shown in each of the locations by both the methods. The q-order dependent scaling exponent graphs give an indication that PLC noise is multifractal as the scaling exponent of the original time series data is dependent on q-order of the fluctuations, that is, the scaling exponent is non linear. When the time series data is shuffled, the scaling exponent is more or less linear, which implies monofractal behaviour.
Table 1 and Table 2 respectively provide values of singularity spectrum parameters for Figures 3 and 4. The most important parameter is the spectrum span (Δα = amax - amin) which is a measure of irregularity of the signal/time series. From Table 1, the values of span for noise from various locations show that PLC noise from office has a spectrum distribution which is more non uniform than both noise from laboratory and apartment which seem very close. When the data is shuffled, the span is negligible except for the one of office data. In the office data, the span of original data is 0.93 and that of the shuffled data is 0.41. The implication for these values is that the shuffled data shows weaker multifractal behaviour than the original data. Similar results are seen for noise captured in an apartment, however, for laboratory data, the shuffled series show no evidence of multifracticity.


Results from second method (MDMA) gives an indication that it is the laboratory data that show this weak multifractal behaviour in the shuffled series (Table 2). Since the multifractal behaviour of PLC noise is not yet known, we can not conclude from the results which of the methods gives a better analysis than the other. However, it is evident from the two methods used in the analysis that PLC noise exhibits multifractal behaviour but the nature and source of this behaviour requires further investigation.
Another important parameter of measure is α0. Viewing the singularity spectrum as frequency distribution of singularity strength, α0provides the value of the singularity strength which is most frequent in the distribution. The value of α0provides the measure of correlation characteristics of the signal/time series. Both the methods show that PLC noise exhibits long-range correlation since the most frequent singularity strength ranges between 0.5 and 1.
4.2 Filtered PLC Noise Analysis
PLC Noise that was captured in the frequency band of 0.1 MHz to 25 MHz was decomposed into low frequency (0.1 - 10 MHz) and high frequency (10 - 25 MHz) components. The decomposed components were then analysed by the MDFA technique with a view to investigate multifractal characteristics of these noise components. Interesting results can be seen in Figure 5 where it is seen that the multifractal characteristics of PLC noise in general is mainly being contributed by the low frequency components. In [10], it was reported that noise spectrum has relatively high values at low frequency than at high frequencies. This was attributed to many sources of low frequency noise in the power network and short-wave radios in the low frequency band. We can also conclude from the findings in this study that these low frequency sources are the main contributors of the scaling behaviour inherent in PLC noise. Again, it is known that man-made impulsive noise is mainly in the low frequencies [11] and at these low frequencies, the noise PSD is high [39].
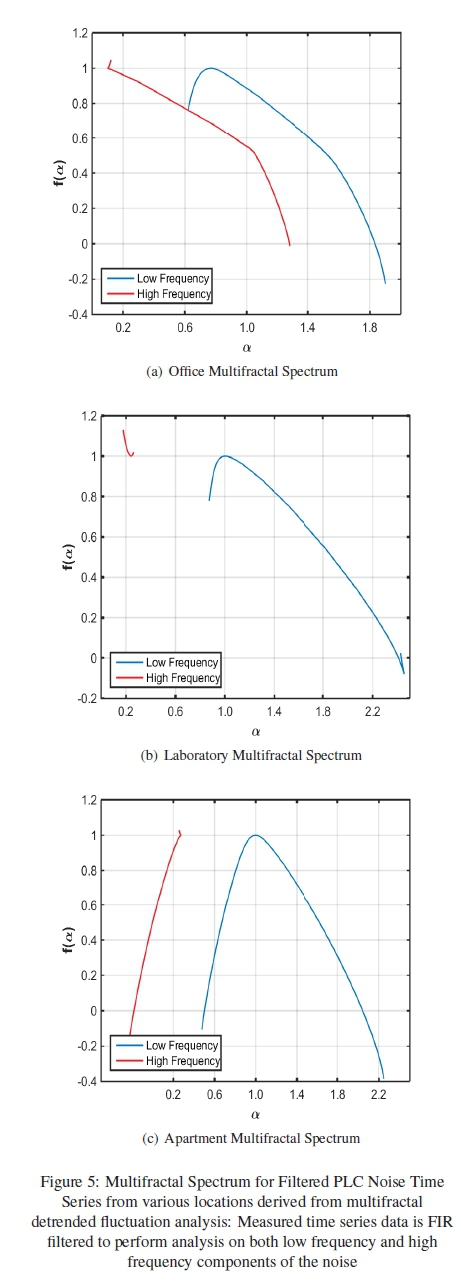
Since the multifractal behaviour of PLC noise is due to bursty impulsive noise, the results showing that low frequency components of PLC noise is more multifractal than the high frequency component (which is monofractal or very weak multifractal for the cases of office and apartment scenarios) is valid. Low frequency components of PLC in from office and laboratory data retain the same shape (left truncated concave shape) of multifractal spectrum as the unfiltered time series data. However, the low frequency component of apartment data has a full concave multifractal spectrum. These results continue to confirm that different locations have sources which contribute to the noise characteristics uniquely. We intend to isolate the individual noise sources and characterise their behaviour according to the frequency and strengths of impulsive noise they generate. Investigating the characteristic of individual noise sources is a common practice in PLC communications and will be an interesting future work.
5. CONCLUSION
Multifractal analysis of PLC noise measured from an office environment, University electronic laboratory and a stand-alone apartment reveal that PLC noise exhibits multifractal behaviour, meaning that it can not be accurately characterized by a single power-law scaling exponent. This multifractal characteristics is mainly encountered in the low frequency band (< 10 MHz) where there are many sources of bursty impulsive noise. Results from the findings also show that PLC noise has long-range dependence behaviour. However, neither of the methods used in the analysis was able to reveal the source of multifractal behaviour seen in PLC noise and hence further analysis will be performed to investigate the source of multifractal behaviour. It will also be interesting to capture noise from individual noise generators and investigate their scaling behaviour. Furthermore, the findings of this study point to the fact that there is need for new models to be developed for PLC noise that will be able to capture more accurately its LRD and multifracticity nature. The impact of these noise characteristics on performance analysis of power line communication systems also needs to be investigated and forms our future research.
ACKNOWLEDGEMENT
This work was partially supported by the School of Engineering, University of KwaZulu Natal.
REFERENCES
[1] M. Zimmermann and K. Dostert, "A multipath model for the powerline channel," IEEE Trans. Commun., vol. 50, no. 4, pp. 553-559, 2002. [ Links ]
[2] L. T. Berger, A. Schwager, and J. J. Escudero-Garzs, "Power line communications for smart grid applications," Journal of Electrical and Computer Engineering, vol. 2013, 2013. [ Links ]
[3] G. Ndo, F. Labeau, and M. Kassouf, "A Markov-Middleton model for bursty impulsive noise: Modeling and receiver design," IEEE Trans. Power Del., vol. 28, no. 4, pp. 2317-2325, Oct. 2013. [ Links ]
[4] M. Zimmermann and K. Dostert, "Analysis and modeling of impulsive noise in broad-band powerline communications," IEEE Trans. Electromagn. Compat., vol. 44, no. 1, pp. 249-258, Feb. 2002. [ Links ]
[5] D. Fertonani and G. Colavolpe, "On reliable communications over channels impaired by bursty impulse noise," IEEE Trans. Commun., vol. 57, no. 7, pp. 2024-2030, Jul. 2009.
[6] S. P. Herath, N. H. Tran, and T. Le-Ngoc, "On optimal input distribution and capacity limit of Bernoulli-Gaussian impulsive noise channels," in Proc. IEEE Int. Conference Commun., 2012.
[7] T. Shongwe, A. J. H. Vinck, and H. C. Ferreira, "A study on impulse noise and its models," SAIEE African Research Journal, vol. 106, no. 3, pp. 119-131, Sep. 2015. [ Links ]
[8] M. Mushkin and I. Bar-David, "Capacity and coding for the Gilbert-Elliot channels," IEEE Trans. Infor. Theory, vol. 35, no. 6, pp. 1277-1290, Nov. 1989. [ Links ]
[9] D. Benyoucef, "A new statistical model of the noise power density spectrum for powerline communication," in Proc. 7th IEEE Int. Symp. Powerline Commun. Applications, vol. 136-141, Kyoto,Japan, Mar. 2003.
[10] H. Meng, Y. L. Guan, and S. Chen, "Modeling and analysis of noise effects on broadband power-line communications," IEEE Trans. Power Del., vol. 20, no. 2, pp. 630-637, Apr. 2005. [ Links ]
[11] T. Guzel, E. Ustunel, H. B. Celebi, H. Delic, and K. Mihcak, "Noise modeling and OFDM receiver design in power-line communication," IEEE Trans. Power Del., vol. 26, no. 4, pp. 2735-2742, Oct. 2011. [ Links ]
[12] J. Yin, X. Zhu, and Y. Huang, "Modeling of amplitude-correlated and occurrence-dependent impulsive noise for power line communication," in Proc. IEEE Int. Conference Commun., 2014.
[13] G. Acciani, V. Amoruso, G. Fornarelli, and A. Giaquinto, "SOM-based approach for the analysis and classification of synchronous impulsive noise of an in-ship PLC system," ISRN Artificial Intelligence, vol. 2012, 2012. [ Links ]
[14] Y. Hirayama, H. Okada, T. Yamazato, and M. Katayama, "Noise analysis on wide-band PLC with high sampling rate and long observation time," in Proc. 7th IEEE Int. Symp. Powerline Commun. Applications, Kyoto Japan, 26-28 Mar. 2003, pp. 142-147.
[15] M. Katayama, T. Yamazato, and H. Okada, "A mathematical model of noise in narrowband power line communication systems," IEEEJ. Selected Areas Commun., vol. 24, no. 8, pp. 1267-1276, Jul. 2006. [ Links ]
[16] J. A. Cortes, L. Deiz, F. J. Canete, and J. Sanchez-Martinez, "Analysis of the indoor broadband power-line noise scenario," IEEE Trans. Electromag. Compat., vol. 52, no. 4, pp. 849-858, Nov. 2010. [ Links ]
[17] K. F. Nieman, J. Lin, M. Nassar, K. Waheed, and B. L. Evans, "Cyclic spectral analysis of power line noise in the 3-200 kHz band," in Proc. 17th IEEE Int. Symp. Powerline Commun. Applications, Johannesburg, SA, 24-27 Mar. 2013, pp. 315-320.
[18] F. Gianaroli, F. Pancaldi, E. Sironi, M. Vigilante, G. M. Vitetta, and A. Barbieri, "Statistical modeling of periodic impulsive noise in indoor power-line channels," IEEE Trans. Power Del., vol. 27, no. 3, pp. 1276-1283, Jul. 2012. [ Links ]
[19] M. Nassar, A. Dabak, I. H. Kim, T. Pande, and B. L. Evans, "Cyclostaionary noise modelling in narrowband powerline communication for smart grid applications," in Proc. IEEE Int. Conf. Acoust. Speech Signal Process., vol. 3089-3092, Kyoto Japan, 25-30 Mar. 2012.
[20] Z. Wang, Y. Zhao, and C. Zhao, "Fractal prediction algorithm of L-PLC channel noise based on phase space reconstruction," in Proc. IEEE International Conference on Intelligent Computation Technology and Automation, May 2010, pp. 343 - 346.
[21] I. W. Lee and A. O. Fapojuwo, "Analysis and modeling of a campus wireless network TCP/IP traffic," Computer Networks, vol. 53, pp. 2674-2687, 2009. [ Links ]
[22] S. A. Khayam, H. Radha, S. Aviyente, and J. D. Jr., "Markov and multifractal wavelet models for wireless MAC-to-MAC channels," Performance Evaluation, vol. 64, pp. 298-314, 2007. [ Links ]
[23] L. Atzori, N. Aste, and M. Isola, "Estimation of multifractal parameters in traffic measurement: An accuracy-based real-time approach," Computer Communications, vol. 29, pp. 1879-1888, 2006. [ Links ]
[24] T. Parrinello and R. A. Vaughan, "Multifractal analysis and feature extraction in satellite imagery," Int. J. Remote Sensing, vol. 23, no. 9, pp. 1799-1825, 2002. [ Links ]
[25] M. Dai, J. Hon, J. Gao, W. Su, L. Xi, and D. Ye, "Mixed multifractal analysis of china and us stock index series," Chaos, Solitons and Fractals, vol. 87, pp. 268-275, 2016. [ Links ]
[26] G.-F. Gu and W.-X. Zhou, "Detrending moving average algorithm for multifractals," Physical Review E, vol. 82, no. 1, Jul. 2010. [ Links ]
[27] O. Dick and I. Svyatogor, "Potentialities of the wavelet and multifractal techniques to evaluate changes in the functional state of the human brain," Neurocomputing, vol. 82, pp. 207-215, 2012. [ Links ]
[28] A. N. Parlon, O. V. Semyachkina-Glushkorskaya, V. V. Lychagor, A. S. Abdurashitov, O. N. Parlova, O. A. Sindeeva, and S. S. Sindeev, "Multifractal characterization of cerebrovascular dynamics in newborn rats," Chaos, Solitons and Fractals, vol. 77, pp. 6-10, 2015. [ Links ]
[29] A. Arneodo, E. Bacry, and J. Muzy, "The thermodynamics of fractals revisited with wavelets," Physica A, vol. 213, no. 1, pp. 232-275, 1995. [ Links ]
[30] A. Arneodo, Y. b'Aubenton Carafa, E. Bacry, P. Graves, J. Muzy, and C. Thermes, "Wavelet based fractal analysis of DNA sequences," Physica D, vol. 96, pp. 291-320, 1996. [ Links ]
[31] J. F. Muzy, E. Bacry, and A. Arneodo, "Wavelets and multifractal formalism for singular signals: Application to turbulence data," Phy. Rev. Letters, vol. 67, no. 3515, 1991. [ Links ]
[32] ______, "Multifractal formalism for fractal sig nals: The structure-function approach versus the wavelet-transform modulus-maxima method," Phys. Rev. E, vol. 47, no. 875, 1993. [ Links ]
[33] M. O. Asiyo and T. J. Afullo, "Multifractal analysis of bursty impulsive noise in low-voltage indoor power line channels," in Proc. Southern Africa Telecommunication Networks and Applications Conference (SATNAC), Fancourt, George, Western Cape, South Africa, 4-7 Sep. 2016, pp. 86-90.
[34] J. W. Kantelhardt, S. A. Zschiegner, E. Koscielny-Bunde, A. Bunde, S. Havlin, and H. E. Stanley, "Multifractal detrended fluctuation analysis of nonstationary time series," Physica A, vol. 316, no. 87, pp. 1-14, 2002. [ Links ]
[35] K. Xu, P. Shang, and G. Feng, "Multifractal time series analysis using the improved 0-1 test model," Chaos, Solitons and Fractals, vol. 70, pp. 134-143, 2015. [ Links ]
[36] E. A. F. Ihlen, "Introduction to multifractal detrended fluctuation analysis in Matlab," Frontiers in Physiology, vol. 3, no. 141, pp. 1-18, Jun. 2012. [ Links ]
[37] E. Koscielny-Bunde, J. W. Kantelhardt, P. Braun, A. Bunde, and S. Havlin, "Long-term persistence and multifractality of ricer runoff records: Detrended fluctuation studies," J. Hydrology, vol. 322, pp. 120-137, 2006. [ Links ]
[38] E. Alessio, A. Carbone, G. Castelli, and V. Frappietro, "Second-order moving average and scaling of stochastic time series," Eur. Phys. J. B, vol. 27, pp. 197-200, 2002. [ Links ]
[39] L. D. Bert, P. Caldera, D. Schwingshackl, and A. M. Tonello, "On noise modeling for power line communications," in Proc. IEEE Int. Symp. Powerline Commun. Applications, Udine, Italy, 2011.

