


Servicios Personalizados
Articulo
 Inglés (pdf)
 Articulo en XML
 Referencias del artículo
Indicadores

Links relacionados
-
 Citado por Google
 -
 Similares en Google
Compartir

 Permalink
Water SA
versión On-line ISSN 1816-7950
versión impresa ISSN 0378-4738
Water SA vol.48 no.1 Pretoria ene. 2022
http://dx.doi.org/10.17159/wsa/2022.v48.i1.3897
RESEARCH PAPER
The effects of dry versus wet season on the performance of a wastewater treatment plant in North West Province, South Africa
S MakuwaI; M TlouII; E Fosso-KankeuIII; E GreenI
IDepartment of Biotechnology, University of Johannesburg, Doornfontein 2028, South Africa
IISchool of Physical and Chemical Sciences, North-West University, Mafikeng 2790, South Africa
IIIDepartment of Mining Engineering, College of Science Engineering and Technology, Florida Science Campus, University of South Africa, South Africa
ABSTRACT
The study was conducted at a wastewater treatment plant (WWTP) in the North West Province of South Africa (SA), to investigate the effect of seasonal variations of rainfall and temperature on the fate of Escherichia coli (E. coli) and on chemical parameters. Both seasons showed variations in terms of rainfall levels and temperature. The average temperatures measured at the final effluent were 14 and 22°C for the dry and wet season, while the rainfall averages ranged between 0.0 and 69.0 mm and 16.0 and 258.9 mm for the dry and wet season, respectively. The impact of rainfall within the two seasons presented a variation in the plant inflow rate of 34 000 and 48 000 m3 during the dry and wet season, respectively. Higher E. coli concentrations were detected before and after chlorination in the wet season (1.86 x 10⁵ and 8.40 x 101 MPN/100 mL) than in the dry season (2.26 x 10⁴ and 5.10 x 101 MPN/100 mL). The recorded values for the chemical parameters in the dry and wet season were within the following ranges: ammonia (0.27 and 3.68 mg/L), chemical oxygen demand (COD) (29.53 and 22.10 mg/L), nitrate (9.21 and 2.40 mg/L) and ortho-phosphate (0.46 and 0.39 mg/L). Though the detections of these indicator parameters were affected differently by the seasonal variations, it is important to note that the efficiency of the WWTP in reducing these indicator parameters proved to be consistent across all seasons, except in the case of ammonia and nitrate. The majority of the studied parameters showed effective compliance when measured against SA regulatory standards (general limits) in both the dry and wet season, with the exception of ammonia during the wet season.
Keywords: influent, effluent, E. coli, chemical parameters, seasonal variation
INTRODUCTION
Wastewater is a matrix consisting of raw sewage from anthropogenic activities (Benit and Roslin, 2015; Mara and Horan, 2003), whereas sewage effluent is defined as treated or untreated wastewater generated from a treatment plant (USEPA, 2009). The effluent is released into surface waters; however, if not sufficiently treated, effluents of poor microbial and chemical quality may be discharged into public waters (Bessong et al., 2009) and therefore negatively impact the river environment. Many communities in South Africa still depend on untreated surface water and groundwater sources for their daily water needs and such water is often contaminated by wastewater effluents (Osuolale and Okoh, 2015). It is therefore imperative that WWTPs discharge high quality effluents to the environment.
One of the main aspects of wastewater treatment is the removal/reduction of constituency contaminants, thus WWTPs are vitally important components meant to protect the ecology of river environments (Osuolale and Okoh, 2015). In wastewater treatment, the presence of pathogenic microorganisms is reflected by indicator microorganisms, and the population densities for these indicator microorganisms represent the extent of pathogenic contamination of the wastewater (Humayun et al., 2015; Rompré et al., 2002; LeChevallier et al., 1996). Escherichia coli is a preferred indicator organism to monitor the bacteriological quality of wastewater (Young and Thackston, 1999). Wastewater disinfection by chlorination is performed to reduce pathogenic microorganisms in the WWTP influent and therefore improve the quality of effluents at reasonable operating costs (Collivignarelli et al., 2017).
In most developing countries, wastewater is insufficiently treated because of a rise in urbanization and population which does not always equate to an increase in wastewater treatment facilities (USEPA, 2009). Historically, conventional WWTP technologies, such as the activated sludge process, membrane bioreactor and membrane separation, have been used globally for nutrient removal in municipal wastewater treatment (Liu et al., 2017; Zhou et al., 2017; Wu et al., 2015). However, the application of these systems is still a challenge, due to issues of poor performance (Liu et al., 2017; Awolusi, 2016; Verhoeven et al., 1999), as a result of the inherent susceptibility to environmental factors such as seasonal changes (Wu et al., 2015). The use of bacteria for reduction of wastewater nutrient constituents depends on water temperature, and therefore it has been hypothesized in the literature that the decrease in such bacterial activity, which then affects the efficiency of conventional technology, is triggered by seasonal changes and can result in the disposal of nutrient-rich effluent (Zulu, 2017).
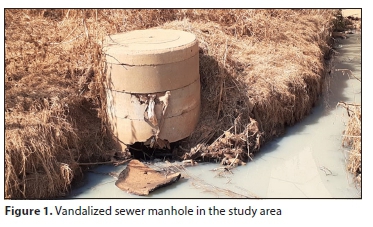
Organic pollutants deriving from anthropogenic activities are the parameters prevalent in the wastewater matrix (Chokwe et al., 2019). Challenges around WWTP efficiency are associated with susceptibility to seasonal variations that alter microbial density in wastewater (Saleem et al., 2000). High flow rates generated by excessive rainfalls can potentially weaken or strengthen the performance of a treatment plant (McMahan, 2006). For a majority of microorganism, growth is directly influenced by temperature (Zhang et al., 2018; Lee et al., 2008); therefore, seasonal changes that result in increased temperature may also directly influence microbial density in wastewater and subsequently the performance of the WWTP in eliminating indicator microorganisms. WWTPs with a high level of pollutants at the influent during the dry season can usually have satisfactory levels of pollutant removal, while influent diluted by stormwater in wet seasons is prone to cause operational issues (Risch et al., 2018; Lorenzo-Toja et al., 2015), and lower treatment efficiency (McMahan, 2006). Infiltration of stormwater into the sewer collection system for a treatment facility occurs during heavy rainfall events through vandalized manholes or leaking pipes (McMahan, 2006). The heavy infiltration of stormwater leads to an uncontrollable flow rate at the wastewater treatment facility, with a high number of pathogen and chemical contaminations generated from stormwater runoff from residential, hospital, industrial and agricultural areas (Reeves et al., 2004; Kistemann et al., 2002; Curriero et al., 2001). This impact to the treatment facility thus advocates for a stringent assessment of the performance of the plants during heavy rainfall events in order to develop appropriate stormwater management policies (McMahan, 2006). However, other studies have reported lower amount of effluent pollutants in wet weather due to the dilution of wastewater by stormwater rainfall ingress (Joel et al., 2017; Li et al., 2017).
Wastewater needs to be adequately treated prior to being discharged into the environment. Thus, the importance of testing for indicator parameters for quality characterization, control and compliance of final effluent with regulatory standards is widely accepted (Power and Boumphrey, 2004). There is a need to improve treatment processes and to adopt stringent policies in terms of monitoring and control of the quality of the final effluent in order to achieve national and international standards (Samie et al., 2009). In South Africa, the compliance of a plant to regulatory standards is recognized and awarded with an incentive-based programme certificate popularly known as a Green Drop certificate (DWA, 2013; Adewumi et al., 2010). The regulatory standards are used to measure the quality of the effluent (Adewumi et al., 2010).
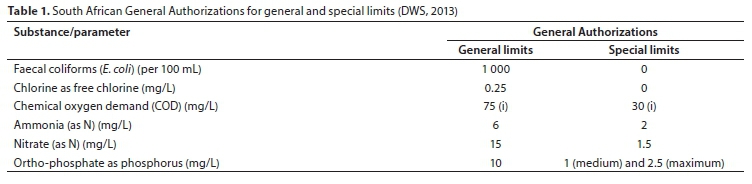
Monitoring of indicator parameters during wastewater treatment aids in assessing the safety of the final effluent before being released to the river. Many studies documented the compliance of wastewater final effluent to regulatory standards; however, little attention has been given to the effect of wet and dry seasonal variation on wastewater treatment. To address this gap, we present herein our findings in this regard. The aim of this study was to assess if the dry or wet season could affect the performance of a WWTP in North West Province, South Africa. To achieve this goal, parameters considered in the South African General Authorizations (GA) for general and special limits were recorded during the dry and wet periods to determine plant performance efficiency.
MATERIALS AND METHODS
Study area
The plant of interest in this study is situated in the North West Province of South Africa. The town where the plant is situated has a population of approximately 124 000 inhibitants and is an industrial and agricultural growth point (Makuwa et al., 2020). The plant therefore receives municipal domestic sewage and wastewater that is heavily influenced by household and industrial water use. The plant is an activated sludge treatment plant. The treatment of physicochemical impurities is done through preliminary, primary, and secondary stages. The secondary stage operates through the following activated sludge configurations: Phoredox and Bardenpho.
There are different disinfection processes for treatment of wastewater in South Africa, of which chlorination is the most common process applied (Bekink and Nozaic, 2012). The plant studied uses chlorine gas as disinfectant. A dosing of 10 kg of chlorine/h is applied across all seasons. Contact time at the tertiary treatment stage is 30 min.
Collection of rainfall data
Rainfall data were obtained from World Weather Online (www.worldweatheronline.com). Rainfall events were identified and categorised based on whether the amount of rainfall was above or below 12.7 mm/d. When the rainfall data showed the highest precipitation rates, comparisons were made between the amounts of effluent collected at the WWTP. Those peak rainfall events resulting in precipitation amounts greater than 12.7 mm were considered to be more likely to influence the wastewater treatment process. Days with precipitation less than 12.7 mm were considered as dry or low rainfall. In the summer rainfall region of South Africa, the rainy season mostly begins in October and lasts through to April with December, January and February being the wettest months (Mengistu et al., 2021; Phakula, 2016), while the dry season is from May to September with June, July and August being the driest months (Phakula, 2016).
Sample collection
A total of 153 and 183 samples were collected between dry (May 2019 - August 2019) and wet seasons (September 2019 - March 2020), respectively. Both raw and treated wastewater samples were collected aseptically using sterile 250 mL and 1 L sampling bottles for microbiological and physicochemical testing, respectively. The sampling containers were washed with soap and water and autoclaved after each use. Samples for determination of chemical parameters were collected at the plant influent (raw sewer) and plant final effluent. Microbiological samples were collected before disinfection (secondary effluent) and after disinfection (final effluent).
Detection of faecal coliforms (E. coli)
The Colilert Quanti-Tray/2000 system as described in Omar et al. (2010) was used for the enumeration of the viable E. coli cells. Enumeration of E. coli was done by using 100 mL water according to the manufacturer's instructions. The Quanti-Trays were incubated for 18-22 h at 37°C. After incubation, the Quanti-Trays/2000 were examined under long wave (366 nm) ultraviolet light, and wells that turned both yellow and fluoresced were counted as E. coli positive (IDDEX). The results of the quantifications were reported as E. coli MPN/100 mL. Population density data for E. coli obtained during the study were fitted to log values for amount of E. coli detected before chlorination because the log values were found to provide the best fit to the microbial population data, while normal values where used for microbial population data after disinfection.
Determination of chemical parameters and temperature
All equipment and meters were verified and calibrated according to the manufacturer's instructions. Ammonia, nitrate, and ortho-phosphate from raw and treated samples were analysed using spectrophotometry model DR3900 (HACH Company, Colorado, USA) and a Gallery Discrete Analyzer Thermo Scientific (Thermo Fisher Scientific, Massachusetts, USA), respectively. Contrary to the number of wet season samples mentioned above, ortho-phosphate was only done in 182 of the samples. COD samples were digested in a Hanna thermo reactor HI 839800 COD reactor (Hanna Instruments, Woonsocket, USA). Temperature was measured at the final effluent using a liquid-in-glass thermometer.
Plant performance efficiency calculation
The South African Department of Water and Sanitation (DWS) General Authorization guidelines (general and special limits) as indicated in Table 1 (DWS, 2013) were used as benchmarks to evaluate the acceptability of the final effluent in both dry and wet seasons. General limits are applicable to WWTPs discharging effluents of less than 2 000 m3 as well as discharging into water resources that are not listed on the regulation, while special limits apply to WWTPs discharging effluents less than 2 000 m3, but discharging into a water resource listed in the regulation (DWS, 2013). The efficiency of the studied plant for the removal of waste matter during wet and dry seasons were calculated using the following equation (Nyamukamba et al., 2019; Agoro et al., 2018):

where Ci is concentration of waste matter in influent and Ce concentration of waste matter in effluent.
Statistical analysis
The data obtained were analysed using GraphPad Prism version 9, where paired and unpaired i-tests were carried out to compare seasonal variations of final effluent parameters and the efficiency of the plant in reducing the studied parameters within the different seasonal months, respectively. The i-test (p < 0.05/5%) was employed to understand the spatial and seasonal variation in the microbiological and chemical concentrations.
RESULTS AND DISCUSSION
Effect of seasonal variations on plant flow rate
Climate is a measure of the weather conditions that are categorically divided into dry and wet seasons. In this study, the period May to September and October to March were selected to represent the dry and wet season, respectively. The dry season is associated with low rainfall and temperature while, the wet season experiences most of the region's average rainfall as well as elevated temperatures. For WWTPs that are linked to stormwater systems the heavy rainfall ingress can influence the inflow rate and, as a consequence, the performance of the treatment plant (McMahan, 2006).
The dry season showed rainfall and temperature ranged from 0.0 to 6.9 mm and 14 to 16°C, respectively, and the wet season rainfall and temperature ranged from 16.0 to 258.9 mm and 19 to 24°C, respectively. In the dry season the plant received an influent volume ranging from 32 000 to 39 000 m3 versus the significantly higher inflow volumes (35 000 to 65 000 m3) for the wet season (see Table 2). The WWTP in this study is not connected to the stormwater system, therefore the increase in the plant influent volume can be attributed to other factors, such as vandalized sewer manholes as indicated in Fig. 1.
Effect of seasonal variations on E. coli reduction and compliance to South African General Authorization standards
A wide range of microbial communities are responsible for making wastewater final effluent unfit to be discharged into the environment. Escherichia coli is a preferred indicator organism to monitor the microbial quality of wastewater (Young and Thackston, 1999). E. coli was chosen amongst the faecal coliforms because it is a more specific indicator of faecal pollution (Cabral, 2010; Jamieson et al., 2002). In this study, a statistically significant difference (p< 0.05) between the E. coli concentration that entered the contact tank before chlorination and the counts in the final effluent (post chlorination) was recorded using a paired i-test (See Table 3).
Higher E. coli counts were detected before and after chlorination in the wet season (1.86 x 10⁵ and 8.40 x 101 MPN/100 mL) than dry season (2.26 x 10⁴ and 5.10 x 101 MPN/100 mL) (Table 4; see Table A1, Appendix, for summary of all data with standard deviations). The high detections of E. coli observed in the wet season versus the dry season were associated with changes in temperature and, to some extent, the flow rate that is influenced by rainfall in the wet season versus dry season (see Table 2). Studies by Oliveira et al. (2020) and Gr0ndahl-Rosado et al. (2014) associated their high bacterial detections with water temperature and heavy rainfall, respectively. Though the study observed a high detection of E. coli during the wet rather than than the dry season for both influent and effluent, reduction of these indicator organisms was efficient and above 99% in all months for both seasons, thus showing a lower if not insignificant impact of seasonal variations on the plant's performance in this regard. The consistent dosing of chlorine across all seasons meant that it is sufficient irrespective of the amount of E. coli coming into the disinfection tank of the plant.
The comparisons of seasonal variations of E. coli discharged into the environment showed statistical differences (p < 0.05) through unpaired i-tests (see Table 5). The detection of E. coli at the final effluents from WWTP(s) presents a major threat to public health (Igbinosa and Okoh, 2009) and possibly indicates the presence of other pathogenic microbes, including viruses and protozoa. It is therefore important to evaluate compliance of the plant's final effluent with South African discharge guidelines (general and special limits) as outlined in the revision of General Authorisations in terms of section 39 of the National Water Act, 1998 (DWS, 2013). Several research studies in South Africa have indicated that most municipal WWTPs infrequently treat their wastewater to acceptable standards (Owoseni et al., 2017; Edokpayi et al., 2015; Momba et al., 2006). However, the plant in this study managed to achieve 153/153 (100%) and 179/183 (97.81%) effluent compliance during the dry and wet season, respectively, while compliance to zero E. coli counts as prescribed by the special limit from the regulatory guidelines saw the final effluent comply in 5/153 (3.27%) and 7/183 (3.83%) occasions in both dry and wet seasons, respectively (see Table 5). The very low compliance for the special limit potentially indicates the presence of disinfection-resistant strains in the final effluent, as the free residual chlorine concentration was mostly recorded at levels above the prescribed value by the regulatory standards. Chlorine resistance by bacteria has been extensively reported and could be a result of the stress-response mechanism (Blyton and Gordon, 2017; Cherchi and Gu, 2011; Krige, 2009) and the involvement of chlorine-resistance genes (Oliveira et al., 2020; Gr0ndahl-Rosado et al., 2014).
Effect of seasonal variations on reduction in chemical parameters and compliance with South African General Authorization standards
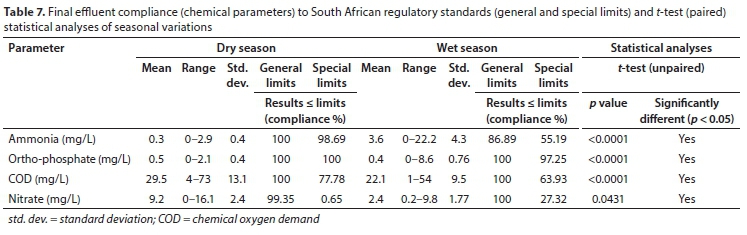
Temperature often influences nutrient removal in wastewater treatment processes. Nitrifying bacteria tend to be more susceptible to temperature variations than phosphate-accumulating organisms (McMahan, 2006). Table 6 (see Table A1, Appendix, for summary of all data with standard deviations) demonstrates the efficiency of the studied WWTP in reducing chemical parameters (ammonia, COD, nitrate and ortho-phosphate), while compliance of these parameters with South African regulatory standards (general and special limits) is shown in Table 7.
Wastewater treatment process ultimately depend on the quality of the influent (Oller et al., 2011). Similar to E. coli, the chemical parameters (ammonia, COD, nitrate and ortho-phosphate) showed statistically significant differences (p < 0.05) for influent versus effluent (paired i-test) (Table 8).
Ammonia
Municipal wastewater treatment plants are designed to leverage the metabolic capabilities of microorganisms to remove excessive chemical constituents such as ammonia from sewage (Johnston et al., 2019). A high ammonia concentration in the influent is associated with ammonia by-products of anaerobic digestion, whilst the low concentration at the effluent point could be attributed to nitrification and de-nitrification processes (Agyemang et al., 2013). The current study observed higher average concentrations of ammonia in the influent in the dry season (43.18 mg/L) than wet season (37.09 mg/L), while final effluent was discharged with 0.27 and 3.68 mg/L in the dry and wet seasons, respectively (Table 6). The reductions in ammonia during the two seasonal variations ranged between 98.57 and 99.77% during the dry season, while wet season reduction ranged between 79.88% and 97.55%. The average reduction between the two seasons was 99.37 and 90.08% for dry and wet seasons, respectively (Table 6).
Contrary to E. coli reduction, the plant did not show any consistency in reducing ammonia across all seasons, however the efficiency of the plant in achieving such high percentage reductions was due to the activated sludge configurations (Modified UCT, Bardenpho and Phoredox) that are designed to reduce nitrate, ammonia and ortho-phosphate (Makuwa et al., 2020; Gernaey and Sin, 2008; Barnard, 1974). Johnston et al. (2019) referred to the discharge of elevated concentrations of ammonia with treated wastewater during winter as 'seasonal nitrification failure.
As indicated in Table 6, the final effluent discharged into the environment contained monthly average ammonia concentrations ranging between 0.09 and 0.57 mg/L in the dry season, while the wet season contained from 0.89 to 7.76 mg/L. Final effluent ammonia concentrations were significantly different (p < 0.05; unpaired i-test) between the two seasons (Table 7). The plant managed to achieve 153 (100%) and 159 (86.89%) incidences of effluent compliance with the general limit of the South African regulatory guidelines for ammonia during the dry and wet season, respectively, while compliance with the special limit was 151 (98.69%) and 101 (55.19%) in both dry and wet seasons, respectively (see Table 7). Less compliance with both general and special limits was observed in the wet than dry season; therefore, the ammonia concentration of the effluent should be continuously monitored in the wet season to avoid the partially treated ammonia entering the river system. A study by Mothetha (2016) shows that the seasonal concentrations of ammonia were within the DWS waste discharge limit of 3 mg/L in all seasons throughout the study period. A study by Agyemang et al. (2013) also found similar trends to Mothetha's (2016) study.
Chemical oxygen demand (COD)
COD is a measure of wastewater quality and is used to monitor WWTP efficiency (Edokpayi et al., 2017). High COD can lead to anaerobic conditions that can be harmful to aquatic life (Mothetha, 2016). Anaerobic treatment uses anaerobic bacteria (biomass) to convert COD into biogas in an oxygen-free environment (Karuppiah and Azariah, 2019). The concentrations of COD entering and leaving the plant were higher in the dry than wet season (Table 6), dissimilar to the trend observed for E. coli. A study by Osuolale and Okoh (2015) observed the highest concentrations of COD in the dry than wet season. According to the findings of Osuolale and Okoh (2015), lower COD concentration is mainly associated with dilution by the higher water flow during the rainy season. Reduction of COD by the plant ranged between 95.45 and 96.13% in the dry season. Wet season COD reductions ranged between 92.56 and 96.55%. There was no significant difference in the reduction of COD, average reductions for dry and wet season were all above 95% (Table 6). A study by Joel et al. (2017) at Boundary WWTP in Eldoret Municipality, Uasin-Gishu County, Kenya, showed COD reductions of 89.23 and 93.91%, respectively, in dry and wet seasons.
The studied plant discharged effluent with COD concentrations from 27.06-33.03 mg/L and 15.32-27.77 mg/L in dry and wet season, respectively. COD concentrations in the final effluent between the two seasons were significantly different (p < 0.05; unpaired i-test) (see Table 7). Wet season (22.10 mg/L) showed slight lower detections in the final effluent compared to dry season (29.53 mg/L). Compared to the findings of this study, Joel et al.
(2017) showed higher effluent discharge concentrations of 169 and 77 mg/L in dry and wet seasons, respectively. Out of the 153 and 183 final effluent samples studied for COD, the plant managed to achieve 100% effluent compliance for both dry and wet season, respectively, when assessed against general limits, while compliance to the special limit was 77.78% and 63.93% in dry and wet season, respectively (see Table 7). Mothetha (2016) observed only one effluent COD above the DWS wastewater effluent discharge limit of 75 mg/L during the dry season. The fact that there were occasions with effluent COD above the special limit suggests that the lower amount of oxidizable organic materials in the water could not reduce the dissolved oxygen levels, thus not leading to anaerobic conditions that are deleterious to higher aquatic life forms.
Nitrate
Similar to COD, nitrate entering and leaving the plant was higher in the dry than wet season (Table 6). Mothetha (2016) observed the highest nitrate concentrations during the dry than wet season for both influent and effluent. Reduction efficiency for nitrate ranged between -22.95% and 17.1% in dry season, while wet season ranges were between 31.94% and 88.32% (Table 6). Kushwah et al. (2011) showed nitrate reduction efficiency of 48.97% and 42.86% in dry and wet seasons, respectively, while the plant in the current study plant achieved a reduction of -2.97% and 65.30% in dry and wet seasons, respectively (Table 6). The dry season average reduction was negative, with higher nitrate concentrations in the final effluent compared to the influent , as also found in a study by Edokpayi et al. (2015). In October, the Modified UCT configuration was changed to Phoredox and the nitrate reduction efficiency was better in the wet than dry season. However, the Phoredox configuration was only introduced in the wet season and the nitrate reduction efficiency can therefore not be linked to seasonal variation.
A higher concentration of nitrate is known to accelerate algal growth causing eutrophication, which consequently leads to an increase in oxygen demand, loss of some aquatic life forms and offensive odours that affect people living very close to the water resource (Alrumman et al., 2016; Palaniappan et al., 2010; Momba et al., 2006; Correll, 1998; Roelofs et al., 1984). Final effluent nitrate concentrations were significantly different (p < 0.05; unpaired i-test) between seasons (see Table 7). The final effluent nitrate contents varied from 7.66 to 11.17 mg/L and 1.19 to 4.71 mg/L in wet and dry seasons, respectively. studied by Kushwah et al. (2011) showed a nitrate discharge ranging from 1.24 to 2.56 mg/L between winter and summer for a WWTP in India. As indicated in Table 7, compliance withgeneral limits for nitrate were 99.35% and 100% for dry and wet season respectively, while poorer compliance was observed with the special limit (0.65% and 27.32% for dry and wet season, respectively).
Phosphate
Phosphate is an essential element for plant life, but when there is too much of it in water, it can speed up eutrophication (Sengupta et al., 2015). When detected at higher concentrations it may interfere with coagulation, thus resulting in organic particles that harbour microorganisms not completely removed (USEPA, 2007). The study observed higher concentrations of phosphate in the dry than wet season at the inlet and outlet (Table 6). Similar findings were also observed by Mothetha (2016). The plant studied by Kushwah et al. (2011) showed reduction of ortho-phosphate by 48.07 and 30.46%, respectively, in dry and wet seasons, while the current study, showed a higher reduction of 92.03 and 92.32%, respectively, for both dry and wet seasons (Table 6). When compared to the study by Mothetha (2016), the the current plant demonstrated efficient reduction of ortho-phosphate in both dry and wet seasons. The reduction efficiency for phosphate could not be associated with any seasonal conditions.
Phosphate concentrations at the final effluent were significantly different (p < 0.05; unpaired i-test) between the two seasons (see Table 7). Ortho-phosphate discharge ranged from 0.36 to 0.61 mg/L and 0.22 to 0.51 mg/L in dry and wet seasons, respectively. Kushwah et al. (2011) confirmed effluent ortho-phosphate concentrations of 5.93 and 10.07 mg/L. As indicated in Table 7, the study observed 100% ortho-phosphate compliance for the final effluent during dry and wet season when evaluated against the general limit, while 100% and 97.25% compliance was achieved when evaluated against special limits in the dry and wet season, respectively. Such findings indicate that the current plant does not contribute to major ortho-phosphate loading of its receiving river when evaluated against South Africa regulatory standards.
CONCLUSION
Seasonal changes can result in the disposal of nutrient-rich effluent to the environment if the WWTP is not managed appropriately. Seasonal variation studies are therefore important to record pollutant levels across various time scales to determine a necessary and efficient treatment processes. Detection ofindicator parameters was shown to be affected differently by seasonal variations. The higher detections of E. coli observed in the wet season were associated with the favorable conditions of the wet season for bacteria. However, contrary to E. coli, a higher concentration of COD, nitrate and phosphate dominated the dry season rather than wet season at both the inlet and outlet of the plant. Such low concentrations in the wet than dry season were due to dilution by high flow rates enhanced by rainfall. Seasonal variations did not affect the performance of the studied plant in reducing the studied parameters, except in the case of nitrate and ammonia. The selection of wastewater treatment processes depends on pollutant levels, hence the substitution of operational configurations from Modified UCT to Phoredox proved to be efficient in reducing nitrates. Determining the pollutant levels in wastewater effluents assists in identifying the necessary improvements to the treatment process. Though challenges have been observed during the two seasons to achieve compliance to special limits, the plant however showed high efficiency in reducing the majority of determinants in line with general limits standards in both seasons. Detection of E. coli in the final effluent reflects the possible discharge of pathogenic microorganisms into the environment; thus compliance to special limits is important. It was also evident that chlorine as the only source of disinfection is not sufficient for the studied plant if the special limit of the General Authorization is to be met.
AUTHOR CONTRIBUTIONS
Conceptualization - SM and EG; methodology - SM, MT, EF-K and EG; validation - SM, MT, EF-K and EG; formal analysis SM, MT, EF-K and EG; investigation - SM; resources - SM and EG; writing - original draft preparation - SM; writing - review and editing - SM, MT, EF-K and EG; supervision - MT, EF-K and EG; project administration - SM, MT, EF-K and EG; funding acquisition - EG. All authors have read and agreed to the published version of the manuscript.
ACKNOWLEDGMENTS
The authors would like to thank the unnamed municipality in North West Province, South Africa, for granting permission to collect samples at their wastewater treatment plant. The authors would like to express their appreciation for financial support from the National Research Foundation (NRF), Grant number 112855 and the APC funded by University of Johannesburg, South Africa. Assistance from Mr MG Matumba with statistical analyses is also acknowledged.
REFERENCES
ADEWUMI JR, ILEMOBADE AA and VAN ZYL JE (2010) Decision support for the planning of integrated wastewater reuse projects in South Africa. Water Sci. Technol. Water Supply. 10 251-267. https://doi.org/10.2166/ws.2010.231 [ Links ]
AGORO MA, OKOH OO, ADEFISOYE MA and OKOH AI (2018) Physicochemical properties of wastewater in three typical South African sewage works. Polish J. Environ. Stud. 27 (2) 491-499. https://doi.org/10.15244/pjoes/74156 [ Links ]
AGYEMANG EO, AWUAH E, DARKWAH L, ARTHUR R and OSEI G (2013) Water quality assessment of a wastewater treatment plant in a Ghanaian Beverage Industry. Int. J. Water Res. Environ. Eng. 5 (5) 272-279. [ Links ]
ALRUMMAN SA, EL-KOTT AF and KESHK SMAS (2016) Water pollution : Source and treatment water pollution : Source & treatment. Am. J. Environ. Eng. 6 88-98. [ Links ]
AWOLUSI OO (2016) Evaluation of seasonal impacts on nitrifiers and nitrification performance of a full-scale activated sludge system. PhD thesis, Durban University of Technology. [ Links ]
BARNARD JL (1974) Cut P and N without chemicals. Water Wastes Eng. 11 (7) 33-36. [ Links ]
BEKINK MJ and NOZAIC DJ (2013) Assessment of a chlorine dioxide proprietary product for water and wastewater disinfection. Water SA. 39 375-377. http://doi.org/10.4314/wsa.v39i3.5 [ Links ]
BENIT N and ROSLIN AS (2015) Physicochemical properties of wastewater collected from different sewage sources. Int. J. Innov. Sci. Eng. Technol. 2 (11) 691-696. [ Links ]
BESSONG PO, ODIYO JO, MUSEKENE JN and TESSEMA A (2009) Spatial distribution of diarrhoea and microbial quality of domestic water during an outbreak of diarrhoea in the Tshikuwi community in Venda, South Africa. J. Health Popul. Nutr. 27 652-659. https://doi.org/10.3329/jhpn.v27i5.3642 [ Links ]
BLYTON MDJ and GORDON DM (2017) Genetic attributes of E. coli isolates from chlorinated drinking water. PLoS ONE. 12 (1) e0169445. https://doi.org/10.1371/journal.pone.0169445 [ Links ]
CABRAL JPS (2010) Water microbiology. Bacterial pathogens and water. Int. J. Environ. Res. Public Health. 7 3657-3703. https://doi.org/10.3390/ijerph7103657 [ Links ]
CHERCHI C and GU AZ (2011) Effect of bacterial growth stage on resistance to chlorine disinfection. Water Sci. Technol. 64 7-13. https://doi.org/10.2166/wst.2011.536 [ Links ]
CHOKWE TB, MAGUBANE MN, ABAFE OA, OKONKWO JO and SIBIYA IV (2019) Levels, distributions, and ecological risk assessments of polybrominated diphenyl ethers and alternative flame retardants in river sediments from Vaal River, South Africa. Environ. Sci. Pollut. Res. 26 (7) 7156-7163. https://doi.org/10.1007/s11356-018-04063-4 [ Links ]
COLLIVIGNARELLI MC, ABBÀ A, ALLOISIO G, GOZIO E and BENIGNA I (2017) Disinfection in wastewater treatment plants: Evaluation of effectiveness and acute toxicity. Sustainability. 9 (10) 1704. https://doi.org/10.3390/su9101704 [ Links ]
CORRELL DL (1998) The role of phosphorus in the eutrophication of receiving waters: A review. J. Environ. Qual. 27 261-266. https://doi.org/10.2134/jeq1998.00472425002700020004x [ Links ]
CURRIERO F, PATZ J, ROSE J, and LELE S (2001) The association between extreme precipitation and waterborne disease outbreaks in the United States. Am. J. Public Health. 91 (8) 1194-1199. https://doi.org/10.2105/ajph.91.8.1194 [ Links ]
DWA (Department of Water Affairs, South Africa) (2013) Notice 169 of 2013. Revision of General Authorisations in terms of section 39 of the National Water Act, 1998 (No. 36 of 1998). Government Gazette No. 36206. Government Printer, Cape Town. [ Links ]
DWS (Department of Water and Sanitation, South Africa) (2013) Municipal and Private Wastewater Systems. Department of Water Affairs, the Green Drop Report; Municipal and Private Wastewater Systems. Volume 1. DWS, Pretoria. [ Links ]
EDOKPAYI JN, ODIYO JO and DUROWOJU OS (2017) Impact of wastewater on surface water quality in developing countries: a case study of South Africa, Chapter 18. Intech Open Science, London. https://doi.org/10.5772/66561 [ Links ]
EDOKPAYI JN, ODIYO JO, MSAGATI TAM and POPOOLA OE (2015) Removal efficiency of faecal indicator organisms, nutrients and heavy metals from a peri-urban wastewater treatment plant in Thohoyandou, Limpopo Province, South Africa. Int. J. Environ. Res. Public Health. 12 7300-7320. https://doi.org/10.3390/ijerph120707300 [ Links ]
GERNAEY KV and SIN G (2008) Wastewater treatment models. In: Encyclopedia of Ecology. Five-Volume Set. Elsevier, Amsterdam. [ Links ]
GR0NDAHL-ROSADO RC, TRYLAND I, MYRMEL M, AANES KJ and ROBERTSON LJ (2014) Detection of microbial pathogens and indicators in sewage effluent and river water during the temporary interruption of a wastewater treatment plant. Water Qual. Expo. Health. 6 (3) 155-159. https://doi.org/10.1007/s12403-014-0121-y [ Links ]
HUMAYUN E, BIBI A, REHMAN AU, AHMAD S and SHUJAAT N (2015) Isolation and identification of coliform bacteria from drinking water sources of Hazara Division, Pakistan. IOSR J Pharm. 5 36-40. https://www.researchgate.net/publication/305477770 [ Links ]
IGBINOSA EO and OKOH AI (2009) Impact of discharge wastewater effluents on the physico-chemical qualities of a receiving watershed in a typical rural community. Int. J. Environ. Sci. Technol. 6 175-182. https://doi.org/10.1007/BF03327619 [ Links ]
JAMIESON R, GORDON R, SHARPLES K, STRATTON G and MADANI A (2002) Movement and persistence of fecal bacteria in agricultural soils and subsurface drainage water: A review. Can. Biosyst. Eng. Genie Biosyst. Can. 44 1-9. [ Links ]
JOEL C, KIPROP EK and MWAMBURI LA (2017) Effect of seasonal variation on performance of conventional wastewater treatment system. J. Appl. Environ. Microbiol. 5 (1) 1-7. [ Links ]
JOHNSTON J, LAPARA T and BEHRENS S (2019) Composition and dynamics of the activated sludge microbiome during seasonal nitrification failure. Sci. Rep. 9 4565. https://doi.org/10.1038/s41598-019-40872-4 [ Links ]
KARUPPIAH T and AZARIAH VE (2019) Biomass pretreatment for enhancement of biogas production. Intech Open. https://doi.org/10.5772/intechopen.82088 [ Links ]
KISTEMANN T, CLABEN T, KOCH C, DANGENDORF F, FISCH- EDER R, GEBEL J, VACATA V and EXNER M (2002) Microbial load of drinking water reservoir tributaries during extreme rainfall and runoff. Appl. Environ. Microbiol. 68 (5) 2188-97. https://doi.org/10.1128/aem.68.5.2188-2197.2002 [ Links ]
KRIGE M (2009) Molecular investigation of the chlorine and antibiotic resistance mechanisms of Escherichia coli isolated from natural water sources in the Western Cape. Master's thesis, Stellenbosch University, Stellenbosch. [ Links ]
KUSHWAH RK, BAJPAIA A, MALIK S and SINGH A (2011) Seasonal variation of physicochemical parameters of waste water from a sewage treatment plant, Bhopal (India). Int. J. Chem. Sci. 9 (3) 1545-1552. [ Links ]
LeCHEVALLIER MW, WELCH NJ and SMITH DB (1996) Full scale studies of factors related to coliform regrowth in drinking water. Appl. Environ. Microbiol. 62 2201-2211. https://doi.org/10.1128/aem.62.7.2201-2211.1996 [ Links ]
LEE J, ZHANG XS, HEGDE M, BENTLEY WE, JAYARAMAN A and WOOD TK (2008) Indole cell signaling occurs primarily at low temperatures in Escherichia coli. ISME J. 2 1007-1023. https://doi.org/10.1038/ismej.2008.54 [ Links ]
LI Y, HOU X, ZHANG W, XIONG W, WANG L, ZHANG S, WANG P and WANG C (2017) Integration of life cycle assessment and statistical analysis to understand the influence of rainfall on WWTPs with combined sewer systems. J. Clean. Prod. 172 2521-2530. https://doi.org/10.1016/j.jclepro.2017.11.158 [ Links ]
LIU J, WU Y, WU C, MUYLAERT K, VYVERMAN W, YU HQ, MUÑOZ R and RITTMANN B (2017) Advanced nutrient removal from surface water by a consortium of attached microalgae and bacteria: a review. Bioresour. Technol. 241 1127-1137. https://doi.org/10.1016/j.biortech.2017.06.054 [ Links ]
LORENZO-TOJA Y, VIZQUEZ-ROWE I, CHENEL S, MARIN-NAVARRO D, MOREIRA MT and FEIJOO G (2015) Eco-efficiency analysis of Spanish WWTPs using the LCA+DEA method. Water Res. 68 637-650. https://doi.org/10.1016/j.watres.2014.10.040 [ Links ]
MAKUWA S, TLOU M, FOSSO-KANKEU E and GREEN E (2020) Evaluation of fecal coliform prevalence and physicochemical indicators in the effluent from a wastewater treatment plant in the North West Province, South Africa. Int. J. Environ. Res. Public Health. 17 (17) 6381. https://doi.org/10.3390/ijerph17176381 [ Links ]
MARA D and HORAN N (2003) Handbook of Water and Wastewater Microbiology. Elsevier, Amsterdam. [ Links ]
McMAHAN EK (2006) Impact of rainfall events on wastewater treatment processes. Master's thesis, University of South Florida. [ Links ]
MENGISTU MG, OLIVIER C, BOTAI JO, ADEOLA AM and DANIEL S (2021) Spatial and temporal analysis of the mid-summer dry spells for the summer rainfall region of South Africa. Water SA. 47 (1) 76-87. https://doi.org/10.17159/wsa/2021.v47.i1.9447 [ Links ]
MOMBA MNB, OSODE AN and SIBEWU M (2006) The impact of inadequate wastewater treatment on the receiving water bodies -Case study: Buffalo City and Nkokonbe Municipalities of the Eastern Cape Province. Water SA. 32 (5) 687-692. https://doi:10.4314/wsa.v32i5.47854 [ Links ]
MOTHETHA ML (2016) Evaluation of the impacts of municipal wastewater treatment on the receiving environment: a case study of the Olifantsvlei wastewater treatment plant in the Gauteng Province, South Africa. Master's thesis, University of South Africa. [ Links ]
NYAMUKAMBA P, MOLOTO MJ, TAVENGWA N and EJIDIKE IP (2019) Evaluating physicochemical parameters, heavy metals, and antibiotics in the influents and final effluents of South African wastewater treatment plants. Polish J. Environ. Stud. 28 1305-1312. https://doi.org/10.15244/pjoes/85122 [ Links ]
OLIVEIRA DBC, DE ALBUQUERQUE SOARES W and DE HOLANDA MACR (2020) Effects of rainwater intrusion on an activated sludge sewer treatment system. Rev. Ambient. Água 15 (3) e2497. https://doi.org/10.4136/ambi-agua.2497 [ Links ]
OLLER I, MALATO S and SANCHEZ-PEREZ J (2011) Combination of advanced oxidation processes and biological treatments for wastewater decontamination-a review. Sci. Total Environ. 409 (20) 4141-4166. https://doi.org/10.1016/j.scitotenv.2010.08.061 [ Links ]
OMAR KB, POTGIETER N AND BARNARD TG (2010) Development of a rapid screening method for the detection of pathogenic Escherichia coli using a combination of Colilert* Quanti-Trays/2000 and PCR. Water Sci. Technol. Water Supply. 10 (1) 7-13. https://doi.org/10.2166/ws.2010.862 [ Links ]
OSUOLALE O and OKOH A (2015) Assessment of the physicochemical qualities and prevalence of Escherichia coli and vibrios in the final effluents of two wastewater treatment plants in South Africa: Ecological and public health implications. Int. J. Environ. Res. Public Health. 12 13399-13412. https://doi.org/10.3390/ijerph121013399 [ Links ]
OWOSENI MC, OLANIRAN AO and OKOH AI (2017) Chlorine tolerance and inactivation of Escherichia coli recovered from wastewater treatment plants in the Eastern Cape, South Africa. Appl. Sci. 7 810. https://doi.org/10.3390/app7080810 [ Links ]
PALANIAPPAN M, GLEICK PH, ALLEN L, COHEN MJ, CHRISTIAN-SMITH J and SMITH C (2010) Clearing the waters: a focus on water quality solutions. UNEP, Nairobi. 42-47. [ Links ]
PHAKULA S (2016) Modelling seasonal rainfall characteristics over South Africa. Master's Thesis, University of Pretoria. http://hdl.handle.net/2263/60851 [ Links ]
POWER EA and BOUMPHREY RS (2004) International trends in bioassay use for effluent management. Ecotoxicology. 13 (5) 377-398. https://doi.org/10.1023/b:ectx.0000035290.89590.03 [ Links ]
REEVES R, GRANT S, MRSE R, OANCEA C, SANDERS B and BOEHM A (2004) Scaling and management of fecal indicator bacteria in runoff from a coastal urban watershed in Southern California. Environ. Sci. Technol. 38 (9) 2637-2648. https://doi.org/10.1021/es034797g [ Links ]
RISCH E, GASPERI J, GROMAIRE MC, CHEBBO G, AZIMI S, ROCHER V, ROUX P, ROSENBAUM RK and SINFORT C (2018) Impacts from urban water systems on receiving waters - how to account for severe wet-weather events in LCA? Water Res. 128 412-423. https://doi.org/10.1016/j.watres.2017.10.039 [ Links ]
ROELOFS JGM, SCHUURKES JAAR and SMITS AJM (1984) Impact of acidification and eutrophication on macrophyte communities in soft waters. II. Experimental studies. Aquat. Bot. 18 389-411. https://doi.org/10.1016/0304-3770(84)90059-7 [ Links ]
ROMPRÉ A, SERVAIS P, BAUDART J, DE-ROUBIN M and LAURENT P (2002) Detection and enumeration of coliforms in drinking water: Current methods and emerging approaches. J. Microbiol. Meth. 49 31-54. https://doi.org/10.1016/S0167-7012(01)00351-7 [ Links ]
SALEEM M, BUKHARI AA and AL-MALACK MH (2000) Removal efficiencies of indicator micro-organisms in the Al-Khobar Wastewater Treatment Plant. Environ. Eng. Sci. 17 227-232. https://doi.org/10.1089/10928750050137570 [ Links ]
SAMIE A, OBI CL, IGUMBOR JO and MOMBA MNB (2009) Focus on 14 sewage treatment plants in the Mpumalanga Province, South Africa in order to gauge the efficiency of wastewater treatment. Afr. J. Biotechnol. 8 (14) 3276-3285. [ Links ]
SENGUPTA S, NAWAZ T and BEAUDRY J (2015) Nitrogen and phosphorus recovery from wastewater. Curr. Pollut. Rep. 1 155-166. https://doi.org/10.1007/s40726-015-0013-1 [ Links ]
USEPA (United States Environmental Protection Agency) (2009) Terms of environment: glossary, abbreviations, and acronyms. Office of the Administrator/Office of External Affairs and Environmental Education. USEPA, Washington DC. [ Links ]
USEPA (United States Environmental Protection Agency) (2007) Advanced wastewater treatment to achieve low concentration of phosphorus. EPA 910-R-07-002. USEPA, Washington DC. [ Links ]
VERHOEVEN JT and MEULEMAN AF (1999) Wetlands for wastewater treatment: opportunities and limitations. Ecol. Eng. 12 5-12. https://doi.org/10.1016/S0925-8574(98)00050-0 [ Links ]
WU H, ZHANG J, NGO HH, GUO W, HU Z, LIANG S, FAN J and LIU H (2015) A review on the sustainability of constructed wetlands for wastewater treatment: design and operation. Bioresour. Technol. 175 594-601. https://doi.org/10.1016/j.biortech.2014.10.068 [ Links ]
YOUNG K and THACKSTON E (1999) Housing density and bacterial loading in urban streams. J. Environ. Eng. 125 (12) 1177-1180. http://dx.doi.org/10.1061/(ASCE)0733-9372(1999)125:12(1177) [ Links ]
ZHANG B, YU Q, YAN G, ZHU H, XU XY and ZHU L (2018) Seasonal bacterial community succession in four typical wastewater treatment plants: correlations between core microbes and process performance. Sci. Rep. 8 (1) 4566. https://doi.org/10.1038/s41598-018-22683-1 [ Links ]
ZHOU X, HE Z, JONES KD, LI L and STOFFELLA PJ (2017) Dominating aquatic macrophytes for the removal of nutrients from waterways of the Indian River Lagoon basin, South Florida, USA. Ecol. Eng. 101 107-119. http://doi.org/10.1016/j.ecoleng.2017.01.006 [ Links ]
ZULU NCT (2017) The effect of seasonal variation on nutrient removal from municipal wastewater using a constructed wetland microcosm. Master's thesis, University of Zululand. [ Links ]
 Correspondence:
S Makuwa
Email: stenlymodupi@ymail.com
Received: 6 April 2021
Accepted: 21 December 2021
APPENDIX


