


Serviços Personalizados
Artigo
 Inglês (pdf)
 Artigo em XML
 Referências do artigo
Indicadores

Links relacionados
-
 Citado por Google
 -
 Similares em Google
Compartilhar

 Permalink
Water SA
versão On-line ISSN 1816-7950
versão impressa ISSN 0378-4738
Water SA vol.36 no.1 Pretoria Jan. 2010
A falling-head procedure for the measurement of filter media sphericity
Johannes Haarhoff*; Ali Vessal
Department of Civil Engineering Science, University of Johannesburg, PO Box 524, Auckland Park 2006, South Africa
ABSTRACT
Filter media sphericity is normally determined experimentally in a laboratory filtration column. The pressure drop is measured across a bed of known depth while the filtration rate is kept constant. The sphericity is then calculated from a theoretical headloss relationship using the Ergun equation. This paper proposes a method along similar lines, but suggests a much simpler experimental procedure. Instead of having to maintain a constant flow rate and measuring both the flow rate and the pressure, the column is filled and the water then allowed to drain through the bed. The only measurement to be taken is the time it takes for the water level to drop through a known distance, which is called a falling-head procedure. The full theoretical development of the method is provided, as well as a detailed experimental procedure. The practicality of the method is demonstrated with tests performed on a variety of filter media, and a fully-worked example is presented.
Keywords: filter media, granular filtration, sphericity, Ergun, falling-head test, grain shape.
Introduction
Rapid gravity filtration is the backbone of phase separation at most water treatment plants in South Africa. The core of filtration is a layer of granular filter media, mostly silica sand, which offers resistance to the flow of water through the media bed during filtration, and also expands during backwash. Filter designers need to predict the head loss through the filter beds, as well as predicting fluidisation and expansion of the media bed during backwash. The design models for head loss, fluidisation and expansion all include the sphericity (or roundness) of the media grains as an important variable controlling the behaviour of the media.
Numerous definitions were proposed to express the degree of roundness of a solid object. A review by Ceronio (1997) concluded that the surface ratio sphericity is the definition most suited and commonly accepted for filter media. This is defined as a ratio:
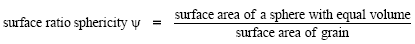
It is quite easy to calculate the surface ratio sphericity (simply referred to as 'sphericity' in the remainder of the paper) of a single object with a defined shape. A perfect sphere, for example, will have a sphericity of 1.00, while a cube and a typical sheet of paper will have sphericities of 0.81 and 0.015 respectively. The challenge to the filter designer, however, is to find the average sphericity of a filter bed which typically contains about 3000 million grains per cubic metre. Practically, sphericity can be tested in a number of ways:
• By comparing a number of grains through a stereoscope and matching with a printed guideline (Fair et al., 1968). This method had been used on many different media types at the Water Research Group of the University of Johannesburg (UJWRG) and yielded results which were consistently too high.
• By measuring the rate at which a sand grain sinks in water, and using this value to calibrate the shape factor in a modified Stokes equation. This test has to be repeated for many different grains to get a statistically robust estimate. Moreover, there is no direct mathematical link between the shape factor from this test and the surface ratio sphericity.
• By measuring the expansion of a media sample in a test column at different flow rates, and then using this expansion to determine the sphericity from one of the expansion models (e.g., the model of Dharmarajah and Cleasby, 1986; or the recently proposed model of Soyer and Akgiray, 2009).
• By measuring the head loss through a media sample in a test column, and then using this head loss to determine the sphericity from one of the head loss models (e.g., the model of Ergun, presented in AWWA, 1990; or the model of Trussell and Chang, 1999).
The aim of this paper is to present a simple method, easily performed with a minimum of equipment, to bring the measurement of media sphericity within easy reach of design engineers and treatment plant managers. The point of departure for this paper will be the measurement of head loss, then obtaining the sphericity from the Ergun equation. Instead of conducting the test in a conventional manner at a constant flow rate, which requires flow regulation and the measurement of flow rate as well as headloss, a falling-head test will be developed which only requires the measurement of the time it takes for the water level to drop over a known distance. It should be noted that the results should be identical, whether the test is performed at a constant flow rate or with a falling head. The advantage of the proposed method is that it is simpler and quicker to perform. The data analysis, however, is more complicated, so the theory required will be fully developed with a worked example.
The Ergun equation
The Ergun equation reads (AWWA, 1990, p. 465):
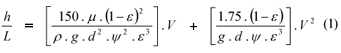
with:
h = headloss through media bed (m) L = depth of media bed (m) V = filtration rate (m·s-1) ε = media bed porosity (-) ψ = average surface area sphericity (-) d = geometric grain diameter (m) g = gravitational acceleration (m·s-2) ρ = density of water (kg·m-3) μ = dynamic viscosity of water (kg·m-1·s-1)
The attractive feature of the Ergun equation is that it has both laminar and turbulent terms. The Reynolds number for filtration is calculated as:
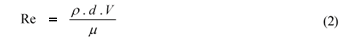
For a bed of filter media, where the interstitial spaces cover a broad range in terms of their size and tortuosity, there is not a sharp, predictable transition between laminar and turbulent flow as in the well-known example of pipe flow. This is evidenced by a broad transition range for the Reynolds number reported in the literature. Typical rapid gravity filtration rates lead to Reynolds numbers which are in the transition zone. The use of the Ergun equation, which automatically accounts for both laminar and turbulent flow components, is therefore strongly recommended above some other models which only include laminar terms.
How does one find the geometric grain diameter of a mixed media bed with a range of grain sizes? Filter sand is specified according to its grain size distribution and sieve analyses are routinely and easily performed. From such a sieve analysis, which typically splits the sample into about 5 to 8 size fractions, the geometric mean of the passing and retaining sieve sizes is calculated for each fraction:

For each fraction, its fractional mass contribution α can be calculated:

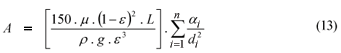
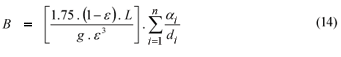
The Ergun equation is now applied to each of the fractions in turn, by assuming that each fraction has a depth of α·L. Importantly, it is also assumed that the grain sphericity of all the fractions are the same – an assumption to be verified later in the paper. The result is the working equation used by design engineers for estimating the headloss through filter media:

Media grain density
The density of the media grains, required in the next step for calculating media porosity, is measured by pouring a previously dried and weighed sample into a measuring cylinder partially filled with water. The mass is already known, the grain volume is determined from the volume displacement in the cylinder and the density is thus directly calculated. From routine tests done at the UJWRG over about 15 years, typical values for media density are:
• For good quality clean silica sand, the density is typically in the range between 2 450 and 2 650 kg·m-3.
• With extensive amorphous calcium carbonate deposits on silica sand, the density could be as low as 2 200 kg·m-3
• A typical value for filter-grade anthracite is 1400 kg·m-3.
Media bed porosity
The porosity of a randomly-packed media bed typically varies between 0.45 and 0.55. Although this range may seem to be rather narrow, the Ergun equation shows that the headloss is strongly dependent on porosity – a porosity of 0.45 will lead to a headloss 2 to 3 times higher than a porosity of 0.55. Moreover, the porosity of a bed is not a constant. A media bed which is gently settled after bed expansion in a test filter, will compact by as much as 10% after a single sharp tap to the side of the filter, which translates to a significant reduction in porosity. For the determination of sphericity, however, it is only important to know what the porosity is at the time of the falling-head test. It is therefore suggested that the media sample is dried and weighed before it is transferred to the test column. After the test is performed, the exact media bed depth is measured. The actual in situ porosity for the test is then determined from:

with
M = mass of media sample used in test (kg) ρgrain = density of media grains (kg·m-3) D = diameter of test column (m)
Water density and viscosity
Both the density and viscosity of the water can be reliably estimated from the water temperature. The following polynomials were fitted by the authors to values reported in Lide (2004) and are within 0.002% for density and 0.01% for dynamic viscosity:
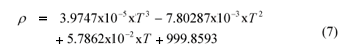
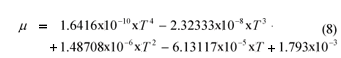
with
ρ = density (kg·m-3)
μ = dynamic viscosity (kg·m-1·s-1)
T = water temperature (°C)
The proposed falling-head test
A test column is required for the test, schematically indicated in Fig. 1. The column has 2 marks – one about 1 000 mm above the overflow level and the other about 100 mm above the overflow level. Each falling-head test has 2 parts. In the 1st part, the test is performed without any media. From the time it takes for the water level to drop between the marks as it flows through the empty column test, the resistance offered by the outlet piping and the media support grid can be quantified. In the 2nd part, the same test is repeated, but this time with the media in the column. By the mathematical analysis which follows, the media sphericity can be calculated. A detailed procedure for performing the test is suggested in Appendix A.

Solving for the sphericity from the falling-head test
The water flowing through the test column does not only have to overcome the resistance of the media bed, but also the resistance offered by the media support system and outlet piping of the column. These non-media losses are turbulent and take the form:

In the case of a falling head, where the filtration rate varies as the water level drops, the filtration rate is expressed as dh/dt, leading to a differential equation:

The solution of this differential equation allows the estimation of C by using the time it takes for the water level to drop from the top mark to the bottom mark:

This falling-head determination of the non-media losses is superior to the constant-rate method. The non-media losses are normally small in relation to the media losses and are difficult to determine accurately in the constant-rate method. The time measurement of the falling-head method is much more accurate.
When the column is filled with media, the total head encountered by the water flowing out of the column is the sum of resistance offered by the media and the outlet piping. By adding equations (5) and (10), a 1st-order differential equation follows, in terms of the constants A, B and C which are independently determined for each test:
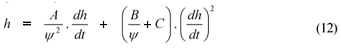
The solution to this differential equation is given by:
The above integral does not offer an analytical solution and has to be evaluated numerically. For the work reported further on in this paper, Simpson's rule was applied with 10 intervals to allow a solution for the sphericity ψ, and the 'Goal Seek' function of Excel was used to evaluate the sphericity.
Verification of the proposed procedure
Experimental equipment
The tests were conducted in a clear polyethylene tube with an inside diameter of 67 mm. The media was supported on a fine stainless steel mesh with an approximate aperture size of 1.2 μm, which in turn rested on a coarser, stiff stainless grid with an approximate aperture size of 1.5 mm. The column extended to about 200 mm below the media support grids and this under-floor volume was filled with glass marbles to equalise the flow patterns in the under-floor volume. A single connection allowed water in or out of the under-floor volume. This connection led to both the overflow pipe (which could be blocked or opened with a rubber stopper) and the inlet hose (which could be opened or closed with a valve from the municipal connection).
The overflow pipe was installed such that its top was about 250 mm above the media support grid, which determines the maximum media bed depth that can be tested. For all the tests conducted, the actual bed depth was between 100 mm and 140 mm.
The top and bottom marks in the column, used to determine the start and stop of the falling-head test, respectively, were 1 103 mm and 103 mm above the top of the overflow pipe. The difference of 1 000 mm allowed a reliable estimate of the time taken for the falling-head test. As the flow rate decreases significantly when the water level in the column approaches the level of the overflow pipe, the bottom mark should not be less than about 100 mm above the top of the overflow pipe, to limit the drain-down time to a reasonable value. For accurate results, it is necessary to consider the height of the water above the top of the overflow pipe. This can be obtained by direct measurement during the falling-head test. The diameter of the overflow pipe used is 20 mm. For the tests reported in this paper, the overflow height during the empty bed test varied from 25 mm when the water was at the top mark and 5 mm when the water was at the bottom mark. The corresponding values when the column was filled with media were 7 mm and 2 mm.
Media samples
The procedure was tested on 2 media samples, listed in Table 1. The 5 samples were further subdivided as shown to yield a total of 10 sub-samples. Sieve analyses were performed, 1 test for each sub-sample, and the per cent recovery from the sieves was in all cases higher than 99%. For each sub-sample, the density of the media was measured with 5 replicates to obtain the average. Each test commenced with an empty bed test in triplicate, after which the column constant C was calculated from the average. After each of the sub-samples had been placed in the column, 5 consecutive tests were performed as detailed in Appendix A, each with a slightly different bed height and thus media porosity. This yielded a total of 49 independent sphericity values (1 test on Sample 5B was unintentionally omitted).

To provide a more intuitive grasp of the different media types, Fig. 2 shows a collage of photomicrographs, all at exactly the same magnification.

Results
For the total of 24 independent density determinations, the standard deviation was 1.0% from the average. The average values for each sample are shown in Table 2. There was no statistically significant difference (α = 5%) between Samples 2 and 3, which is supported by the observation that these samples were drawn and processed from the same geological deposit. The difference between Samples 4 and 5 was statistically highly significant, showing that the deposition of amorphous calcium carbonate caused a measurable reduction in density.
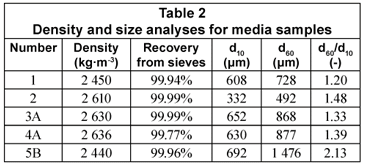
From the sieve analyses, the 10th and 60th size percentile values were estimated by linear interpolation. The effective size (d10) for all the samples was about the same, with the exception of Sample 2. The uniformity coefficient (d60/d10) for filter media is normally specified to be less than 1.4. The calcium carbonate deposition on Sample 5 has a marked and detrimental influence on the uniformity coefficient.
The tests were performed with municipal tap water during the months of May to July 2007, with the temperature ranging from 13.0°C to 18.5°C. For each test, the density and viscosity values were calculated from the measured temperature.
The column constant C for the column used varied between 239 and 301 s2·m-1. This fairly large scatter could not be related to any systematic cause, and was presumably the result of the slight blockage of the media support mesh by small grains remaining after a media sample was washed out. It is therefore suggested to conduct the empty bed test with every sample to be tested, it being a quick and easy preventative step.
The porosity of the media in the test column was deliberately varied for each of the sub-samples by controlled tapping of the column (see the detailed procedure in Appendix A). For the silica samples analysed, the porosities all fell within a fairly narrow band of 0.46 to 0.53 with an average of 0.49. Sample 1 (the glass ballotini) had a significantly lower porosity range of 0.37 to 0.42. This agrees with the universal observation that randomly packed round grains attain a higher packing density (i.e. a lower porosity) than grains with more irregular shapes.
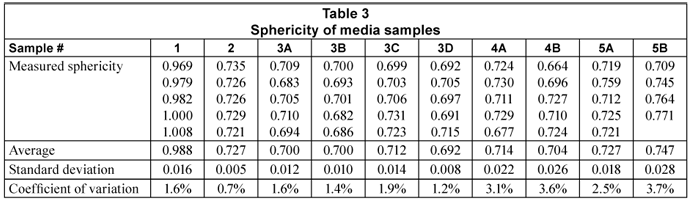
The sphericity values, calculated from the previous results and the procedure proposed in this paper, are shown in Table 3.
The ballotini of Sample 1 appear, as is evident from Fig. 2, to be perfect spheres with sphericity of 1.000. The average measured sphericity turns out to be 0.988, which is remarkably close.
The difference between Samples 4A and 4B (different samples drawn from the same stockpile) was statistically insignificant (α = 0.05). These values could thus be pooled to yield an average sphericity of 0.709. Similarly, the difference between Samples 5A and 5B turned out to be statistically insignificant and yielded an average of 0.736 after pooling. Next, the sphericity of the pooled Samples 4 and 5 was compared. These values were indeed significantly different (α = 0.05). In other words, the deposition of calcium carbonate did have a significant, albeit small, effect of making the grains less angular.
Sample 3A was split into 3 different size fractions, 3B, 3C and 3D, to test the earlier assumption of Eq. (4), namely, that all the size fractions of a sample have equal sphericity. The possibility exists that the smaller grains within a media sample may be more shard-like and irregular. The results presented in Table 3 show that this is not the case. In fact, there is no statistically significant difference between the sphericities of Samples 3A, 3B, 3C and 3D (α = 0.05). The assumption underlying Eq. (4) is thus validated.
Conclusion
The objective of this paper is to present an alternative method for the determination of filter media, namely to use a falling-head procedure instead of the normal constant-rate procedure. The procedure was extensively tested and refined and a detailed test procedure could be developed, as shown in Appendix A.
The advantage of the simpler procedure is partly off-set by the need for more complicated data analysis, fully developed in the paper. The analysis is illustrated with an example which demonstrates that simple spreadsheet programming can deal with the data analysis without any problem.
The test was validated with the results of near-perfectly spherical glass ballottini, which yielded an experimental result of 0.988, close to 1 as expected. The test was sensitive enough to discriminate, with statistical significance (α = 0.05) between the sphericity of clean media, and the sphericity of the same media with some calcium carbonate deposition. The coefficient of variation for replicate tests on the same samples (n = 5 in each case) was less than 4%.
Acknowledgments
The media samples were obtained through the generous assistance of John Geldenhuys of Rand Water Scientific Services and the management of Silica Quartz.
References
AWWA (AMERICAN WATER WORKS ASSOCIATION) (1990) Water Quality and Treatment. 4th edn. McGraw-Hill, New York, 1990. [ Links ]
CERONIO AD and HAARHOFF J (1997) Properties of South African silica sand used for rapid filtration. Water SA 23 (1) 71-80. [ Links ]
DHARMARAJAH AH and CLEASBY JL (1986) Predicting the expansion of filter media. J. Am. Water Works Assoc. 78 (12) 66-76. [ Links ]
FAIR GM, GEYER JC and OKUN DA (1968) Water and Wastewater Engineering, Volume 1. John Wiley & Sons, New York. [ Links ]
LIDE DR (2004) (ed.) CRC Handbook of Chemistry and Physics. 85th edn. CRC Press, Boca Raton FL, USA [ Links ]
SOYER E and AKGIRAY O (2009) A new simple equation for the prediction of filter expansion during backwashing. J. Water Supply: Res. Technol. - AQUA 58 (5) 336-345. [ Links ]
TRUSSELL RR and CHANG M (1999) review of flow through porous media as applied to head loss in water filters. J. Environ. Eng. 125 (11) 998-1006. [ Links ]
Received 20 October 2008; accepted in revised form 10 November 2009.
* To whom all correspondence should be addressed.
+2711 559 2148; fax: +2711 559 2395;
e-mail: jhaarhoff@uj.ac.za
Appendix A – Detailed test procedure
Part A – Media tests
1. Take a representative sample of the media to be tested. Wash it gently by hand in a 250 μm sieve under running water to wash out all lumps and mud balls. Dry overnight at 100°C.
2. Taking a sample of not more than 300 g, sieve it with a sieve shaker through a stack of all available sieves below and including 2.00 mm.
3. For each different sieve fraction, calculate the mass fraction α and geometric diameter and determine the summation terms in Eq. (4).
4. Take at least 3 samples of about 1 000 g each, weigh and add to 500 mℓ in a 1 000 mℓ cylinder. (To save media, if required, good results can be obtained by using half this mass in a 500 mℓ cylinder.)
5. Calculate the media density for each sample and determine the average.
6. Retain 500 to 600 g of dried media for the column test described in Part C.
Part B – Empty column test
1. Set up the empty column and ensure that the column is exactly vertical using a post level.
2. Connect a hose to the inlet and block the overflow pipe with a rubber stopper.
3. Open the hose and allow the water to rise in the column to the top or at least 50 mm above the top mark. Close the hose.
4. Measure the water temperature in the column with a thermometer. Calculate the water density and viscosity.
5. Measure the distance from the top of the overflow pipe to the top mark (hA) and the bottom mark (hB).
6. Remove the stopper from the outlet pipe and measure the overflow depth at the overflow pipe when the water level reaches the top mark (hC) and the bottom mark (hD).
7. Calculate h1 = hA – hC and h2 = hB – hD. (The distances h1 and h2 are shown in Fig. 1.)
8. Stopper the outlet pipe and fill the column again by opening the inlet hose. Close the hose when the water level is at least 50 mm above the top mark.
9. Remove the stopper from the overflow pipe. Use a stopwatch to accurately measure the time it takes for the water to drop from the top to the bottom mark.
10. Repeat Steps 8 and 9 at least 3 times to get a reliable average for drop-down time.
11. Measure the internal diameter of the test column.
12. Calculate the column constant C.
Part C – Column test with media
1. Take a sample of approximately 500 to 600 g of dried media and weigh.
2. Pour the media into the clean column.
3. Ensure that the column is exactly vertical using a post level.
4. Connect a hose to the inlet and block the overflow pipe with a rubber stopper.
5. Open the hose and slowly fill the column from the bottom, ensuring that no media is washed over the top.
6. Allow the media to settle and then gently increase the backwash rate to obtain a bed expansion of about 50%. Maintain this rate until the backwash water is clear.
7. Suddenly close the inlet hose and wait for the media to come to rest.
8. Remove the stopper from the overflow pipe. Measure the overflow depth at the overflow pipe when the water level reaches the top mark (hE) and the bottom mark (hF).
9. Calculate h1 = hA – hE and h2 = hB – hF. (The distances h1 and h2 are shown in Fig. 1.)
10. Repeat Steps 5, 6 and 7.
11. Remove the stopper from the overflow pipe. Use a stopwatch to accurately measure the time it takes for the water level to drop from the top to the bottom mark.
12. When no more water is draining from the overflow pipe, measure the media depth from the media support grid to the media surface. Be careful not to bump or tap the column.
13. Calculate the sphericity.
14. Repeat Steps 10, 11, 12 and 13 at least 3 times. The 1st time, perform Step 11 immediately after Step 10. The 2nd time, just before Step 11, give the test column a sharp sideways tap which will cause the media surface to drop a little. The 3rd time, give the column 2 taps, etc. (This is to ensure that the sphericity is calculated for different porosities.)
15. Take the average of the sphericity values determined in Step 13 and use for further design.
Appendix B – Example of data analysis
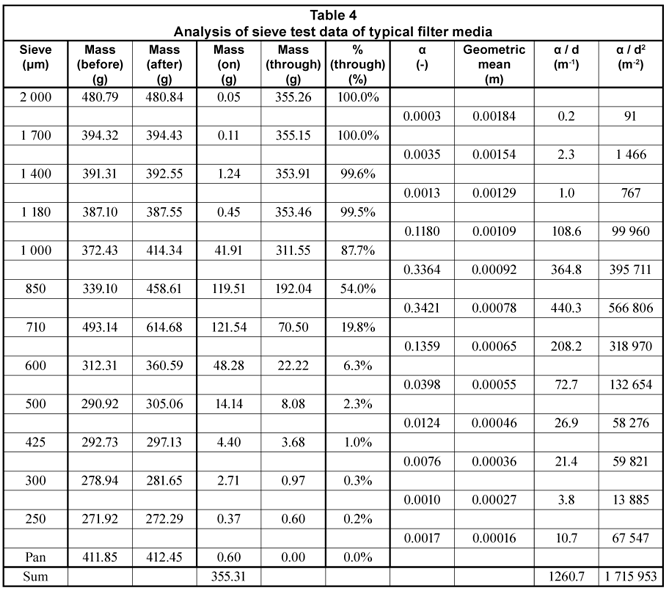
A media sample is sieved, with the results shown as Columns 1-6 on the left of Table 4. The fractional mass contribution of each fraction (Eq. (4)) is shown in Column 7, the geometric mean (Eq. (3)) in Column 8 and the 2 summative twerms of Eq. (5) in Columns 9 and 10.ia
The density of the media is determined to be 2 636 kg·m-3 and the water temperature during the test is 16.0°C. The density is thus estimated to be 998.9 kg·m-3 (equation 7) and the dynamic viscosity to be 0.00108 kg·m-1·s-1 (Eq. (8)).
The test column has an internal diameter of 0.067 m and the top and the bottom marks are 1.1 m and 0.1 m above the lip of the overflow pipe respectively. During the empty bed test, the overflow height over the lip of the overflow pipe is 0.025 m when the water level is at the top mark and 0.005 m when the water level is at the bottom mark. For the empty bed test, therefore, h1 = 1.075 m and h2 = 0.095 m. During the test with media, the overflow depths were 0.009 m and 0.003 m respectively, leading to h1 = 1.091 m and h2 = 0.097 m.
During the empty bed test, the average time taken for the water level to drop from the top to the bottom mark is 22.5 s, leading to a column constant C of 238 s2·m-1 (Eq. (11)).
For the media test, a dried mass of 553.8 g is transferred to the column. The time taken for the water level to drop from the top to the bottom mark is 54.2 s and the bed depth after this test is 0.117 m. From these and earlier values, the porosity ε = 0.488 (Eq. (6)), A = 8.26 (Eq. (13)) and B = 115 (Eq. (14)).
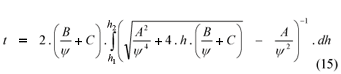
With the exception of the sphericity, all the terms in Eq. (15) are now known:

or:

By choosing an approximate value for the sphericity ψ, the time t can be calculated. Successive approximations continue until the calculated time is close enough to the measured time. If Simpson's rule is applied with 10 equal height intervals (others' methods can also be used, of course), then a solution is offered by:

A convenient way of finding the best approximation for the sphericity ψ is to use the 'Goal Seek' function in Excel to change ψ until the measured and estimated times are the same. In this particular example, the solution is given by ψ = 0.729.

