


Services on Demand
Article
 English (pdf)
 Article in xml format
 Article references
Indicators

Related links
-
 Cited by Google
 -
 Similars in Google
Share

 Permalink
Journal of Energy in Southern Africa
On-line version ISSN 2413-3051
Print version ISSN 1021-447X
J. energy South. Afr. vol.33 n.3 Cape Town Aug. 2022
http://dx.doi.org/10.17159/2413-3051/2022/v33i3a8362
ARTICLES
The role of natural gas in facilitating the transition to renewable electricity generation in South Africa
S. ClarkI, *; J. van NiekerkI; J. PetrieII; C. McGregorI
ISolar Thermal Energy Research Group, Department of Mechanical and Mechatronic Engineering, Stellenbosch University, South Africa
IIDepartment of Chemical and Biomolecular Engineering, University of Sydney, Australia; Department of Chemical Engineering, University of Cape Town, South Africa
ABSTRACT
As is being done in most of the world, South Africa has commenced the transition from a fossil fuel-based electricity generation system to one based on renewable sources to meet greenhouse gas emission reduction goals. This paper explores the role of natural gas in South Africa to support the transition to a renewable energy-driven power grid. Specifically, the paper quantifies the firm and dispatchable power requirement to accommodate variability in solar and wind generation sources based on real-time series data from current renewable energy power plants for the country, and demonstrates that natural gas could be one of the elements to meet the medium-term need for this dispatchable power requirement, based on current regional gas resources. A range of alternative natural gas sources are considered in this analysis, covering existing gas resources from Mozambique, deep-water offshore potential from the southern Cape, shale gas from the Karoo basin, as well as liquefied natural gas imports. In addition, the alternatives to natural gas to supply the required dispatchable energy are considered. The analysis shows that the major challenge is to have sufficient gas storage available to be able to provide gas at the very high instantaneous rates required, but where the gas is only used for short periods of time and at low annual rates.
Highlights
• South Africa has commenced the transition from a fossil fuel-based electricity generation system to one based on renewable sources.
•The government has indicated that gas-fuelled dispatchable generation will be used to meet this dispatch-able energy need.
•The annual volume of natural gas needed to meet this requirement is currently available in South Africa.
• The challenge in meeting this dispatchable energy need is to have sufficient gas storage.
Keywords: South African energy transition, natural gas, dispatchable power, storage, gas storage
1. Introduction
Most countries have agreed that reducing the emission of greenhouse gases is critical for limiting the impact of climate change. As part of its commitment to this end, South Africa is planning a transition to an electricity generation system based mainly on renewable sources (Department of Energy, 2011). South Africa embarked on an ambitious programme to encourage independent power generation from renewable energy resources as early as 2011, under a competitive bidding strategy, and its most recent energy plan proposes that renewable energy (RE) power plant will contribute in excess of 25% by 2030 (Deparrtment of Energy (DOE), 2015a; 2019).
The planning also recognizes that, due to the intermittent nature of solar and wind generation, sufficient dispatchable power backup is necessary to balance the supply and demand of the system. The Integrated Resource Plan (IRP) programme is a government-developed process that attempts to forecast the elements needed for power generation in the future. Gas-fuelled dispatchable generation is considered to be a major element of these forecasts (DOE, 2011; 2019). Firm and dispatchable generation is on-demand energy that can be brought online as required to back up most or all of the variable generation from wind and solar when these do not meet the demand. The use of this generation could be for hours, days or even weeks (Sepulveda et al., 2018). However, the planning to provide this gas-fuelled dispatchable power for the IRP scenarios has not been addressed. From the first IRP 2010 to the latest update in IRP 2019, gas dispatchable power was simply assumed, but, as noted in the IRP 2019, sourcing of the required gas was not defined (DOE, 2019). There was an assumption that this would be covered by the Gas Master Plan (GMP). Associated with the IRP, the government planning process assumes the development of a GMP that would show how gas can be developed to support the need identified in the various iterations of the IRP. However, the GMP preparation has been challenged from the beginning. The first iteration of the GMP was issued for preliminary comments in 2015, but never completed (DOE, 2015b). In December 2021, an update of the proposed GMP was issued for public comment (Department of Mineral Resources and Energy, 2021). However, the document does not connect the potential sources with actual usage or demonstrate the economic feasibility of these uses. With neither an economic model for the gas usage potential nor discussion of the cost of development of the infrastructure to provide gas to these potential market opportunities, this document is more of a discussion document rather than a development plan.
With the IRP silent on the source of gas to meet the medium-term dispatchable generation and the GMP not clarifying the issue, it is not clear how gas can meet the needs to support the plan. This paper defines an appropriate role for gas in meeting the requirement for dispatchable energy to support the transition to renewable energy sources in the South African power system, followed by an analysis of how much dispatchable power and energy will be required. The options, necessary technical readiness, and costs for the gas supply to meet these needs are considered. This analysis is informed by a time-series model based on the performance of operational utility-scale RE plants in South Africa to date (Clark et al., 2020). As will be demonstrated in this analysis, the volume of gas needed to meet this requirement is not large and can be met without major investments in infrastructure. Minimising major investments will also minimise the potential for stranded assets if there is a transition to a green hydrogen fuel source.
An essential element that has not been discussed previously in the literature related to the South Africa transition planning process is the requirement to provide for gas storage to meet the dispatchable energy, something that is quantified in this analysis.
2. Background
With the signing of the Paris Accord in 2015, many countries recognised the need for action to reduce carbon emissions and reduce the impact of climate change. In the Accord, countries committed to individual activities that would limit the increase in the average world temperature to less than two degrees Celsius (UNFCCC, 2015). The main action to achieve this will be to limit the release of CO2 into the atmosphere. A renewable energy-based electricity generation system will assist in achieving this objective. To achieve these goals, South Africa has introduced plans to gradually migrate its electrical power generation to include more wind and solar energy, of which it has significant resources.
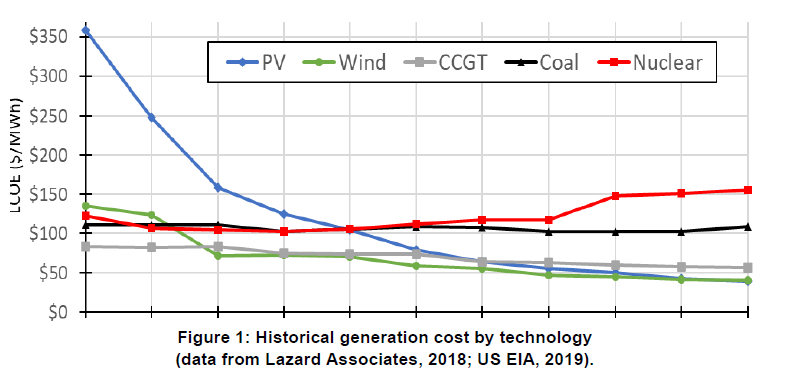
Significant reductions in the cost of solar and wind power plants have happened globally over the last decade due to the implementation of large-scale projects, along with technological and manufacturing improvements. As shown in Figure 1, these costs have now decreased to levels below the cost of generation from fossil fuel and nuclear (US EIA, 2017; Lazard Associates, 2018). With these reductions in cost, variable renewable energy sources are currently the least expensive sources for new generation and are approaching levels where they are less expensive than continuing to use existing fully depreciated coal and nuclear baseload power plants (Planting, 2021). With an average age for the coal generation facilities in South Africa of over 40 years, most of the current coal plants must be replaced in the coming years with or without the transition plan (Mufson, 2021). Replacing the retired coal plants with new coal or nuclear would be significantly more expensive than a system based on solar and wind generation plus firm and dispatchable power (Wright et al., 2018).
Wind and solar plants produced 5.2% of South Africa's electricity in 2020, well below the world average of 11.7% (BP, 2021). Installed capacity of wind and solar generation in South Africa at the beginning of 2022 was 5.7 GW, 10.6% of the total overall installed capacity (Wright & Calitz, 2022). The IRP was updated in 2013, 2016, 2018 and 2019 (DOE, 2019). Each iteration of the IRP mentioned the use of gas for dispatchable generation but did not identify the sources or develop any concepts of where the power plants will be built.
For this analysis, a model was created to calculate the required dispatchable installed power and energy production necessary to balance supply and demand for any given scenario. As South Africa has over three years of solar and wind generation history from its REIPPP programme, it is appropriate to utilise actual performance data rather than theoretical predictions. Performance data for Eskom demand and renewable generation was received for the years 2015 through 2019 and analysed for consistency and adequate spatial coverage to represent an aggregated system (Eskom, 2019a; Clark, et al., 2020). The analysis indicated excellent data consistency through the years of study, even considering localised events such as load-shedding and drought. This data appears to be sufficiently representative to be valid for forecasting the requirements of dispatcha-ble generation into the future.
Demand was forecast by scaling-up the 2017 Eskom generation by the growth factor considered with consistency checks preformed using 2015 through 2019 data. Wind and solar generation on an hourly basis were used from the Eskom data with capacity factors for each hour of the year. Multiplying these capacity factors by the installed wind and solar facilities gave an hourly output for each resource for the year in consideration. Base generation was assumed to be available at all times at the installed capacity multiplied by the assumed annual availability factor. As the intent with the model was to determine the need for dispatchable power, the combination of these energy sources was compared to hourly demand to find the times and volumes of shortage which would require dispatchable generation (Clark et al., 2020).
An Excel hourly model was constructed to forecast the requirement for dispatchable energy within the framework of the assumed scenarios for electricity generation. This model was able to replicate the installed capacity of the dispatchable power requirement (approximately 10 GW) and use of these facilities for approximately 10 TWh, as noted in the IRP for 2030, with the parameters assumed in the IRP 2019.
2.1 Flexibility requirement
As can be seen from the time it has taken from decision to implementation of the Medupi and Kusile coal plants, a long lead time must be considered when deciding whether a baseload plant should be built. This is confirmed by international experience in the time required to implement coal and nuclear generation plants. Because of the uncertainty of likely generation requirement, the probability of overbuilding is high for large single-capacity deployments. This causes added costs for the entire system that must be borne by the consumer. Modular development of low capital cost solutions offers responsiveness to meet changing needs as they develop. Wind and solar projects do not have the same economies of scale and can be built on a more modular basis. The time to install a wind or solar plant is also much shorter than for a large baseload generating plant, with PV plants such as the 85 MW Scatec plant in Upington constructed in less than one year (Scatec, 2020). Dispatchable gas-fuelled power plants, such as the Sasol plants in Sasolburg and at Ressano-Garcia in Mozambique, can be built within two years (Sasol, 2013; Creamer, 2015). This leads to more flexibility in the planning process.
As demonstrated in a review of the IRP development plans (Clark et al., 2020), there is a range with each of the parameters of the generation scenario, such as decommissioning of existing generation, system availability factors, and demand growth, that will change the requirement for dispatchable generation for any time in the forecast period. The results of the modelling indicated that the total amount of required dispatchable power capacity can vary depending on all of the above variables and the amount of installed wind and solar generation. However, in all cases, the amount of firm and dis-patchable power that must be installed is the capacity needed to completely replace the generation from renewable sources. This will be demonstrated in the scenario presented in the following section.
2.2 Simulation results
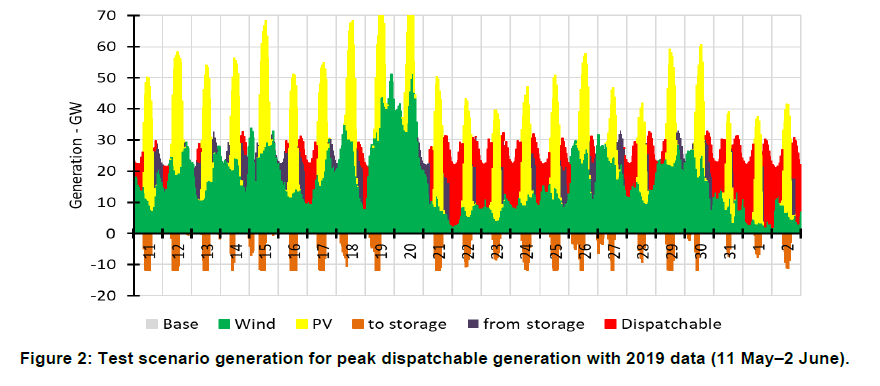
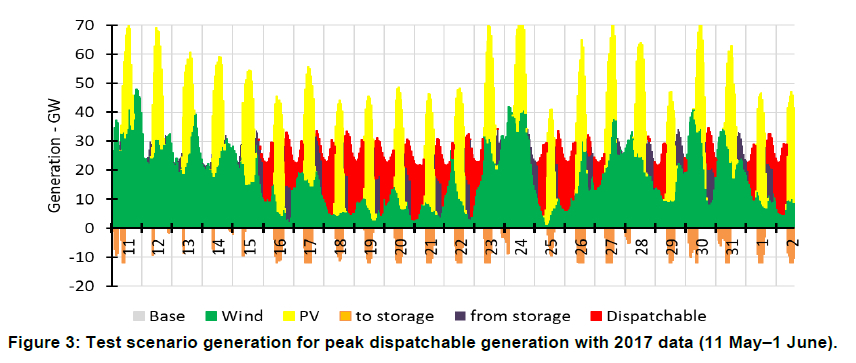
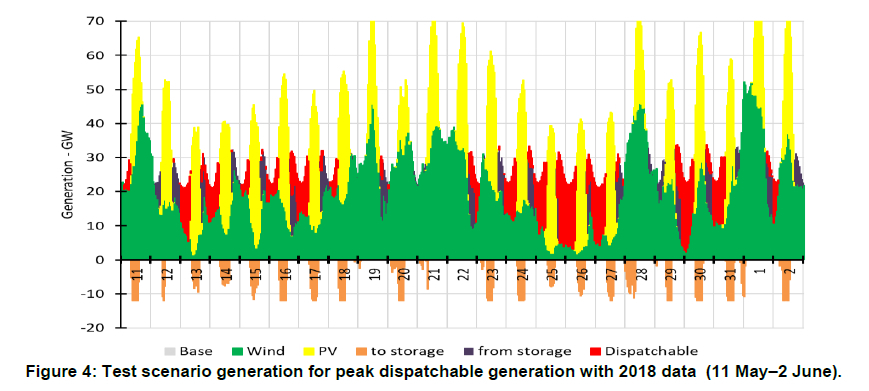
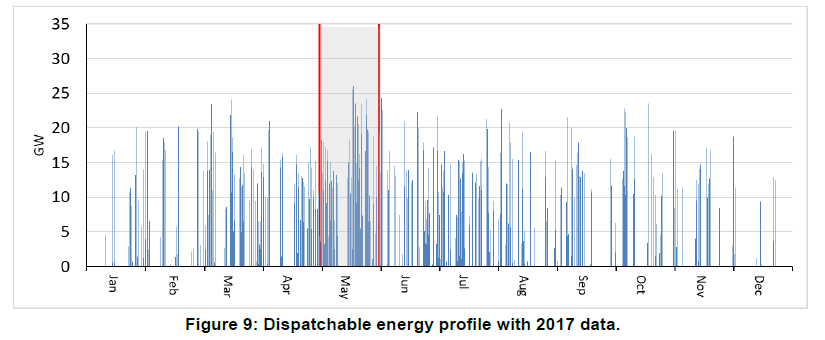
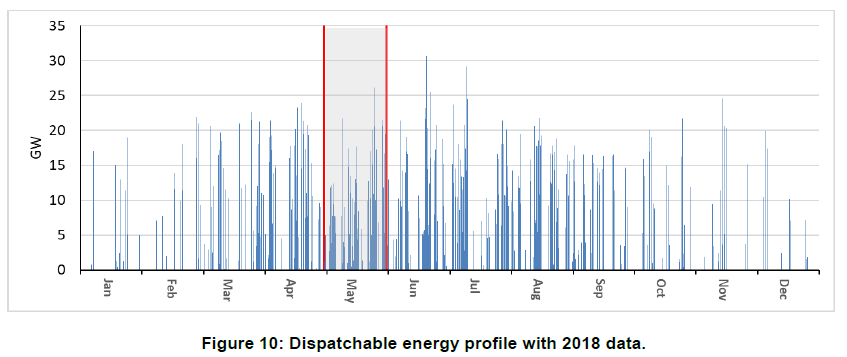
For comparison purposes, the study simulated a scenario where the current demand profile is met with the 100% renewable sources with dispatchable generation as required. This implies an annual demand of 235 TWh of generation met with 65 GW of installed wind and 50 GW of installed solar PV. To minimise the dispatchable generation, 12 GW of energy storage with a six-hour capacity (batteries or other storage mechanisms) was also included in the scenario. As shown in Figure 2, on 16-20 May, based on 2019 data, dispatchable power (in red) was required for nearly 19 hours each day. There were only a few hours each day not needing dis-patchable generation and minimal recharging of energy storage. This situation was repeated from 31 May through 2 June. During these dates, the contribution from the installed wind generation was minimal. Models utilising 2017 and 2018 data, as shown in Figures 3 and 4, show similar high dispatchable generation requirements for multiple days during the May through June period. This corresponds to the period of minimum wind generation. With small changes to the demand or supply numbers, this could have been periods of 60 or more hours of continual dispatchable power requirement. The results from this simulation support the conclusion from the 2015 CSIR study on wind and solar aggregation (Knorr et al., 2015), as well as international experience, that dispatchable power must be provided to completely replace the renewable generation at times with minimum renewable energy supply (Wright et al., 2017; Clark et al., 2018). All scenarios modelled show this need to completely replace the renewable generation capacity with dispatchable power during this period of the year, even with the consideration of installed energy storage.
As seen in Figures 2-4, the model showed that installation of energy storage such as batteries or other technologies would reduce the hours of use for the dispatchable power but has minimum effect on the required installed capacity to meet these extended usage periods (as noted above). Thus, the cost of storage systems such as batteries must be justified by the fuel cost savings from the dispatchable generation (MWh) and not on any savings from reduced installed capacity (MW). As fuel costs are a significant portion of the cost of dispatchable generation, there is some economic benefit to reducing use of this resource, along with the reduction of greenhouse gas emissions from this generation. The National Renewable Energy Laboratory in the USA (NREL) has estimated that currently it is economical to install batteries for up to about four hours use in this fuel replacement comparison, which will increase somewhat as battery costs reduce over time (Clark et al, 2020; Cole & Frazier, 2019).
As will be reviewed in the following section, wind and solar with dispatchable gas generation can provide the needed electricity generation in a responsive manner at a cost lower than alternatives.
2.3 Cost of gas dispatchable generation
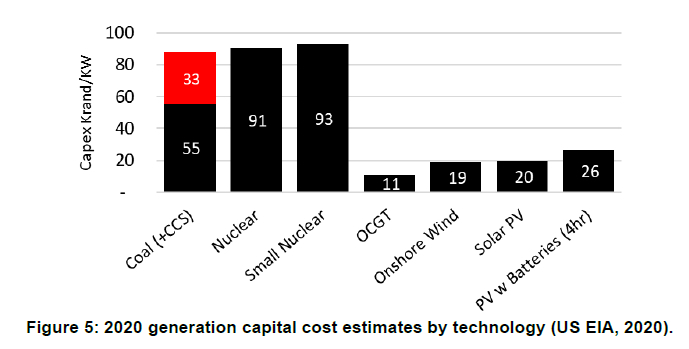
As can be seen from Figure 5, in 2020 the US Energy Information Agency (US EIA) estimated capital cost of generation from different technologies (US EIA, 2020). For a South African perspective, these have been converted into rands at a rate of ZAR 15 per USD. No additional costs for local content or importation were included. Coal plants have the indicated added cost for carbon capture and storage, as no new coal plant would be considered without this provision. As can be seen in this figure, open cycle gas turbine (OCGT) cost is less than 15% of the capital cost of generation plants using coal or nuclear fuel. Some of the capital cost difference between coal, nuclear and gas plants is recovered over time from the lower cost of fuel for coal and nuclear plants. Besides showing the distinct capital cost difference between nuclear, coal and gas plants, the capital cost comparison also shows significantly lower capital costs for solar and wind generation than for coal and nuclear plants. With no fuel costs for wind and solar generation, the levelised cost of electricity (LCOE) of these renewable sources is significantly less than for nuclear-, coal- or gas-fuelled generation (Lazard Associates, 2018; US EIA, 2019).
Operating costs and fuel costs are significant factors in comparing generation choices. Fixed operating cost estimates were developed by the US EIA (US EIA, 2020). OCGTs can be fuelled with a range of fuels including diesel, liquefied petroleum gas (LPG) and natural gas, as well as hydrogen. The fuel of choice will generally be the lowest cost for fuel delivered to the plant. Internationally, the lowest cost fuel of the three is almost always natural gas. In South Africa however, with no gas infrastructure, this might not be the case for all locations for gas delivered to the power plant. Gas supplied as liquefied natural gas (LNG) can be the lowest-cost fuel as long as importation and delivery costs are minimised. However, due to the high upfront capital costs for importation facilities, delivery costs might eliminate natural gas from consideration if the capacity factor (percentage utilisation) of the importation facility is low (Delphos International, 2019).
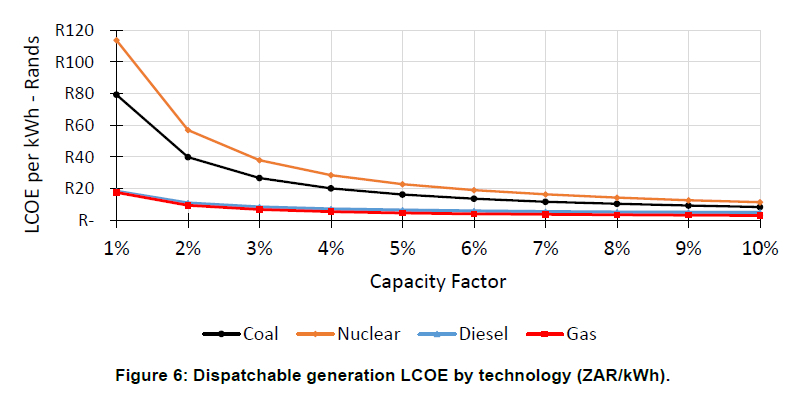
Due to the relatively high cost for fuel for dis-patchable generation, capacity factors are desirably lower than 10% and preferably, to minimise the related fuel costs, lower than 5%. In their 2019 Integrated Report, Eskom stated that their OCGT peaking plants were being used at 5.7%, compared to a target of 1% usage (Eskom, 2019b). In their analyses of the 2016 and 2018 IRP scenarios, the CSIR calculated that the lowest-cost scenario was one with less than 6% of the generation coming from the dis-patchable power. The analysis conducted in this study replicated this estimate (Wright et al., 2018).
Fuel cost is more of a factor for comparing base-load plants and becomes a much lower consideration as the capacity factor is reduced for dis-patchable power use. As can be seen in Figure 6, the LCOE differences between gas or diesel compared to other generation sources are significant in these low usage rates. The IRP 2019 indicates that the cost of unserved power is estimated to be ZAR 49 per kWh (DOE, 2019), so at the low usage factors expected from dispatchable power, natural gas, liquefied petroleum gas (LPG) or diesel generation can provide this power at cost below this value, while coal and nuclear generation cannot. Should green hydrogen become an economically competitive fuel after 2030, the OCGT power plants could be converted to use hydrogen as fuel (IEA, 2019; Siemens Energy, 2021).
With the lower capacity factors for solar PV and wind generation plus the variability of these two generation sources, the installed capacity for a system based on these sources, plus back-up dispatch-able power, must be 'over-built' compared to base load generation systems. The conclusion from the various CSIR studies is that the renewables-based system, even with the requirement for overbuilding, is still the lowest-cost option (Wright et al., 2018). Note that this over-build is based on a capacity (MW) metric and not energy generated (MWh).
The review of scenarios in this study confirms the conclusion that the cost of the grid supplied by renewable energy, backed up with dispatchable power generated by natural gas, is still the lowest-cost system that can be built, even with the need to provide extra capacity to handle the intermittency of the renewable sources of energy. Due to fuel costs, the lowest cost system minimises the use of dispatch-able power to that necessary to back up the renewable supplies when required.
3. Gas sources for South Africa
As noted above, internationally, gas has been shown to be the most economical fuel for dispatchable generation. In Europe and North America, which have major natural gas networks, the gas needed to meet the dispatchable generation can be provided using gas from the network. For South Africa, with a minimal existing gas network and almost no local production, the source of gas to meet this need is a major outstanding question that has not been addressed in the IRP planning process. This shortcoming is addressed in this study and the potential options are discussed below. All of the potential gas resources available were listed in the GMP, but no indication was made in that report about the ability to produce these resources at competitive costs.
3.1 Rompco pipeline
Sasol uses a pipeline bringing gas from its production fields in Mozambique to its coal-to-liquids plant at Secunda. It is reported by Rompco (2020) that the capacity of this pipeline is 200 PJ/a. Most of this capacity is in use, with the majority being used internally by Sasol at Secunda and Sasolburg. Some of the gas is delivered to gas-fuelled power plants in Mozambique at Ressano-Garcia near where the pipeline crosses into South Africa. Using 10% of the Rompco capacity would be enough to generate 5 GW of power with a 5% capacity factor, or 10 GW at a 2.5% capacity factor. This could meet most, if not all, of the dispatchable energy needs in the South African grid in 2030. To utilise this gas, it must be collected and stored to be dispatched as needed.
Sasol has indicated that the gas fields supplying this gas are reaching depletion and the gas rate will decrease from 2025 or 2026 (Creamer, 2019a). To continue supply through this system for the longer term, there has been discussion of importing LNG into Maputo harbour and feeding into the Rompco system there (Creamer, 2019b) . With the existing pipeline infrastructure in place, an existing customer base, and the market to fully utilise the throughput of the import facility in Maputo, this would appear to be the most economical method of bringing LNG gas into South Africa. The 200 PJ/a throughput for the Rompco pipeline would imply full usage for the Maputo terminal and a related regasification cost of less than USD 1 per GJ (US Department of Energy, 2018). With LNG-priced gas, some of the users will not remain economically viable, so there would likely be some reduction to this throughput but it should be still high enough to fully utilise the Maputo LNG terminal.
3.2Shale gas
The existence of local shale gas in the Karoo has been proven, as shown from the Soekor test wells (Rosewarne, 2014). However, the volume of commercially developable gas is an unknown, as is the development cost. While it is possible that there might be some exploration efforts continuing in the shale gas areas in South Africa, the probable timing and cost of this potential gas development minimises its usefulness for consideration in planning for gas dispatchable power, and analysis of potential development and production costs for this gas indicates that it is unlikely to be competitive with other fuel alternatives (Clark et al., 2021). The comparative likely cost of developing Brulpadda gas has decreased the attractiveness of shale gas in South Africa (Clark et al., 2019). The 2016 update of the IRP assumed use of indigenous shale gas to supply the needed fuel, but in subsequent updates this possibility has not been considered (DOE, 2016). For this analysis, South African shale gas has been ignored.
3.3Brulpadda
In February 2019, the oil and gas exploration consortium led by Total announced that they had discovered a significant gas condensate field in deep water south of Mossel Bay (Clark et al., 2019). The discovery was called Brulpadda and is one of five potential fields in the Paddavissie prospective area. Subsequent exploration drilling at the Luiperd prospect has confirmed the reserves. The GMP indicated that the proven gas from this development was over 3 TCF (85 BCM). Of more significance for the development of these fields, according to Africa Energy, one of the partners in the group, is that testing on the second well showed a flowrate of 33 million cubic feet per day of natural gas (MMcfpd) and 4 320 barrels of condensate per day (bcpd) (Africa Energy, 2020). This indicates a rich condensate mix, with enough condensate (oil) potential in the fields to completely support the field development and sale of the gas would be incidental. If the field is developed, it is most likely that this gas will be utilised at the Mossel Bay gas-to-liquid plant for production of liquid fuel.
This gas should provide the possibility of use of the Gourikwa OCGT power plant to provide dis-patchable power into the grid from the Mossel Bay area. The current capacity of this power plant is 740 MW but could be expanded, with the limitation being the ability of the electricity grid to take in power at this location. The plant currently uses diesel fuel (Eskom, 2014). One of the requirements to convert this plant to use Brulpadda gas for dispatchable usage will be the development of gas storage at the power plant (Clark et al., 2019).
3.4Pipeline from northern Mozambique
After the first versions of the IRP were developed, the oil and gas industry discovered one the world's largest natural gas fields in the Rovuma basin off the coast of northern Mozambique. This field is estimated to contain over 3 TCM of gas or 105 000 PJ (SPTEC, 2013), enough to keep the Rompco pipeline full for over 500 years. It is listed as the fifth-largest gas field in the world. Several pipeline proposals have been considered to bring some of this gas to South Africa. However, these proposals, even with government support from both countries, have not proceeded and the latest news is that they have been dropped due to lack of market (Frey, 2019). Sasol recently announced that it was withdrawing from participation in the development of this gas pipeline (Bloomberg, 2022). Currently, the planned development for Rovuma gas will be through LNG export into the international market (Zawadzki, 2019; Eni, 2017).
3.5Liquefied natural gas (imported through a new terminal)
LNG has an extensive international marketing presence and is the solution most 'gas-short' countries use to supply their gas markets. For South Africa, this has been the default assumption in all IRPs since the first in 2010, with the exception of the 2016 update as noted above (DOE, 2011). However, it was stated in that first IRP that dispatchable power alone would not be able to economically support an LNG importation infrastructure unless there are other significant markets (DOE, 2011). These markets have not materialised over the decade since then and, while several LNG terminals are under discussion, no projects have proceeded past feasibility analysis (Creamer, 2019c; Delphos International, 2019). The large upfront investment costs have stopped progress on this option. The required capital is likely to be in excess of USD 1 billion for the importation terminal and regasification facilities to meet the dis-patchable generation (Bischof-Niemz, 2019; Delphos International, 2019). As noted in the proposal for the Saldanha terminal (Delphos International, 2019), the development of these terminals to bring natural gas into the country would require the use of gas-fuelled baseload generation, which has been shown in the IRP process and the reviews from CSIR to not be the lowest-cost option. While the potential Maputo LNG terminal is supported by an existing infrastructure and customer base, none of the other proposals have these advantages, and it will likely not be developed unless this is forced by political considerations.
3.6Liquefied petroleum gas
LPG can be used in most applications where natural gas is utilised. LPG has many of the advantages of natural gas, with some additional advantages compared to natural gas. The major advantage, which it shares with diesel, is that it can be stored as a liquid at low pressure and ambient temperature. The pre-pandemic February 2020 government-regulated wholesale fuel cost for LPG would equate to ZAR 1.9 per kWh in comparison to diesel of ZAR 3.8 (Department of Minerals Resources and Energy, 2020). Based on the price for LNG in Japan at that time, natural gas would have an estimated cost of ZAR 1.4 per kWh (based on full usage of an LNG importation terminal). Thus, LPG would not be competitive with natural gas when both are available but is a realistic current option for diesel fuel replacement. LPG is currently imported into South Africa through terminals at Saldanha and Richards Bay and can be sourced from them (Bidvest, 2020; MOGs, 2020; Avedia Energy, 2022). LPG can be utilised for a quick diesel replacement solution and for some isolated peaking plants (Clark et al., 2022). LPG might present an option to reduce fuel costs instead of gas development.
4. Gas storage requirement
Dispatchable energy is used only occasionally, and must then be available in significant volumes. This makes fuel supply a challenge unless there is a system to provide significant buffer storage when large volumes are needed. For the South African grid it is expected that, by 2030, dispatchable energy must be available to supply up to 10 GW for short durations, with an expected 2% annual capacity factor.
For 10 GW of generation, the hourly rate would be 100 000 GJ per hour, or over four times the hourly capacity of the Rompco system, which has a maximum throughput of 23 000 GJ/h (US EIA, n.d.). The annual generation demand translates into a fuel requirement (per the IRP) of 27 PJ/a. This compares to the 200 PJ/a of gas currently imported into South Africa through the Rompco system. Thus, the annual demand would only be for less than 14% of the supply, but the instantaneous demand could be as high as 400% of total capacity. This small overall annual volume and significant variability makes it a challenge for any gas supply infrastructure to meet these demands.
Gas is a convenient and economical fuel to use for dispatchable power. However, it has always been known that there is a challenge to store enough gas to provide the volumes of gas needed when the dispatchable power is required. For liquid fuels, such as diesel, this storage is reasonably easy to provide in above-ground atmospheric pressure tanks. For natural gas, storing sufficient volumes of gas implies that the storage be done under pressure or that the gas be liquefied and stored as a liquid (Stevens, 2012). To maintain gas as a liquid, the storage temperature must be kept at -162 oC.
Internationally, subsurface geological storage is the primary gas storage mechanism, mostly in depleted gas fields and salt domes. Underground storage systems can be large, holding 250 million cubic meters or more - more than 10 million PJ of gas (US EIA, 2018). The major use for these storage systems is for seasonal storage, as the major gas demand in North America and Europe is for heating and increases significantly in cold weather (International Gas Union, 2014). As gas-fuelled dispatchable power generation has grown, more storage is being built and used for smaller volumes that can be accessed quickly (Stopa & Kosowski, 2018). The preferred subsurface storage for dispatchable power is in salt domes as quicker discharge can be achieved from them than from depleted oil and gas reservoirs or aquifers (International Gas Union, 2014).
In South Africa, with no history of significant oil and gas production, there are no suitable depleted underground zones for consideration. No salt domes are known to exist in the country. Abandoned mines present some opportunity for underground storage, but international experience with storage in abandoned mines has been negative due to challenges of sealing all leak passages (Raven Ridge Resources, 1998). Leaked gas from underground storage raises the cost and presents a danger of explosions. As indicated by Clark et.al. (2020), storage in abandoned mine shafts presents one potential option for underground storage in the Highveld that could be utilised for dispatchable generation there.
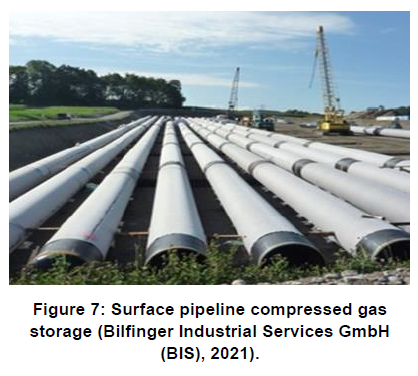
For dispatchable use, in Germany, Austria and Switzerland, in locations without suitable subsurface opportunities, several projects have been implemented to store compressed natural gas in pipeline arrays, or pipeline fields, at ground level, as shown in Figure 7. These storage systems use an array of conventional gas pipelines, laid out in a field pattern to store the gas (Kuhn, 2008)). The storage can be up to 100 bar, thus each 1 000 m section holds approximately 100 000 m3 gas. A 1 000 χ 500 m array with 200 loops would hold 20 000 000 m3. The cost for pipelines of this size is in the range of USD 1 million per kilometre, so this 200 loop system would have a cost in the range of USD 200 million (US AID, n.d.).
The challenge of natural gas storage must be resolved in order to meet the dispatchable generation requirement for the South African electricity grid using natural gas fuel.
5. Gas use scenario
With the likely demand profile for electricity in South Africa uncertain, the amount of generation required will remain unknown. However, as has been indicated in the previous sections, for whatever portion of the generation that is provided by variable sources, provision must be made for supplying all of the generation from dispatchable resources in the times where the variable sources do not provide the needed energy. The profile for the dispatchable generation will be indicated below along with the related storage requirement for gas.
5.2 Gas use profile
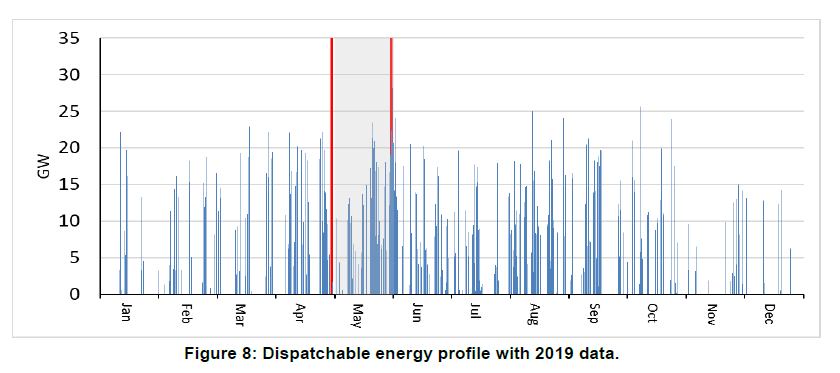
The profile of the dispatchable power required in the 100% renewables test scenario described above that was determined from the simulation model is shown in Figures 8, 9 and 10 for the three data years. The month of May is highlighted as the period between the two red reference marks. This indicates the hourly requirement for dispatchable generation for the year to balance the demand and supply of power from the variable generation sources. While dis-patchable energy will be used in small amounts throughout the year, starting in the May to June period, there is a period of extensive use of the dis-patchable generation. The specific days and weeks when this dispatchable generation is required vary from year to year but the overall profiles are all similar, with large dispatch required in winter.
This gas could be supplied from the Rompco system for dispatchable generation in the Highveld area, where most of the current generation and usage occurs. Assuming that the Maputo LNG terminal is constructed to continue supply through the Rompco system, this option does not require any major additional infrastructure investment.
Meeting the variable demand requires flexibility in supply of the gas in addition to buffer storage to meet demand peaks. If the flexibility on supply can be increased, the required storage volume can be reduced. However, this implies that the gas supplier or pipeline has available unused capacity or that gas for other customers be redirected. This is challenging for any gas supply system. For this analysis, it was assumed that the needed gas is from the Rompco system and that supply flexibility is limited.
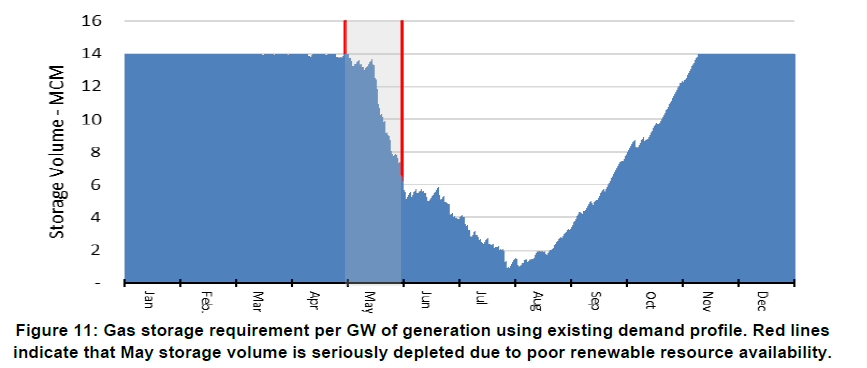
5.2 Gas storage requirement
The overall amount of dispatchable generation that will be required will be the result of a significant number of variables, including the decommissioning of the existing generation plants, the performance of the remaining base load plants, the speed of development of renewable generation, and the change in the demand profile. However, for any development scenario, dispatchable generation will be required and will likely be installed in nominal 1 GW units (Ankerlig is a 1.3 GW plant and Gourikwa is 0.7 GW) (Eskom, 2014). For the consideration on the fuel storage requirement, the usage profile from the previous section was split into the profile for a 1 GW plant. For this profile, the required annual fuel volume for the plant would be 1.7 PJ/a or an approxiimate average hourly rate of 200 GJ/h. For use, the instantaneous usage rate would be 10 000 GJ/h (US EIA, n.d.). With the assumption that fuel is put into storage at an average hourly rate of 200 GJ/h, the forecast total fuel storage volume requirement for a 1 GW plant would be 14 millon m3. The filling and depletion of the gas storage system is shown in Figure 11. As can be seen from this figure, the storage will remain mostly full until May (noted with the red lines), when it becomes used extensively through the winter months and then is restocked towards the end of the year. This is a similar storage volume discussed above for the power plants in Europe. This gas storage would add approximately 10-15% to the capital cost of a gas-fuelled OCGT power plant compared to one fuelled by diesel or LPG with simpler fuel storage requirements.
With the majority of the dispatchable generation likely to be developed in the Highveld within the network of the Rompco pipeline delivery area, the storage for use in that area could be developed centrally or at each plant. Central storage might facilitate the use of underground storage.
With proper gas storage at the power plant, Brul-padda gas could meet some of the demand in the south-western parts of South Africa. The existing Gourikwa generation facility could be expanded to utilise more of the Brulpadda gas, up to the ability to export electricity from this location within the Eskom grid.
As demonstrated in a recent analysis from Clark et.al. (2022), the option of LPG fuel should be considered for Ankerlig and for any remote peaking plant where natural gas is not readily available. LPG is stored at nominal temperature as a liquid at pressure of about 18 bar, so it is much easier to store the fuel needed at the power plant and to reprovision this storage on a batch basis from the import / storage facility.
5.3 Usage scenario
The development of dispatchable generation to support the lowest-cost renewable-based generation system will likely consist of generation using natural gas from Rompco and Brulpadda with LPG utilised in the locations where gas is not readily available. This dispatchable generation will not require any of the massive investments and shift to mid-merit gas-fuelled generation as proposed in the Gas Master Plan. If hydrogen becomes a competitively priced fuel source, each of these generation units could be converted to this fuel (Siemens Energy, 2021). The requirement for gas-fuelled dispatchable power is to develop an economically attractive method of providing natural gas at the volumes required, which implies gas storage. This gas-fuelled generation should be developed in steps that can be implemented in reasonable short time-frames. This would allow the supply to meet variable forecasted demand levels and to be able to do so without long lead time or large upfront investment.
6. Conclusion
With South Africa progressing towards a renewa-bles-based electricity grid, dispatchable energy must be provided to back up these generation sources, due to the variable nature of wind and solar generation. OCGT generation has several factors that make it responsive to the system requirements and hence appropriate for this service. The first factor is the lowest capital cost of the various generation technologies with an associated short pay-out period. The second is the modularity of generation facilities. The third consideration is the short development time. These three factors make OCGT dis-patchable power the most responsive option to a support a system in transition.
The operator of any OCGT plant has a choice of fuels for that plant and will generally select the lowest- cost fuel delivered to that plant. In the Highveld this should be natural gas supplied by the Rompco system. This option should continue, assuming that the Maputo LNG facility is built to keep the Rompco pipeline full. In the Mossel Bay area, this should be natural gas sourced from the Brulpadda development, assuming the Brulpadda development proceeds. In other plants, such as Ankerlig in the Western Cape, the fuel choice will likely be LPG, as natural gas imports will likely not occur unless other markets develop.
South Africa does not have any significant installed natural gas infrastructure, gas production or gas networks. However, for the small volume of gas needed for dispatchable generation to support a re-newables-based electricity grid, there is enough gas available without massive investment. The major challenge, as has been discussed in this review, is to provide for the storage of the gas for dispatchable usage.
Gas-fuelled dispatchable generation is a major element of the IRP forecasts. However, as has been demonstrated in this report, the planning and economics to provide this gas in the IRP scenarios has not been addressed. One of the major technical requirements to make this feasible is the ability to dispatch the gas as needed, implying that it must be stored and ready to be delivered in large quantities over short periods. The process of meeting this requirement for gas storage must become part of the national conversation for gas-fuelled generation.
Conflict of interest
The authors declare that they have no known competing financial interests or personal relationships that could have appeared to influence the work reported in this paper.
Author contributions
S. Clark: Formulation and execution of research, data analysis and write-up.
J. van Niekerk, J. Petrie: Research formulation, editorial input and supervision
C. McGregor: Background expertise, quality assurance and editorial input in write-up
References
Africa Energy. 2020. Africa Energy Announces Luiperd-1X Test Results. Available: https://www.africaenergycorp.com/news-releases/africa-energy-announces-luiperd-1x-test-results-122605/. [ Links ]
Avedia Energy. 2022. Avedia energy. Available: https://avediaenergy.com/. [ Links ]
Bidvest. 2020. LPG and the Mounded LPG Facility Mounded LPG Facility fast facts. Available: https://www.bidvest.co.za/bidvest-tank-terminals/about-Mounded-LPG-Facility.php [2020, September 20]. [ Links ]
Bilfinger Industrial Services GmbH (BIS). 2021. Natural gas accumulator / Urdorf, Switzerland. Available: https://bis-austria.bilfinger.com/en/references/energy-and-distribution/gas-storage-and-distribution/natural-gas-accumulator-urdorf/ [2021, May 21]. [ Links ]
Bischof-Niemz, T. 2019. Opinion: How should SA's gas infrastructure be configured for a least-cost power system? Engineering News. August: 1-8. [ Links ]
Bloomberg. 2022. Sasol to ditch South African pipeline project. businessTech. Available: https://businesstech.co.za/news/energy/577416/sasol-to-ditch-south-african-pipeline-project/#:~:text=Sasol will no longer consider,executive officer Fleetwood Grobler said. [ Links ]
BP. 2021. Statistical Review of World Energy. Available: https://www.bp.com/content/dam/bp/business-sites/en/global/corporate/pdfs/energy-economics/statistical-review/bp-stats-review-2021-full-report.pdf. [ Links ]
Clark, S., Van Niekerk, J. & Petrie, J. 2019. Brulpadda - Game Changer? Available: https://www.facebook.com/events/city-of-cape-town-energy-head-office-bloemhof-bloemhof-street-belville/brulpadda-a-game-changer/308643390008590/ [2020, July 01]. [ Links ]
Clark, S., Van Niekerk, J. & Petrie, J. 2020. The Use of Natural Gas to Facilitate the Transition to Renewable Electric Power Generation in South Africa. Stellenbosch University. Available: https://scholar.sun.ac.za/handle/10019.1/109312. [ Links ]
Clark, S., Van Niekerk, J., Petrie, J. & Fakir, S. 2021. South African shale gas economics: Analysis of the breakeven shale gas price required to develop the industry. Journal of Energy in Southern Africa. 32(1). Available: http://dx.doi.org/10.17159/2413-3051/2021/v32i1a8362. [ Links ]
Clark, S., Mcgregor, C. & Van Niekerk, J. 2022. Using liquefied petroleum gas to reduce the operating cost of the Ankerlig peaking power plant in South Africa. Journal of Energy in Southern Africa. 33(2):1-9. [ Links ]
Clark, S., Van Niekerk, J. & Petrie, J. 2018. Review of large independent electricity grid systems' transition to renewable generation and its relevance for South Africa. In SASEC 2018. [ Links ]
Cole, W. & Frazier, A. 2019. Cost Projections for Utility Scale Battery Storage Cost. Available: https://www.nrel.gov/docs/fy19osti/73222.pdf. [ Links ]
Creamer, T. 2015. Ressano Garcia's gas-to-power capacity rises to 400 MW as loop-line is completed. Engineering News. (March). Available: https://www.engineeringnews.co.za/article/ressano-garcias-gas-to-power-capacity-rises-to-400-mw-as-loop-line-is-completed-2015-03-05/rep_id:4136. [ Links ]
Creamer, T. 2019a. Call for greater urgency as South Africa approaches gas 'supply cliff'. Engineering News. Available: https://www.engineeringnews.co.za/article/call-for-greater-urgency-as-south-africa-approaches-gas-supply-cliff-2019-11-04. [ Links ]
Creamer, T. 2019b. Total , Gigajoule deal brings $ 350m Maputo LNG import terminal a step closer. Engineering News. (November):1-9. Available: https://www.engineeringnews.co.za/article/total-gigajoule-deal-brings-350m-maputo-lng-import-terminal-a-step-closer-2019-11-27. [ Links ]
Creamer, T. 2019c. Transnet and IFC team up in effort to catalyse Richards Bay LNG PPP. Engineering News. (July):1-13. Available: https://www.engineeringnews.co.za/article/transnet-and-ifc-move-to-catalyse-richards-bay-lng-infrastructure-ppp-2019-07-23. [ Links ]
Delphos International Ltd. 2019. Feasibility Study for the Western Cape Integrated Liquefied Natural Gas Importation and Gas-to-Power Project. Cape Town. Available: https://www.westerncape.gov.za/110green/download-lng-feasibility-study. [ Links ]
DOE [Department of Energy]. 2011. Integrated resource plan for electricity 2010-2030. DOI: 10.1016/j.wneu.2010.05.012. [ Links ]
DOE [Department of Energy]. 2015a. State of Renewable Energy in South Africa. Available: http://www.nstf.org.za/wp-content/uploads/2016/06/Policy-Brief_-State-of-Renewable-Energy.pdf. [ Links ]
DOE [Department of Energy]. 2015b. Draft South Africa Gas Utilisation Master Plan. [ Links ]
DOE [Department of Energy]. 2016. Integrated Resource Plan Update 2016. Pretoria. Available: http://www.energy.gov.za/IRP/2016/Draft-IRP-2016-Assumptions-Base-Case-and-Observations-Revision1.pdf. [ Links ]
DOE [Department of Energy]. 2019. Integrated Resource Plan (IRP2019). South Africa. Available: http://www.energy.gov.za/files/docs/IRP2019.pdf. [ Links ]
Department of Mineral Resources and Energy. 2021. South African Gas Master Plan: Basecase Report ( v 01 ). Available: http://www.energy.gov.za/files/media/explained/Gas_Master_Plan_Basecase_Report.pdf. [ Links ]
Department of Minerals Resources and Energy. 2020. Breakdown of petrol, diesel and paraffin prices as on 05 February 2020. Available: http://www.energy.gov.za/files/esources/petroleum/February2020/Breakdown-of-Prices.pdf. [ Links ]
Eni. 2017. eni achieves financial close for coral south flng. Available: https://www.eni.com/en-IT/media/press-release/2017/12/eni-achieves-financial-close-for-coral-south-flng.html#:~:text=SanDonatoMilanese(Milan)%2C,ExportCreditAgencyCoveredLoan. [ Links ]
Eskom. 2014. Ankerlig and Gourikwa gas turbine power stations. Available: https://www.eskom.co.za/sites/heritage/Pages/ANKERLIG-AND-GOURIKWA.aspx [2020, September 20]. [ Links ]
Eskom. 2019a. Renewables January 2015 - December 2019 (incl Sere) (Public Release). PRETORIA. [ Links ]
Eskom. 2019b. Integrated report 2019. Johannesburg. Available: https://www.eskom.co.za/IR2019/Documents/Eskom_2019_integrated_report.pdf. [ Links ]
Frey, A. 2019. Construction of gas pipeline between Mozambique and South Africa unlikely - Fitch. Club of Mozambique. July: 1-4. Available: https://clubofmozambique.com/news/construction-of-gas-pipeline-between-mozambique-and-south-africa-unlikely-fitch-solutions-138105/. [ Links ]
IEA [International Energy Agency]. 2019. The Future of Hydrogen. Paris. Available: https://www.iea.org/reports/the-future-of-hydrogen. [ Links ]
International Gas Union. 2014. Natural Gas Facts and Figures Chapter 4 - Underground Gas Storage. In Natural Gas Facts and Figures. Available: https://www.igu.org/. https://doi.org/https://www.igu.org/. [ Links ]
Knorr, K., Zimmerman, B., Bofinger, S., Gerlach, A., Bischof-niemz, T. & Mushwana, C. 2015. Wind and Solar PV Resource Aggregation Study for South Africa. [ Links ]
Kuhn, U. 2008. Safe and cost-effective pipe storage facility in Bocholt ( Germany ). 3R International. 1-4. Available: https://www.vulkan-shop.de/safe-and-cost-effective-pipe-storage-facility-in-bocholt-germany-3518. [ Links ]
Lazard Associates. 2018. hazard's levelized cost of energy analysis - version 12.0. Available: https://www.lazard.com/perspective/levelized-cost-of-energy-and-levelized-cost-of-storage-2018/#:~:text=AdditionalhighlightsfromLCOE12.0,coal%2C at%2436%2FMWh. [ Links ]
MOGs. 2020. Sunrise Energy LPG Terminal. Available: https://mogs.co.za/oil-gas-services/operations/sunrise-energy/ [2020, September 20]. [ Links ]
Mufson, S. 2021. South Africa has one of the most coal-intensive economies in the world. Can it change? Washington Post. 31 October. Available: https://www.washingtonpost.com/climate-environment/2021/10/31/south-africa-has-one-most-coal-intensive-economies-world-can-it-change/. [ Links ]
Planting, S. 2021. Best plan to keep the lights on: Solar and wind power officially cheaper than coal. Daily Maverick. 4 November. Available: https://www.dailymaverick.co.za/article/2021-11-04-best-plan-to-keep-the-lights-on-solar-and-wind-power-officially-cheaper-than-coal/. [ Links ]
Raven Ridge Resources. 1998. Gas Storage at the Abandoned Leyden Coal Mine near Denver, Colorado. Available: http://citeseerx.ist.psu.edu/viewdoc/download?doi=10.1.1.136.7586&rep=rep1&type=pdf. [ Links ]
Rompco. 2020. Rompco Historical Milestones. Available: https://www.rompco.co.za/historical-milestones [2020, September 20]. [ Links ]
Rosewarne, P. 2014. Background Information on Soeker Wells in the Karoo Basin. Karoo Groundwater Expert Group. 1-15. [ Links ]
Sasol. 2013. South Africa's First Gas-Fired Power Plant Fully Operational. Available: https://www.sasol.com/media-centre/media-releases/south-africa-s-first-gas-fired-power-plant-fully-operational#:~:text=Today%2C Sasolinaugurated the gas,of 140 megawatts (MW). [2020, September 20]. [ Links ]
Scatec. 2020. first-phase-of-scatec-solars-258-mw-solar-plant-in-south-africa-in-commercial-operation/. Available:https://scatecsolar.com/2020/02/18 [2020, September 20]. [ Links ]
Sepulveda, N.A., Jenkins, J.D., de Sisternes, F.J. & Lester, R.K. 2018. The Role of Firm Low-Carbon Electricity Resources in Deep Decarbonization of Power Generation. Joule. 2(11):2403-2420. DOI: 10.1016/j.joule.2018.08.006. [ Links ]
Siemens Energy. 2021. Siemens Energy is the first manufacturer to receive certification for "H2-Ready" power plant concept. Available: https://press.siemens-energy.com/global/en/pressrelease/siemens-energy-first-manufacturer-receive-certification-h2-ready-power-plant-concept [2022, June 12]. [ Links ]
SPTEC. 2013. Mozambique - The Emergence of a Giant in Natural Gas. Available: http://www.sptec-advisory.com/SPTEC_Advisory-Mozambique-The_Emergence_of_a_giant_in_Natural_Gas.pdf. [ Links ]
Stevens, B. 2012. Natural Gas Storage is Vital for Future Industry Growth. oilprice.com. June: 1-34. Available: https://oilprice.com/Energy/Natural-Gas/Natural-Gas-Storage-is-Vital-for-Future-Industry-Growth.html. [ Links ]
Stopa, J. & Kosowski, P. 2018. Underground Gas Storage in Europe - Energy Safety and its Cost. In World Gas Conference 2018. Washington DC. Available: https://www.researchgate.net/publication/326190746_UNDERGROUND_GAS_STORAGE_IN_EUROPE-ENERGY_SAFETY_AND_ITS_COST. [ Links ]
U.S.Department of Energy. 2018. Global LNG Fundamentals. Available: https://www.energy.gov/sites/defaulffiles/2018/03/f49/GlobalLNGFundamentals%2CUpdated3.15.18.pdf. [ Links ]
UNFCCC. 2015. Paris Agreement. Paris. DOI: FCCC/CP/2015/L.9/Rev.1. [ Links ] US AID. n.d. Natural Gas Value Chain: Pipeline Transportation. Available: https://sari-energy.org/oldsite/PageFiles/What_We_Do/activities/GEMTP/CEE_NATURAL_GAS_VALUE_CHAIN.pdf. [ Links ]
US EIA. 2017. Levelized Cost and Levelized Avoided Cost of New Generation Resources in the Annual Energy Outlook 2017. DOI: DOE/EIA-0383(2012) U.S. [ Links ]
US EIA. 2018. US Gas Storage. Washington DC. Available: http://ir.eia.gov/ngs/ngs.html [2019, January 01]. [ Links ]
US EIA. 2019. Levelized Cost and Levelized Avoided Cost of New Generation Resources in the Annual Energy Outlook 2019 Levelized Cost of Electricity. Available: https://www.eia.gov/outlooks/archive/aeo19/pdf/electricity_generation.pdf. [ Links ]
US EIA. 2020. Capital Cost and Performance Characteristic Estimates for Utility Scale Electric Power Generating Technologies. Available: https://www.eia.gov/analysis/studies/powerplants/capitalcost/. [ Links ]
US EIA. n.d. How much coal, natural gas, or petroleum is used to generate a kilowatthour of electricity? Available: https://www.eia.gov/tools/faqs/faq.php?id=667&t=6 [2020, September 20]. [ Links ]
Wright, J. & Calitz, J. 2022. Statistics of utility-scale power generation in South Africa in 2021. Available: https://researchspace.csir.co.za/dspace/bitstream/handle/10204/12067/Statisticsofutility-scale powergenerationinSouth Africa_Jul_2021.pdf?sequence=1&isAllowed=y. [ Links ]
Wright, J., Van Heerden, R., Mushwana, C. & Bischof-Niemz, T. 2017. Least Cost Electricity Mix for South Africa Optimisation of the South African power sector until 2050. Available: http://www.crses.sun.ac.za/files/news/CSIR_BischofNiemz_pp.pdf. [ Links ]
Wright, J., Calitz, J. & Kamera, P. 2018. Formal comments on Integrated Resource Plan (IRP) 2018. Pretoria. Available: https://researchspace.csir.co.za/dspace/handle/10204/10493. [ Links ]
Zawadzki, S. 2019. Anadarko approves $ 20 billion LNG export project in Mozambique. reuters. 1-5. Available: https://pgjonline.com/news/2019/06-jun/anadarko-to-proceed-with-20-billion-mozambique-lng-project#:~:text=(P%26GJ)-AnadarkoPetroleumCorp,pr. [ Links ]
* Corresponding author: Email: Sclark@sun.ac.za

