


Serviços Personalizados
Artigo
 Inglês (pdf)
 Artigo em XML
 Referências do artigo
Indicadores

Links relacionados
-
 Citado por Google
 -
 Similares em Google
Compartilhar

 Permalink
Journal of the South African Institution of Civil Engineering
versão On-line ISSN 2309-8775
versão impressa ISSN 1021-2019
J. S. Afr. Inst. Civ. Eng. vol.65 no.2 Midrand Jun. 2023
http://dx.doi.org/10.17159/2309-8775/2023/v65n2a3
TECHNICAL PAPER
Could a one-size-fits-all approach apply to the extension of stage-discharge relationships at flow-gauging weirs?
O J Gericke; V H Williams
ABSTRACT
At a flow-gauging weir, the stage or flow depth is normally measured continuously and converted into discharge using a stage-discharge (SD) rating curve (RC). During flood events, the observed water levels often exceed the flow-gauging weir's designed measuring capacity or structural limit. Subsequently, the standard calibration of the flow-gauging weir becomes irrelevant and the extension of the SD RC for above-structure-limit flow conditions is required. This paper attempts to identify a one-size-fits-all approach for the extension of SD RCs by assessing seven indirect hydraulic extension methods and a one-dimensional HEC-RAS modelling approach against direct SD measurements or extension methods at selected flow-gauging sites in South Africa. In considering a ranking-based selection procedure and associated goodness-of-fit (GOF) criteria, the stepped backwater analysis, slope-area method, and 1-D HEC-RAS steady flow modelling proved to be the most appropriate. The other indirect extension methods resulted in larger statistical differences between the at-site benchmark and modelled values. Given that the extension of RCs is significantly more affected by the site and river reach geometry, initial hydraulic conditions, flow regimes, and level of submergence at high discharges than the actual extension method used, it was confirmed that a one-size-fits-all approach cannot be applied for the extension of SD RCs in South Africa.
Keywords: above-structure-limit, extension, flow-gauging weir, rating curve, stage-discharge relationship
INTRODUCTION
The first flow-gauging weirs were constructed in 1904 in the Transvaal Province to measure streamflow continuously in South Africa (Menné 1960). By the year 2007, streamflow data had already been recorded continuously at 782 different Department of Water and Sanitation (DWS) flow-gauging sites, comprising sharp-crested weirs (55%), crump weirs (35%), and the remaining 10% consisting of broad-crested weirs, dam spillways, and velocity-area gauging sites (Wessels & Rooseboom 2009). However, streamflow is seldom directly measured; instead, the stage or flow depth is measured at regular intervals and converted into discharge using a stage-discharge (SD) rating curve (RC) at a flow-gauging weir or specific river section.
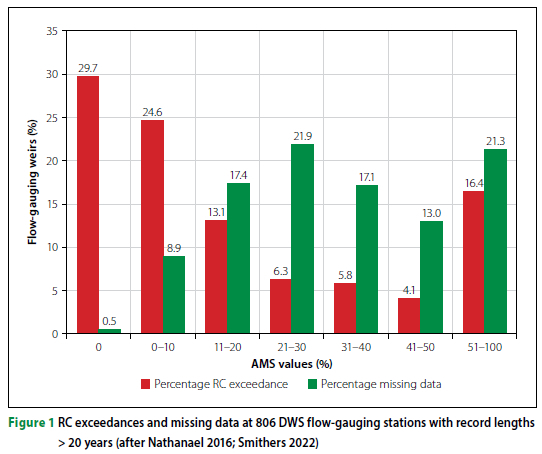
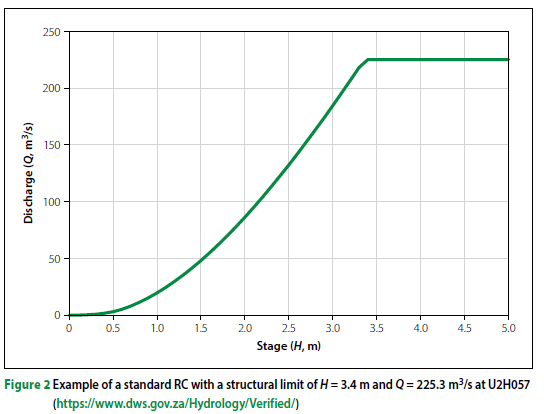
During flood events, the observed water levels often exceed the flow-gauging weir's designed measuring capacity or structural limit (Petersen-0verleir & Reitan 2009). Hence, the standard calibration of the flow-gauging weir will no longer be a true reflection of the actual discharges that had occurred during the flood events. The latter observed stage levels exceeding the maximum rated stage or flow depth (H) is a common problem in South Africa, as shown in Figure 1, where the RC exceed-ances and missing data are expressed as a percentage of the annual maximum series (AMS) at 806 DWS flow-gauging weirs with 20 or more years of record at each. For example, a standard SD RC, as shown in Figure 2, must then be extended beyond H to reflect the high discharges (Q) exceeding the designed measuring capacity. In general, such extensions are normally limited to bankfull flow conditions using appropriate indirect methods, while high flow extensions above bankfull flow conditions should only be considered in cases where the existing SD relationship includes floodplain flow on the full width of the floodplain (Gericke & Smithers 2017).
Direct measurements, e.g. conventional current gaugings, are not always possible owing to various practical constraints associated with high discharge events, e.g. high velocities and water depths, danger to staff and equipment entering a required river reach, and operational difficulties (Lang et al 2010). Therefore, developing reliable SD relationships at high discharges using direct measuring techniques becomes problematic (Lindner & Miller 2012). As a result, different indirect methods for extending SD RCs are available; however, the impact of using these different methods varies significantly and highlights the need for a robust and reliable extension method, since significant errors, uncertainty, and variable systematic discharge bias could be introduced (Lang et al 2010). For example, in flood hydrology, where probabilistic flood frequency analyses using the AMS are conducted to estimate design peak discharges, the exclusion of above-structure-limit discharges typically would result in the underestimation of flood events, while the inappropriate extension thereof could introduce uncertainty and ordered bias (Gericke & Smithers 2017). The latter is quite evident in AMS data sets having different plotting positions for flood events of equal magnitude, i.e. cases where the above-structure-limit of the flow-gauging weir was exceeded, and the standard RC (as shown in Figure 2) becomes irrelevant.
Various international studies were undertaken in an attempt to develop robust and reliable RC extension methods. For example, the Environmental Agency in the United Kingdom (EA UK), undertook a study entitled Extension of Rating Curves at Flow-gauging Stations to compile a best practices manual using hydraulic and computational modelling techniques (Ramsbottom & Whitlow 2003). Dymond and Christian (1982) evaluated the accuracy of SD RCs by considering both the individual and average discharge measurement errors during a specific period. Petersen-0verleir and Reitan (2009) examined the joint impact of sample variability and RC inaccuracy on at-site flood frequency analysis. Lang et al (2010) extended SD RCs using hydraulic modelling to ultimately improve flood frequency analyses. Shao et al (2018) extended SD RCs using hydrodynamic models and, as a result, quantified the uncertainty associated with the overall process.
However, despite all the above studies, there are currently no user manual or standard practices available to extend SD RC relationships in South Africa. The absence of standard practices to extend SD RCs is ascribed to the different and unique hydraulic characteristics, topography, and discharge conditions present at South African flow-gauging sites; hence, site visits and a fundamental understanding of the at-site hydraulics are crucial to ensure the accurate extension of SD RCs. In the absence of sufficient (high resolution) topographical data and site surveys, Gericke and Smithers (2017) recommended that individual stage extensions (HE), whether for bankfull or above bankfull flow conditions, should be limited to a maximum of 20%, i.e. HE < 1.2 H. In the case of above bankfull flow conditions, the relevance of the general extension procedure described above should be tested and compared to other relevant hydraulic extension methods, e.g. stepped backwater analysis (SBA) and/or slope-area method (SAM) if surveyed cross-section data is available. In addition to the above-mentioned 20% limit, the hydrograph shape, especially the
peakedness due to a steep rising limb in relation to the hydrograph base length, and the relationship between the observed peak discharge (Qpx) and associated direct runoff (Qdxi) values, should be used as additional criteria to justify the HE extensions up to 20%. Typically, in such cases, the additional volume of direct runoff (QDE) due to the extension should be limited to 5%, i.e. QDE <0.05 QDXi
Given that the use of appropriate SD RC extension methods is warranted not only to enhance the estimation of design flood events, i.e. peak discharges, but also to impact on water resources management, this paper attempts to identify a one-size-fits-all approach for the extension of SD RCs by assessing a selection of indirect extension methods (e.g. hydraulic and one-dimensional modelling approaches) against direct extension (benchmark) methods (e.g. at-site conventional current gaugings, hydrograph analyses, and level pool routing techniques) at selected flow-gauging sites in South Africa. In this paper, it is assumed that the SAM, and by extension the divided channel method (DCM), are more appropriate and hydraulically correct than the other SD extension methods available. However, the SBA is regarded as being more accurate than the SAM, while one-dimensional hydraulic models (e.g. HEC-RAS) better illustrate the actual hydraulic conditions in a river reach than simple hydraulic methods.
MATERIALS AND METHODS
A review of the seven indirect hydraulic extension methods and one-dimensional HEC-RAS modelling is discussed in this section, followed by an overview of the location and characteristics of the selected flow-gauging sites. Thereafter, the methodologies adopted are expanded on in detail, followed by the results, discussion and conclusions.
Review of indirect hydraulic extension methods
It is essential that a hydrometric data, gauging, and rating review be conducted prior to extending any SD relationship (Ramsbottom & Whitlow 2003). The following hydraulic methods were considered and applied at each site: a. Simple extension (SE): The SE uses the rating equation for the highest limb of the RC to extend the SD relationship to stages exceeding the above-structure-limit, or conversely, for the lowest segment in the case of lower stages (EA UK 2002). The application of the SE is limited to uniform channel cross-sections and bankfull flow conditions throughout the entire RC range (EA UK 2003). The SE is unsuitable for: (i) above bankfull flow conditions, and (ii) any transitions from in-channel flow to overbank full flow conditions, modular to submerged flow conditions and vice versa, submerged flow to complete channel control flow, or where any changes in vegetation and cross-sections occur.
b. Logarithmic extension (LE): The LE has similarities to the SE; however, the stage and discharge are plotted on a logarithmic scale. The advantage of the LE is that it can accommodate changes in the slope of the rising limb of an RC (EA UK 2002; Ramsbottom & Whitlow 2003). According to the British Standards Institution International Organization for Standardization (BSI ISO 1998), the LE is not recommended, given that it can generate substantial errors and is regarded as inferior to the SE in many ways. Essentially, the LE is a modified version of the SE limited to a first-order polynomial function. The same hydraulic conditions, limitations, and data requirements as applicable to the SE, apply to the LE.
c. Velocity extension (VE) methods: The VE methods can only accommodate limited changes in the channel section geometry for above-structure-limit conditions, while transitions from modular to submerged flow conditions are normally poorly presented (EA UK 2003).
The hydraulic conditions, which are regarded as unsuitable for the SE, also apply to the following VE methods: i. Velocity extension simple approach (VE-SA): The VE-SA requires the computation of the cross-sectional area and velocity at incremental river stages similar to the stages used to derive the existing SD relationship. The RC extension is based on an extension of velocity against stage. One cross-section is required at the flow-gauging site to calculate the change in cross-sectional area with stage. Once the velocity (v) and cross-sectional area (A) have been derived, the discharge (Q) can be determined using the conservation of mass (Ramsbottom & Whitlow 2003).
ii. Velocity extension hydraulic radius approach (VE-HRA): In using the VE-HRA, a plot of velocity against hydraulic radius (R) frequently presents a linear relationship; this can also be used to provide values of velocity in the extended range of the RC. Once v and A have been derived, Q can be determined using the conservation of mass (Ramsbottom & Whitlow 2003).
iii. Velocity extension Manning's approach (VE-MA): In using the VE-MA, the Manning's equation is used by assuming that the square root of the channel slope (So1/2) and Manning's roughness coefficient (n) are constant across the full range of discharges when compared to AR2/3. The relationship of Q versus AR2/3 is then extended to provide the SD relationships for above-structure-limit conditions (Ramsbottom & Whitlow 2003).
. Slope-area method (SAM): The SAM considers the hydraulic radius, cross-sectional area, channel bed (water surface) slope, and roughness coefficients (e.g. Manning's n-values or Chézy's ks-values) to determine the SD relationship at a given site. Two approaches are associated with SAM, i.e. the simple approach (SA) and the DCM (EA UK 2002). In using the SAM-SA, the cross-sectional areas and water surface slopes are determined for a range of discharges, while the mean velocity and discharge in the channel are calculated using Manning's or Chézy's open-channel flow equation (EA UK 2002).
The SAM-DCM requires surveyed cross-sections that include the main channel and floodplains. The surveyed cross-sections are divided into three panels using vertical division lines, i.e. the left bank floodplain, main channel, and the right bank floodplain. The channel rating is extended above bankfull, assuming no friction on the vertical boundaries for above bankfull flow conditions. Separate ratings are calculated for each component using different roughness coefficient values and summed to obtain a rating for the section (Ramsbottom & Whitlow 2003). Although being regarded as a much more versatile method and less sensitive than the SE, LE, and VE methods, similar hydraulic conditions, limitations, and data requirements could apply to the SAM.
e. Stepped backwater analysis (SBA):
The SBA is based on the standard step method and applies to the gradually varied flow (GVF) regime in non-prismatic channels. Field survey data is required, e.g. the longitudinal river profile, cross-sections, and a detailed description of the roughness coefficients applicable to each cross-section (Chow 1959). The SBA calculations are done on a trial-and-error (iterative) basis, which can be easily automated using solver functions in Microsoft Excel.
f. 1-D HEC-RAS modelling: The United States Army Corps of Engineers (USACE) developed the Hydraulic Engineering Centre River Analysis System (HEC-RAS) software, with Version 1.0 having been released in August 1995 (Maeder 2015). The software can perform one-dimensional steady flow, two-dimensional unsteady flow, sediment transport, and water temperature or quality modelling. The steady flow analysis in HEC-RAS is based on the GVF theory. In applying the energy equation, energy losses are assessed by friction and contraction or expansion coefficients. The momentum equation applies to situations where the water surface profile varies rapidly, e.g. hydraulic jumps, flow conditions at bridges, and river confluences (USACE 2016).
Flow-gauging sites
Initially, all the SD extension reports available from DWS, i.e. the Discharge Table Improvement Reports, were studied, given that a standard SD rating table is regarded as the first step towards the extension of any SD relationship. Subsequently, a total of 10 flow-gauging sites, as shown in Figure 3, were identified and selected.
In terms of the hydrometric and geometric data requirements, the selection of the flow-gauging sites took the following aspects into consideration: a. Streamflow data: Record length, data quality, flow duration curves to highlight the occurrence and frequency of minimum and maximum flow ranges, and the number of standard and extended SD relationship tables or curves available.
b. Hydraulic conditions: Modular and/ or submerged flow conditions, variable submergence due to backwater effects and vegetative growth, identification of possible hydraulic controls, sediment transport, unsteady flow conditions, and the influence of in-bank and out-of-bank flow paths.
c. Geometric properties: Type of flow-gauging weir, e.g. sharp or broad-crested, crump, hydro-flumes, broad-crested flank walls, flood or natural sections, overall river topography and layout, river channel and flood plain geometry, position of control points within the river system (especially at high flows), availability of survey data (e.g. cross-sections, longitudinal sections, previous flood surveys, and the previous or current allocation of site-specific roughness coefficients).
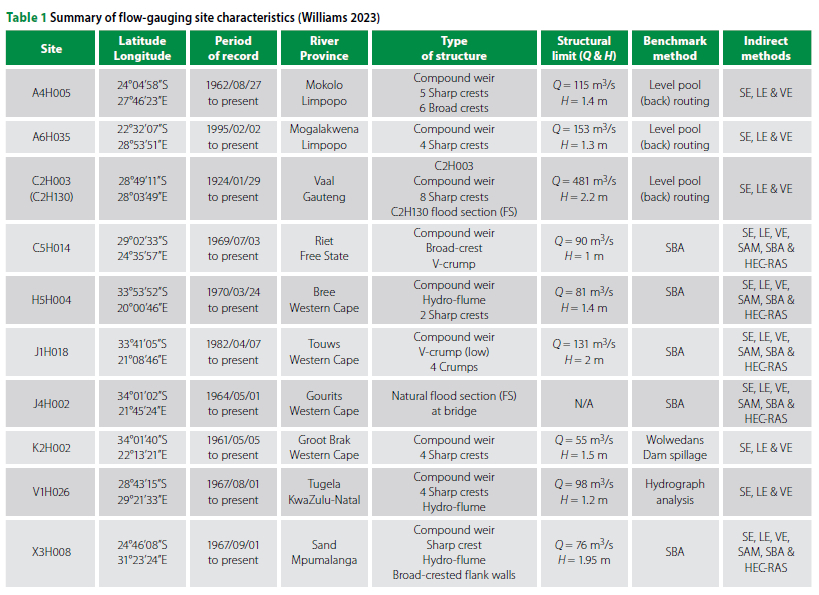
Typically, the chosen flow-gauging sites in Figure 3 are characterised by complex flow (hydraulic) conditions and are not necessarily sites that had gradual changes in geometric properties. Ultimately, the sites chosen are inclusive of the following problem areas: (i) submergence, (ii) estimation problems, (iii) complex geometry, and (iv) unsuitable sites (e.g. J4H002) for the construction of flow-gauging weirs. Given the complex conditions and lack of sufficient geometric data available at some of these flow-gauging sites, not all the above-listed indirect hydraulic extension methods could be applied. Table 1 contains a summary of all the relevant characteristics present at each flow-gauging site.
Processing of geometric data
The processing of geometric data, e.g. wetted perimeter, wetted area, and hydraulic radius, was done using the Windows Cross-Section Professional (WinXSPRO) (Hardy et al 2005), which is essentially a channel cross-section analyser. Prior to the use of WinXSPRO, all the files were generated in Microsoft Excel with Position-Elevation Free Form as the data format. In this paper, the outputs related to stage (H), area (A), wetted perimeter (P), and hydraulic radius (R), were used in the further computations.
Development of a semi-automated extension tool
A semi-automated extension tool was developed in the Microsoft Excel environment to enable the consistent application of the various hydraulic extension methods with limited manual user input. The semi-automated tools consist of different functions (as applicable to each hydraulic extension method) to ultimately provide peak discharges at specific stages above the structural limit.
SE and LE methods
The analyses were conducted and automated in two distinctive phases: (i) up to structural limit, and (ii) above structural limit. Rating curves, for the whole H-range were generated automatically, while any trend line evaluations were done manually to determine the best-fit polynomial function based on the coefficient of determination (r2) and the estimated discharge (QE). In each case, the best trend line equation was used for the required extension.
VE methods
All the VE methods shared an input worksheet, with inputs for H, A, R, and v up to structural limit and separate inputs for above-structure-limit geometric properties. Essentially, first-order polynomial equations were generated to enable the RC fitting and subsequent extension of the SD relationships for above-structure-limit conditions.
SAM
Essentially, the SAM is not regarded as a simplified computation where Manning's (MA) or Chézy's (CHZ) equation for open-channel flow is just used to determine discharges at different stages. Hence, the following steps are typically required and were applied accordingly to determine the: (i) upstream and downstream conveyance from known geometric and hydrometric properties (using separate worksheets for SAM-MA and SAM-CHZ), (ii) average conveyance, (iii) energy slope by assuming the velocity head equals zero, and (iv) corresponding discharge and assumed discharge. These steps were automated in Microsoft Excel using Visual Basic for Applications (VBA) and the GOAL SEEK function.
SBA
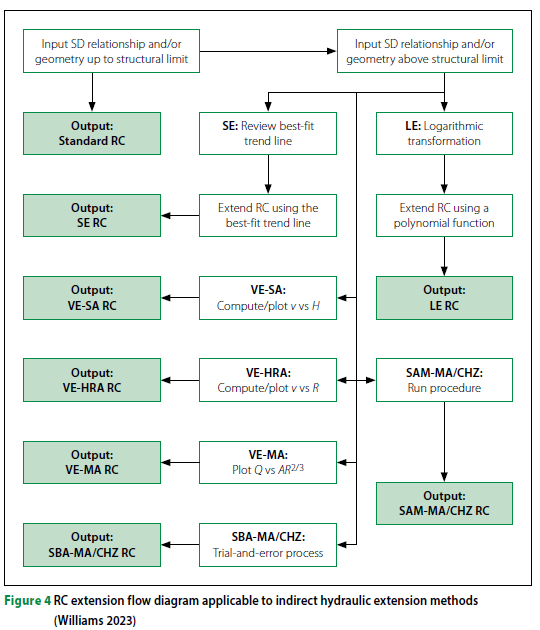
The developed SBA worksheet is based on the methodology proposed by Chow (1959), i.e. the standard step method for natural (non-prismatic) channels. The Froude number (Fr) for each cross-section was determined to define the flow regime, i.e. super- and/or sub-critical flow. Essentially, iterative trial-and-error calculations were used until channel profile convergence was reached, i.e. the profile approximates the uniform depth profile and energy levels are in equilibrium. The procedure matrix or flow diagram associated with all the indirect hydraulic extension methods is shown in Figure 4.
1-D HEC-RAS steady flow modelling
The modelling in HEC-RAS was limited to steady flow analyses at the flood sections only, given that the calibration data at the flow-gauging weirs is regarded as unsuitable for RC extensions at above-structure-limit flow conditions. In addition, the calibration data also lacks the information required to conduct an unsteady flow analysis for the full range of flows at the various flow-gauging sites under consideration. The desired flow regime, i.e. sub-critical, supercritical, and/or mixed flow, was defined prior to the actual simulation run by specifying the boundary conditions.
Typically, the known water surface elevations (up- and downstream) were used as the default boundary conditions at most of the flow-gauging sites under consideration. In the absence of these known water surface elevations, the critical depth was entered as the downstream boundary condition, given that sub-critical flow conditions (Fr < 1) were present at all the flow-gauging sites under consideration. The simulated water surface levels were compared to the observed water levels, while adjusting the Manning's n-values until similar water surface levels were reached.
Assessment of results
A ranking-based selection procedure was developed to evaluate and select the best performing indirect hydraulic extension methods at each flow-gauging site. In other words, the indirect extension method's estimation results (QE) were compared to the at-site or benchmark extension results (QB) at each site (i) by considering a large set of quantitative GOF criteria (Zhong & Dutta 2015) to assess each method's accuracy and bias. Typically, the standard error of the estimate (SEE, Equation 1), mean absolute relative error (MARE, Equation 2), root mean square error (RMSE, Equation 3), coefficient of determination (r2, Equation 4), Nash-Sutcliffe coefficient (NSE, Equation 5), and the z-test (Equation 6), were used as assessment criteria to compare and assess the indirect extension methods' results to those of the at-site direct extension (benchmark) methods. The z-test indicates how many standard deviations a sample scores above or below the mean, and the results are classified as: (i) similar (0 < z < 2), (ii) marginally different (2 < z < 2.5), (iii) significantly different (2.5 < z < 3), and (iv) unacceptable (z > 3) (Williams 2023).
Each indirect hydraulic extension method was ranked against the different GOF criteria and summed and/or averaged to provide the overall performance. Finally, the overall rankings and associated relative frequency of the various z-test ranking clusters - as defined in (i) to (iv) above -were used to establish the hierarchical order of the various indirect hydraulic extension methods.
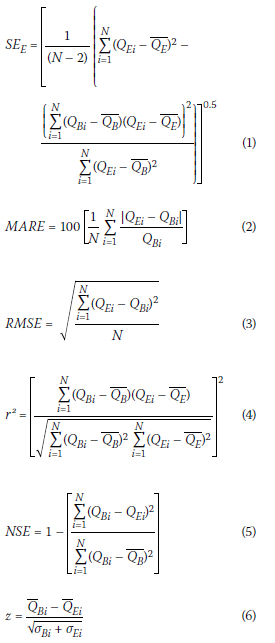
Where:
SEE is the standard error of estimate (m3/s)
MARE is the mean absolute relative error (%)
RMSE is the root mean square error
r2 is the coefficient of determination
NSE is the Nash-Sutcliffe coefficient
z is the z-test score
N is the sample size
QBi is the at-site benchmark discharge (m3/s)
Qb is the mean of the at-site benchmark discharge (m3/s)
Qeí is the estimated (indirect) discharge using extension methods (m3/s)
Qe is the mean of the estimated (indirect) discharge (m3/s)
σBi is the standard deviation of the at-site benchmark discharge (m3/s) is the standard deviation of the estimated (indirect) discharge (m3/s).
RESULTS AND DISCUSSION
In this section, the overall ranking results associated with each flow-gauging site are presented in a summative format. However, given that all the indirect hydraulic extension methods and HEC-RAS modelling were applied at flow-gauging site X3H008, the latter gauging site is discussed in detail as a representative example. Thereafter, the overall results and performance achieved at the 10 flow-gauging sites are discussed collectively.
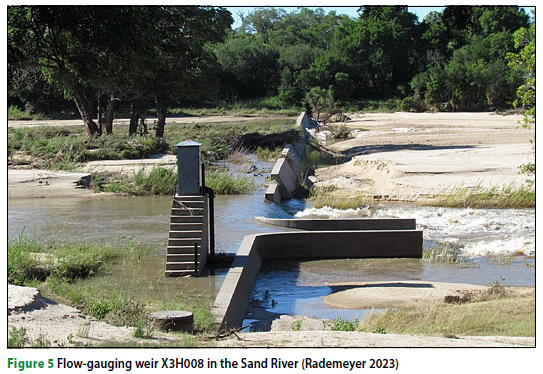
Flow-gauging weir X3H008
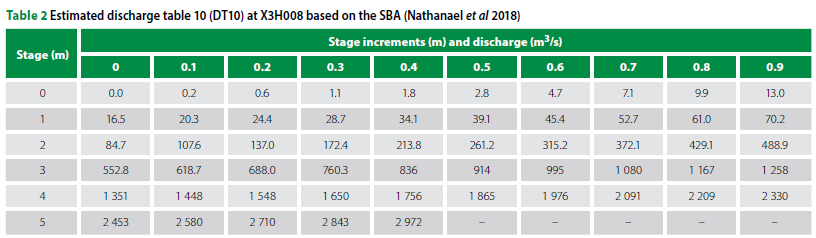
Flow-gauging weir X3H008 is located in the Sand River, Mpumalanga Province. The weir was constructed in 1967. As shown in Figure 5, the structure consists of a sharp-crest, hydro-flume, and broadcrested flank walls (Mathole 1999). The structural limit is at a stage of 1.95 m, with an associated discharge of 76 m3/s. In the latest DWS Calibration Report, the SBA was used as the preferred SD extension method. Hence, the SBA was also used as a benchmark against which the other indirect extension methods were compared up to a stage of 5.4 m and corresponding discharge of 2 972 m3/s. The most recent cross-sectional survey at the flow-gauging weir is inclusive of five flood sections (FSs). The current (existing) SD relationship table (DT10) applicable to X3H008 is listed in Table 2.
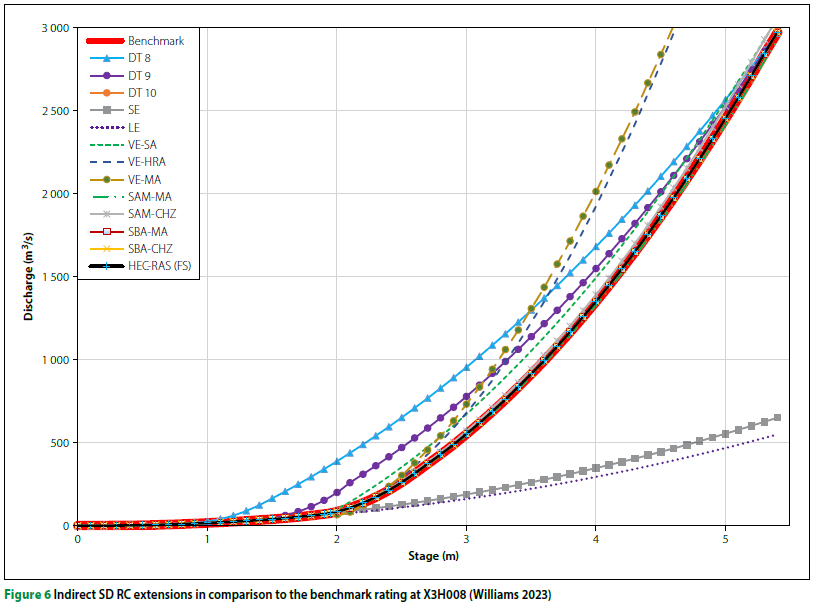
The SD RC extension results using all the indirect hydraulic extension methods and HEC-RAS modelling are shown in Figure 6 (on page 24). The GOF statistics applicable to each method are listed in Table 3 (on page 24).
In Table 3, the various indirect SD extension methods, except for the SE, LE, and SAM-MA methods, provided estimated discharge (Qei) values that exceeded the at-site benchmark discharges (Qbi)- The latter underestimations using the SE and LE methods were evident for stages (H) > 2 m (65% < MARE < 70%), while the SAM-MA underestimations were much less significant, with MARE = 1.5%.
Given that the SBA-CHZ method is used as the benchmark method (default ranking = 1) at this site, the SBA-MA demonstrated the second-best overall ranking, followed by the HEC-RAS (FS) modelling in the 3rd position. By considering the individual GOF statistics, the latter SAM-CHZ and SAM-MA methods also proved to be equally accurate by being interchangeably ranked at either the 4th or 5th position. Overall, the LE is the most inappropriate method with the poorest ranking for all the GOF statistics under consideration.
Overall, the hydraulically correct methods resulted in the lowest SEE MARE, RMSE, and z-test values. All the methods demonstrated a high degree of association, with r2 values > 0.99; however, this only highlights a high correlative trend between the estimated Qei values as suggested by the various extension methods and the benchmark Qbi values. Hence, the NSE results should also be considered, whereas the VE-HRA and VE-MA methods demonstrated the lowest NSE values of ± 0.19 despite their r2 values ~ 0.99.
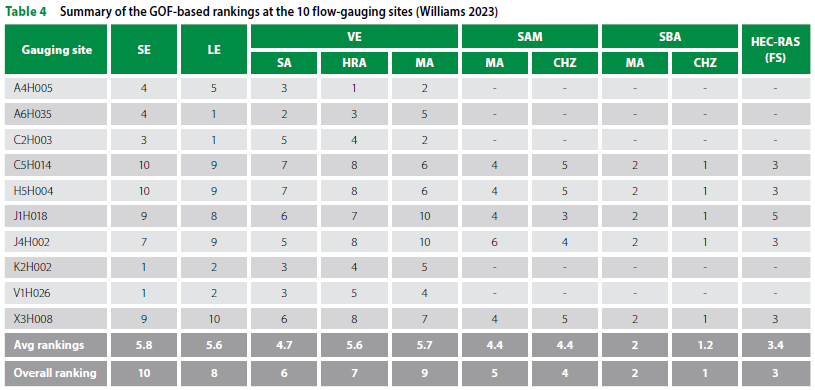
Summary of results
The overall ranking results, as listed in Table 4, highlight that the SBA, SAM, and 1-D HEC-RAS steady flow modelling performed the best. The other indirect extension methods were characterised by larger statistical differences between the at-site benchmark values (QBi) and the modelled values (QEi). The VE-MA and SE methods are regarded as the least appropriate methods, ranked respectively in the 9th and 10th positions.
SE performance
The SE method is ranked overall in the 10th position. The method tends to either over- or underestimate the at-site benchmark discharges (QBi). At K2H002 and V1H026 it provided satisfactory results due to no changes in the geometry or hydraulic conditions above the structural limit. This method is not suited to extend SD relationships at sites with complex hydraulics or geometry, and the use thereof should be limited to flow-gauging sites with adequate data and reasonably simple site characteristics and hydraulics. It demonstrated the poorest performances at C5H014 and H5H004.
LE performance
The LE method is ranked overall in the 8th position. The method tends to either over-or underestimate the at-site benchmark discharges (QBi). At A6H035 there are no apparent transitions beyond or above the structural limit; hence, the subsequent number one ranking at this site. The LE method performed marginally better than the SE method at all the flow-gauging sites under consideration, except at A4H005, J4H002, K2H002, V1H026, and X3H008. However, this method is not recommended for significant extensions above the structural limit; typically, in these above-structure-limit ranges, it proved to result in estimated discharges (QEi) significantly different from the benchmark discharges (QBi).
VE performance
The VE-SA (6th position) and VE-HRA (7th position) methods performed better than the VE-MA (9th position) method; however, the application of all these methods was limited by data availability. The VE methods require a complete cross-section of the weir at high flows, and such data sets were not available at most of the sites under consideration, except at A4H005 where these methods were ranked as the top three methods. Hence, based on the promising results achieved at some of the flow-gauging sites, the VE methods should be considered more often when SD relationships need to be extended. The VE methods are also simpler to apply as opposed to the often-preferred SAM and SBA methods.
SAM performance
The SAM-CHZ is ranked overall in the 4th position, while the SAM-MA is ranked in the 5th position. In comparison to the SE, LE, and VE methods, it is hydraulically more correct. At J1H018 and J4H002, the SAM-CHZ proved to be hydraulically more correct (3rd to 4th position) and agreed well with the SBA. By considering the individual GOF statistics, the SAM-CHZ and SAM-MA methods also proved to be equally accurate at flow-gauging sites C5H014, H5H004, and X3H008 by being interchangeably ranked at either the 4th or 5th position.
SBA performance
The SBA-CHZ is ranked overall in the 1st position, while the SBA-MA is ranked in the 2nd position. However, the SBA was also used as the preferred benchmark method at 50% of the flow-gauging sites under consideration. The latter preferential use and associated rankings were also confirmed by Roux et al (2015): "From experience, DWS Flood Studies regard the SBA method as superior to the SAM when flood peaks need to be estimated" The latter statement is also supported in international literature. The SBA is also less affected by hydraulic conditions than the SAM, and is therefore regarded as a more versatile method.
The Chézy's absolute roughness (ks) version of the SBA, i.e. SBA-CHZ, is preferred to the Manning's n-value version (SBA-MA). This is ascribed to the fact that Manning's n-value is expressed in non-measurable units, i.e. s/m1/3, and is constant for a given discharge associated with a specific velocity and hydraulic radius. The Chézy equation makes allowance for changes in the roughness coefficient C (m0.5/s), as changes in the flow depth and subsequently the hydraulic radius (R) occur. As a result, channel profile convergence is normally achieved sooner when Chézy's C-value (function of ks and R) is used in the SBA. Manning's n-value does vary with changes in the hydraulic radius; however, there is no explicit mathematical procedure to determine this. Additionally, it is also easier to visualise Chézy's absolute roughness (ks) as it represents the sizes of irregularities on the channel beds and sides, expressed in metres.
It is also important to note that the starting water surface level or elevation in the SBA is regarded as unknown or indefinite; hence, several backwater profiles based on different arbitrary water surface levels should be computed until convergence occurs, i.e. the water levels correspond with the uniform flow profile and energy levels are in equilibrium. Therefore, if convergence is not reached (probably owing to insufficient cross-sectional survey data), additional and more distant (up- and/ or downstream) cross-sections would be required. At some of the flow-gauging sites under consideration, DWS had already established an arbitrary datum (reference level), and known water surface levels (e.g. flood marks). Subsequently, defining an arbitrary point to reach profile convergence was not required in these cases.
In assigning roughness parameters, i.e. Manning's n-values, it should not be limited to a cross-section, but it should rather be representative of the entire river reach under consideration (George et al 1989). Observations made during this study confirmed the difficulty in assigning Manning's n-values for a river reach and the cross-sections under consideration. Hence, the combined influence of various input parameters (e.g. flow depth, turbulence, bed forms, vegetation, sedimentation and bed load, debris, obstructions, cross-section shape, geomorphological processes, and floodplain-main channel interactions) needs to be considered when assigning n-values during high flows (Lumbroso & Gaume 2012). Irrespective of the method used - e.g. SAM, SBA and/or HEC-RAS - if representative and correct n-values are assigned, comparable results will be achieved.
HEC-RAS performance
It was evident that the HEC-RAS results improved as the number of more detailed and distant cross-sections increased. Therefore, by having a continuous surface, i.e. digital terrain model, from which high-accuracy cross-sections can be extracted, the modelling results can be improved significantly. Typically, owing to insufficient data being available, no HEC-RAS modelling was possible at flow-gauging sites A4H005, A6H035, C2H003, K2H002 and V1H026. At the latter flow-gauging sites, only calibration data up to the structural limit was available, subsequently resulting in discontinued flow at above-structure-limit conditions. In applying HEC-RAS at data deficient flow-gauging sites, overestimations will typically occur up to the structural limit, while above-structure-limit flows will either be under-or overestimated.
CONCLUSIONS
The overall aim of this paper was to assess a selection of indirect hydraulic extension methods against direct extension (benchmark) methods at selected flow-gauging sites in South Africa. In terms of the benchmark methods, the following approaches were used at the various flow-gauging sites: (i) dam spillage (K2H002), (ii) hydrograph analysis (V1H026), (iii) level pool (back) routing (A4H005, A6H035, and C2H130), and (iv) SBA (C5H014, H5H004, J1H018, J4H002, and X3H008).
The SBA-CHZ was ranked overall in the 1st position, while the SBA-MA was ranked in the 2nd position. The SBA was used as the preferred benchmark method at 50% of the flow-gauging sites under consideration, given that the SBA is less affected by hydraulic conditions than the SAM and is therefore regarded as a more versatile method. The HEC-RAS steady flow modelling was ranked overall in the 3rd position. In principle, the HEC-RAS steady flow modelling is also based on the SBA; hence, the latter performance was expected. However, the steady flow modelling was in general limited by data suitability and availability. It was evident that the HEC-RAS results improved as the number of more detailed and distant cross-sections increased. The SAM-CHZ and SAM-MA were ranked overall in the 4th and 5th position, respectively. In comparison to the SE, LE, and VE methods, the SAM proved to be hydraulically more correct. However, the performance of the SAM is highly dependent on detailed cross-sections, while roughness coefficients for between-reaches are also required.
The SBA, SAM, and 1-D HEC-RAS steady flow modelling are therefore regarded as the most appropriate indirect estimation methods to reflect the hydraulic conditions during high discharges at a flow-gauging site. In general, any extension method must be hydraulically correct if it is to be used as a robust approach to extend SD RCs beyond the structural limit. The extension of an RC is significantly more affected by the site and river reach geometry, initial hydraulic conditions, flow regimes, and level of submergence at high discharges, than the actual extension method used.
Hence, there is no one-size-fits-all approach available for the extension of SD RCs in South Africa. For the interim, as recommended by Gericke and Smithers (2017), individual stage extensions (HE < 1.2 H subjected to QDE < 0.05 QDxi) should be considered for bankfull or above bankfull flow conditions in cases where site-specific data is unavailable. It is also recommended that the river geometry for a large sample of representative flow-gaugings in South Africa be investigated to establish which simplified profile, e.g. trapezoidal cross-section with 1:2 side slopes, could render acceptable discharges for bankfull and/or above bankfull flow conditions.
ACKNOWLEDGEMENTS
Support for this research by the Central University of Technology Free State (CUT) and the Water Research Commission (WRC) is gratefully acknowledged. We also wish to thank Mr Danie van der Spuy (former Specialist Engineer, Directorate National Hydrological Services: Flood Studies) for his expert and technical advice pertaining to the extension of stage-discharge relationships, as well as the anonymous reviewers for their constructive review comments which have helped to significantly improve the paper.
REFERENCES
BSI ISO (British Standards Institution & International Organisation for Standardisation) 1998. BSI ISO 1100-2. Measurement of Liquid Flow in Open Channels: Determination of the Stage-Discharge Relation. London: BSI. [ Links ]
Chow, V T 1959. Open-channel Hydraulics. New York: McGraw-Hill. [ Links ]
Dymond, J R & Christian, R 1982. Accuracy of discharge determined from a rating curve. Hydrological Sciences Journal, 27(4): 493-504. doi: 10.1080/02626668209491128. [ Links ]
EA UK (Environmental Agency United Kingdom) 2002. Stage 1: Extension of rating curves at gauging stations. Report No 1. Bristol: EA UK. [ Links ]
EA UK 2003. Stage 2: Extension of rating curves at gauging stations using simple hydraulic techniques. Report No 2. Bristol: EA UK. [ Links ]
George, J, Arcement, J R & Schneider, V R 1989. Guide for selecting Manning's roughness coefficients for natural and flood plains. Water Supply Paper 2339. US Geological Survey. Denver. CO: Department of the Interior. Available at: https://pubs.usgs.gov/wsp/2339/report.pdf. [ Links ]
Gericke, O J & Smithers, J C 2017. Direct estimation of catchment response time parameters in medium to large catchments using observed streamflow data. Hydrological Processes, 31(5):1125-1143. doi: 10.1002/hyp.11102. [ Links ]
Hardy, T, Panja, P & Mathias, P 2005. WinXSPRO: A channel cross-section analyser. Lakewood, CO: US Department of Agriculture, Forest Service. [ Links ]
Lang, M, Pobanz, K, Renard, B, Renouf, E & Sauquet, E 2010. Extension of rating curves by hydraulic modelling with application to flood frequency analysis. Hydrological Sciences Journal, 55(6): 883-898. https://doi.org/10.1080/02626667.2010.504186. [ Links ]
Lindner, G A & Miller, A J 2012. Numerical modelling of stage-discharge relationships in urban streams Journal of Hydrological Engineering, 17: 590-596. [ Links ]
Lumbroso, D & Gaume, E 2012. Reducing the uncertainty in indirect estimates of extreme flash flood discharges. Journal of Hydrology, 414-415: 16-30. https://doi.org/10.1016/j.jhydrol.2011.08.048. [ Links ]
Maeder, C 2015. The road to HEC-RAS. Middleton, WI: Civil GEO, US. Available at: https://www.civilgeo.com/blog/the-road-to-HEC-RAS. [ Links ]
Mathole, J 1999. Kalibrasieversoek (X3H008). Report No DT5. Pretoria: Department of Water Affairs and Forestry. [ Links ]
Menné, T C 1960. The role of hydrology in planning the development of a country. Hydrological Research Technical Report No 9. Pretoria: Department of Water Affairs. [ Links ]
Nathanael, J J 2016. Assessing the performance of regional flood frequency analysis methods in South Africa. MSc Dissertation. Pietermaritzburg: University of KwaZulu-Natal. [ Links ]
Nathanael, J J, Rademeyer, P F & Van der Spuy, D 2018. Discharge rating improvement of rating table and high flow data Sand River at Exeter. Report No X3H008DT-2018.12. Pretoria: Department of Water and Sanitation. [ Links ]
Petersen-0verleir, A & Reitan, T 2009. Accounting for rating curve imprecision in flood frequency analysis using likelihood-based methods. Journal of Hydrology, 366(1-4): 89-100. [ Links ]
Rademeyer, P 2023. Personal communication. Pretoria: Directorate: National Hydrological Services, Department of Water and Sanitation. [ Links ]
Ramsbottom, D M & Whitlow, C D 2003. Extension of rating curves at gauging stations: Best practice guidance manual. Bristol, UK: Environmental Agency. [ Links ]
Roux M, Rademeyer, P F & Van der Spuy, D 2015. Discharge rating improvement of rating table for Riet River at gauging weir C5H014. Report No C500-H014-2015.03. Pretoria: Department of Water and Sanitation. [ Links ]
Shao, Q, Dutta, D, Karim, F & Petheram, C 2018. A method for extending stage-discharge relationships using a hydrodynamic model and quantifying the associated uncertainty. Journal of Hydrology, 556(2018): 154-172. [ Links ]
Smithers, J C 2022. The initiation of a National Flood Studies Programme for South Africa: Overview and progress to date. Paper presented at the IAHS 2022 11th Scientific Assembly. Montpellier, France. doi: 10.5194/iahs2022-229. [ Links ]
USACE (United States Army Corps of Engineers) 2016. HEC-RAS river analysis system user's manual. Davis, CA: Hydrologic Engineering Centre. [ Links ]
Wessels, P & Rooseboom, A 2009. Flow-gauging structures in South African rivers. Part 1: An overview. Water SA, 35(1): 1-10. [ Links ]
Williams, V H 2023. Assessment of indirect estimation methods to extend observed stage-discharge relationships for above-structure-limit conditions at flow-gauging weirs. MEng Dissertation. Bloemfontein: Central University of Technology, Free State. [ Links ]
Zhong, X & Dutta, U 2015. Engaging Nash-Sutcliffe efficiency and Model Efficiency Factor Indicators in selecting and validating effective light rail system operation and maintenance cost models. Journal of Traffic & Transportation Engineering, 3(2015): 255-265. [ Links ]
 Correspondence:
O J Gericke
Department of Civil Engineering, Faculty of Engineering, Built Environment and Information Technology, Central University of Technology, Free State
Bloemfontein, South Africa
T: +27 51 507 3516; E: jgericke@cut.ac.za
V H Williams
Department of Civil Engineering, Faculty of Engineering, Built Environment and Information Technology, Central University of Technology, Free State
Bloemfontein, South Africa
T: +27 12 382 2458; E: williamsvh@tut.ac.za

PROF JACO GERICKE (Pr Eng, Int PE (SA)), is Head of the Department of Civil Engineering at the Central University of Technology, Free State (CUT). He obtained his PhD Eng (Agriculture) degree from the University of KwaZulu-Natal in 2016 and has more than 25 years' professional and academic experience, mainly in the fields of hydrology, water resources management, and river hydraulics. He has published several papers in the design hydrology field and is involved in research projects funded by the Water Research Commission.

VERNON WILLIAMS is a civil engineering technologist and lecturer currently employed by the Tshwane University of Technology (TUT). He graduated with BTech Eng (Civil) and MEng (Civil) degrees from the Central University of Technology, Free State (CUT), and has a particular interest in flood hydrology and river hydraulics. He currently has six years' academic experience.

