


Services on Demand
Article
 English (pdf)
 Article in xml format
 Article references
Indicators

Related links
-
 Cited by Google
 -
 Similars in Google
Share

 Permalink
Journal of the South African Institution of Civil Engineering
On-line version ISSN 2309-8775
Print version ISSN 1021-2019
J. S. Afr. Inst. Civ. Eng. vol.63 n.2 Midrand Jun. 2021
http://dx.doi.org/10.17159/2309-8775/2021/v63n2a1
TECHNICAL PAPER
Prediction of water reuse potential in South African water management areas: A linear regression and Bayesian network approach
S Mamane; A Abimbade; A Ilemobade
ABSTRACT
Increasing scarcity of freshwater resources and growing environmental awareness have given rise to the use of treated wastewater as an additional source of water supply. However, the amount of wastewater that can be reclaimed for reuse is subject to many factors, ranging from technical to socio-economic, environmental and institutional. This paper presents two prediction models for wastewater reuse potential in South Africa. The proposed models, namely a Bayesian Network model and a Linear Regression model, were used as a platform for integrated analysis of features such as water use, and socio-demographic and environmental factors. A dataset from the sub-regions of the 19 water management areas in South Africa was employed as input into the models in order to analyse these features and to consequently predict water reuse potential.
Keywords: water reuse, wastewater recycling, Bayesian network, linear regression
INTRODUCTION
Water reuse has attracted growing attention across the globe as a vital part of water resources management and forming an essential component of water conservation. Water scarcity challenges, linked with increasing water demand from an increasing population, climate change and depletion of groundwater resources among other factors, drive the need for exploring alternative water resources (Chen et al 2012). With increasing knowledge and understanding of the benefits of water reuse, some direct and indirect potable water reuse schemes have been successfully implemented in both developed and developing countries (Leverenz et al 2011; Ilemobade et al 2013).
Many studies on drought in South Africa have alluded to the occurrence of widespread and persistent drying conditions in several parts of the country (Botai et al 2016; Du Plessis & Schloms 2017; Botai et al 2018; Archer et al 2019). According to Swemmer et al (2018), northeastern Mpumalanga, the eastern half of the Free State and northern KwaZulu-Natal experienced more severe droughts than in the previous years, as indicated by recorded Standardised Precipitation Index values for South Africa over a two-year period, as of May 2016. These conditions were also noticed in the drought-prone areas of the North West Province, Northern Cape Province (South African Weather Service 2014) and Western Cape. The dams in the North West and Free State provinces recorded low storage and this was an indication of deficient rainfall that had led to dry conditions (Department of Water Affairs SA 2014). In 2015-2016, South Africa's agricultural activities were threatened by a severe drought which was caused by an El Nino weather system that swept across southern Africa (Baudoin et al 2017). In 2020, Botai et al (2020) reported that five of the most economically active provinces of South Africa were recovering from the severe drought, which had caused negative socio-economic impacts. The adverse climatic conditions resulted in the critical shortage of potable water and damages to crops, to the point that the North West Province was declared a state of disaster (Botai et al 2016). The Western Cape was the most adversely affected (Archer et al 2019). These drought-related impacts re-emphasise the need to increase efforts towards the development of alternative water supply sources. According to Ilemobade et al (2013), the implementation of water reuse schemes to mitigate water deficits has increased in many South African communities.
The quantity of usable return flow that can be harnessed for reuse is subject to several factors, ranging from environmental to technical, socio-economical and institutional (Yang et al 2007). Therefore, several researchers have used different decision support tools for estimating water reuse potential for specific contexts. These decision support tools include linear programming (Chu et al 2004; Yang & Abbaspour 2007; Goyal & Kumar 2020), mass balance (Hochstrat et al 2005), ratio analysis (Alfarra et al 2011), surveys (Adewumi et al 2010), fuzzy inference (Almeida et al 2013), aggregated index (Shafiquzzaman et al 2018) and analytic hierarchy process (Fukasawa & Mierzwa 2020). In this study, a Bayesian Network and a Linear Regression model were employed. In the field of natural resources management and environmental sciences, Bayesian Networks have proved to be an appropriate approach for ecosystem modelling (Rositano & Ferraro 2014; Garcia-Herrero et al 2013), climate change impact assessment (Richards et al 2013; Mantyka-Pringle et al 2014) and watershed management (Barton et al 2008; Keshtkar et al 2013; Shenton et al 2014). According to Mamitimin et al (2015), Bayesian Networks have the ability to clearly explain intricate relations between variables, easily compare scenarios, and determine the critical influencing system variables when applied to natural resources management. Another key benefit of this approach is its flexibility with regard to data sources. In situations where data is limited or not available, Bayesian Networks can implicitly integrate relevant data from different sources such as literature, empirical data, expert and stakeholders' knowledge (Uusitalo 2007; Gret-Regamey et al 2013). This study contributes to water reuse research by using water supply, and socio-demographic and environmental factors to estimate water reuse potential in the South African water management areas.
METHODOLOGY
The estimation of usable return flow can be an arduous task where accurate volumetric information is not readily available, as is the case in most developing countries. This problem is further amplified by the following two (of several) reasons highlighted by Grobicki and Cohen (1999) in their study on water reuse projects in South Africa:
1. In a situation where information does exist, the data is often found to be incomplete and tedious to collate. In some instances, information only exists in handwritten format and this makes it difficult to access and analyse.
2. There are often contradictions in numerical data obtained from different sources for the same area.
The study by Carden (2013) also corroborated the above data challenges in South Africa.
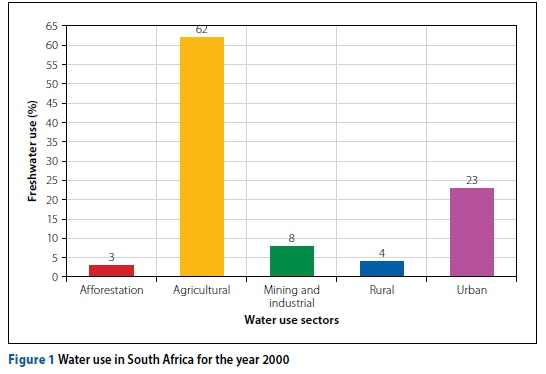
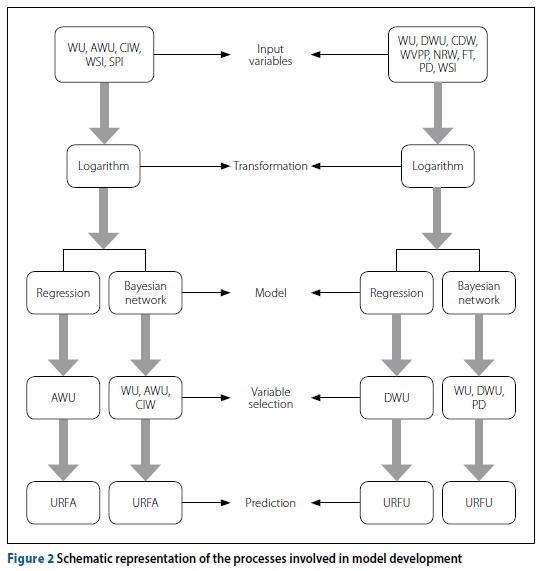
In this study, data gathered from sources such as the Department of Water Affairs, Statistics South Africa and the South African Weather Service was used. Water abstracted from a surface or groundwater source is said to be consumptively used when it is no longer available for beneficial use because it has evaporated, transpired, been incorporated into products and crops, consumed by man or livestock, or otherwise removed from freshwater resources. The non-consumptive water use yields wastewater that serves the purpose of contributing to ecological water reserve and usable return flow. The reuse of this usable yield may, however, be further constrained by a variety of pollution sources, thereby making it challenging to estimate the portion of this yield that is available for reuse. Figure 1 shows that 85% of overall freshwater use in South Africa is for the agricultural and urban sectors. Twenty years after publication, this proportion of freshwater use has not changed significantly. Therefore, the models proposed in this paper focus on predicting water reuse potential in the agricultural and urban sectors. Figure 2 outlines the processes involved in model development.
Data description
The variables used in this study are described below:
■ Water use (WU): Refers to the water abstracted from surface and groundwater for agricultural, domestic and other use that sustains life, industrial and other anthropogenic activities (million m3 per annum).
■ Agricultural water use (AWU): Refers to water used for irrigation and other agricultural activities in the agriculture sector (million m3 per annum).
■ Domestic water use (DWU): Refers to water used for domestic activities such as cooking, drinking, bathing, laundry and light industrial activities in the urban sector (million m3 per annum).
■ Cost of irrigation water (CIW): (cents of Rand/m3).
■ Cost of domestic water (CDW): (cents of Rand/m3).
■ Standard precipitation index (SPI): This is a tool used by the South Africa Weather Services for measuring the severity of drought based on rainfall data.
■ Water stress indicator (WSI): This is a function of water availability and water use (Smakhtin et al 2005). This indicator is defined by the ratio:
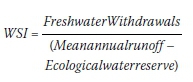
■ Population density (PD): This is the number of inhabitants per unit area (population/km2).
■ Water volume per person per day (WVPP): The average volume of water used per individual in a day.
■ Percentage of non-revenue water (NRW): This refers to all the water that is lost through physical leakage or commercial losses (meter under-registration, billing errors, theft, etc), as well as any unbilled authorised consumption (fire-fighting, mains flushing, etc).
■ Percentage of flush toilets (FT) connected to sewerage system.
■ Usable return flow from agricultural water (URFA): Volume of reusable water from agricultural activities (million m3 per annum).
■ Usable return flow from domestic (urban) water (URFU): Volume of reusable water from domestic activities (million m3 per annum)
The data that was gathered came from 82 areas. Some areas had both domestic (urban) and agricultural water use, while some only had one water use. The Water Management Areas with no water use recorded in the sector or no usable return flow from the sector were discarded from the analysis. Furthermore, for the domestic sector, the data was further restricted to areas with annual domestic water use less than 50 million m3. This restriction was implemented to arrive at data that was more homogeneous, and this helped to improve the predictions. As a result, the data that was analysed consisted of 62 observations for the agricultural sector and 44 observations for the domestic (urban) sector. For the prediction of usable return flow from the agricultural sector, the predictor variables that were considered were WU, AWU, CIW, WSI and SPI. For the prediction of usable return flow from the domestic sector, the predictor variables considered were WU, DWU, CDW, WVPP, NRW, FT, WSI, PD and SPI.
Description of the models
For each sector considered (agricultural and domestic), two models were explored, namely a Linear Regression model and a Bayesian Network model. Since the variables were right-skewed and presented some outliers, a log transformation of the variables was undertaken, which resulted in better prediction accuracy. The smearing estimate of bias was used to correct for the bias in the retransformed predictions (Newman 1993).
■ Linear Regression model: The usable return flow was expressed as a linear function of the other variables. The selection of the variables included in the model was performed using the Akaike Information Criterion (Konishi & Kitagawa 2008).
■ Bayesian Network model: A graphical model (Koller & Friedman 2009) for a collection of random variables is a family of probability distributions such that each satisfies a set of conditional independence relations encoded in a graph. This provides a parsimonious parameter and modular representation of the joint distribution of the random variables in the model, thereby allowing estimation of model parameters with a reasonable amount of data and a more effective computation of marginal posterior distributions. A Bayesian Network (Koller & Friedman 2009) is a graphical model wherein the conditional independence relations are encoded in a directed acyclic graph (a graph with orientated edges and such that there are no paths from a node and back).
For each sector, the graph that represents the dependence structure of the variables is learnt from the data. It corresponds to the structure that maximises the Bayesian Information Criterion (Konishi & Kitagawa 2008). For a more robust estimation of the structure, the average of graphs learnt from 1 000 bootstrap samples was used. The optimisation was carried out using the hill-climbing algorithm (Nagarajan et al 2013). Thereafter, maximum likelihood estimates of the parameters of the Gaussian Bayesian Network were calculated.
SOFTWARE
In this study, the R statistical software (RDevelopment Core Team 2017) was used for the data analysis. The bnlearn package (Scutari 2009) was used for the Bayesian Network modelling.
RESULTS
Usable return from the agricultural sector
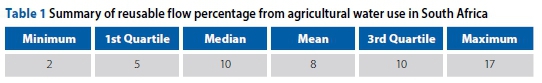
Table 1 summarises the distribution of the percentage of agricultural water use that is potentially reusable. In particular it indicates that, on average, 8% of agricultural water use is potentially reusable.
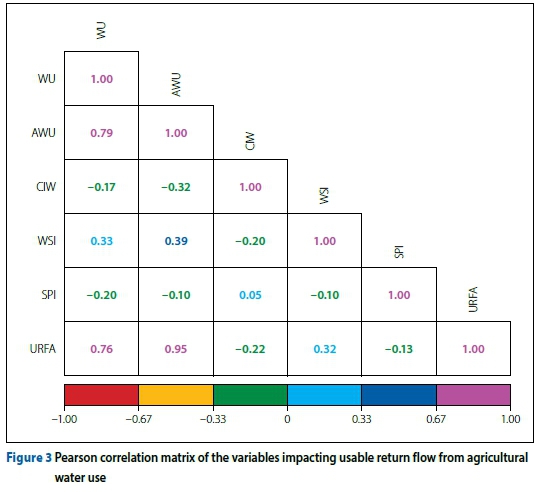
As shown in Figure 3, URFA is highly correlated with AWU (0.95) and WU (0.76). The latter variables are also highly correlated (0.79). Albeit very weak, the correlations of CIW and SPI with WU and AWU, and hence with URFA, are negative, as expected. The obtained strong linear correlation between URFA and AWU already signifies that more than 90% of the variability of URFA can be explained by the variability of AWU.
Linear Regression model for usable return flow from agricultural water use
In the sequel, Ν(μ, σ) denotes the normal distribution with mean μ and standard deviation σ and by abuse of notation, a random observation from the said probability distribution.
For the usable return flow from agricultural water use, the fitted Linear Regression model is:
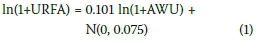
Equation 1 implies that when AWU doubles, URFA increases on average by around 7%.
Performance of the Linear Regression model on cross-validation data:
Table 2 summarises the absolute percentage prediction errors using the Linear Regression model (Equation 1). It shows in particular that about half of the predictions were less than 24% higher or lower than the actual observation.
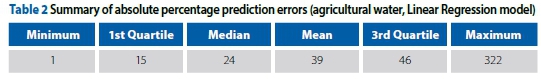
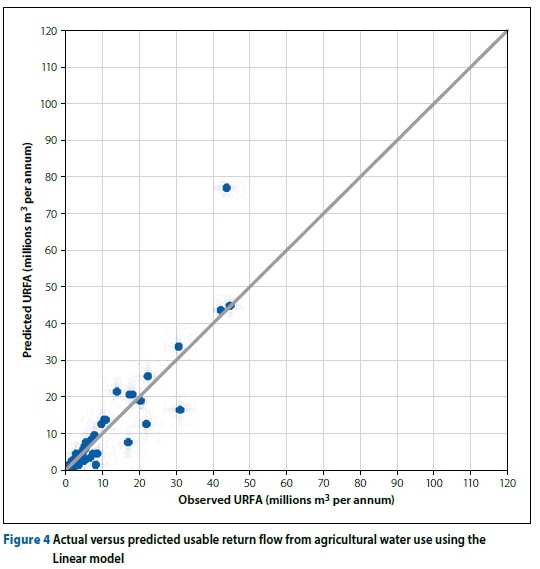
Figure 4 shows the actual and predicted usable return flow from agricultural water use.
Bayesian Network model for usable return flow from agricultural water use
Figure 5 shows the structure of the Bayesian Network learnt from the data.
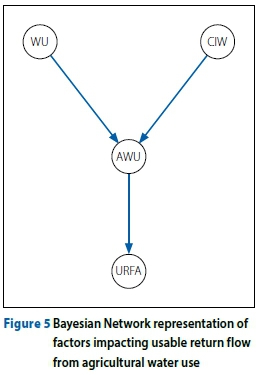
Only the variables WU, CIW and AWU were found to be factors significantly impacting URFA.
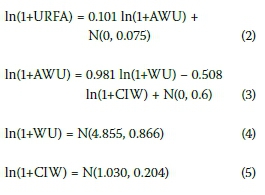
For URFA, the fitted Gaussian Bayesian Network model is the following:
Performance of the Bayesian Network model on cross-validation data:
Table 3 summarises the absolute percentage prediction errors achieved by the Bayesian Network model. In particular it indicates that about half of the predictions are within 25% of the actual observations.
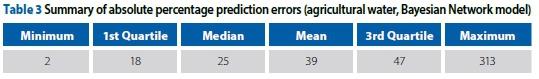
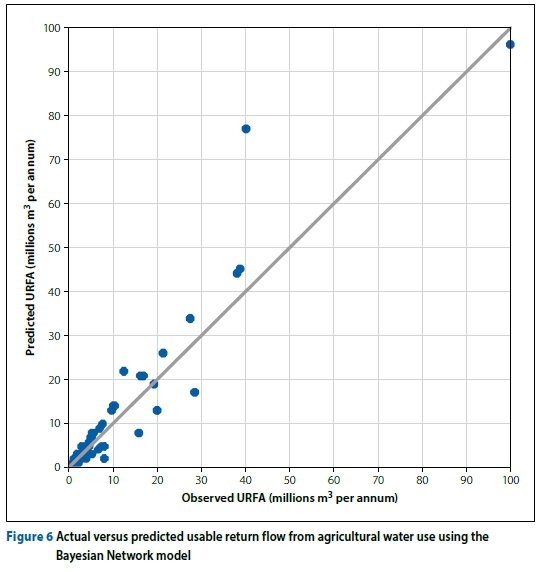
Figure 6 shows the actual versus predicted usable return flow from agricultural water use using the Bayesian Network model.
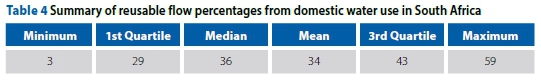
Usable return flow from domestic activities
Table 4 summarises the distribution of the percentage of domestic water used that is potentially reusable. It shows that, on average, 34% of domestic water used is potentially reusable.
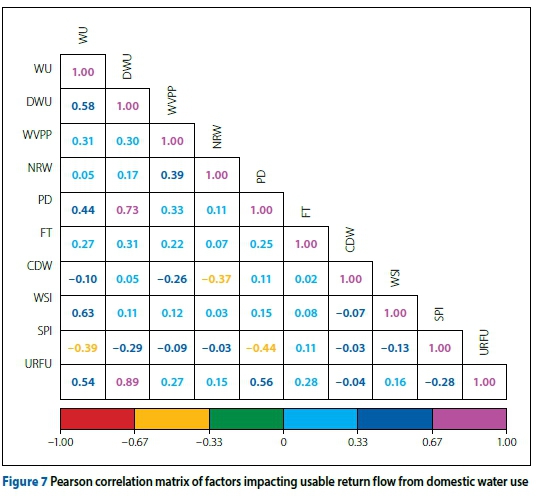
As shown in Figure 7, URFU is highly correlated with DWU (0.89) and moderately correlated with WU (0.54) and PD (0.56). CDW is poorly, but expect-edly negatively, correlated with WU and WVPP. The obtained strong linear correlation between URFU and DWU already indicates that about 79% of the variability of URFU can be explained by the variability of DWU.
Linear Regression model for usable return flow from domestic water use
For the usable return flow from domestic water use, the fitted Linear Regression model is:
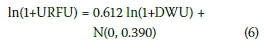
Equation 6 implies that when DWU doubles, URFU increases on average by around 50%.
Performance of the Linear Regression model on cross-validation data:
Table 5 summarises the absolute percentage prediction errors achieved by the Linear Regression model (Equation 6). In particular it shows that about half of the predictions are within 23% of the actual observation.
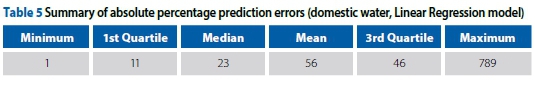
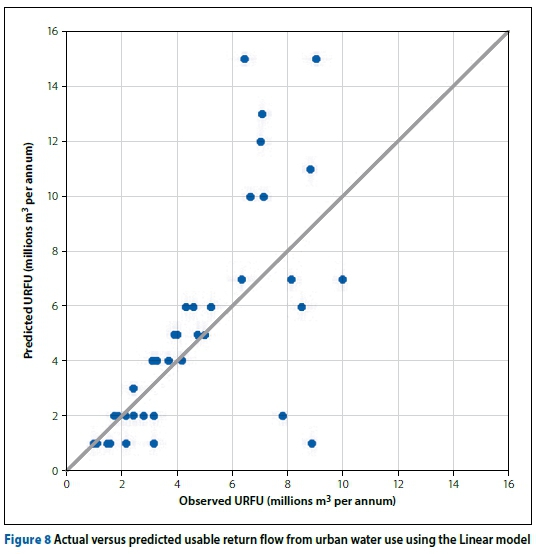
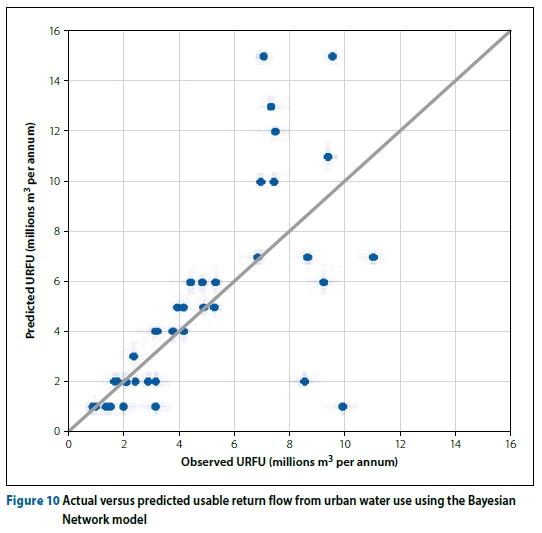
Figure 8 shows the predicted and actual usable return flow from urban water use. It can be observed that the model tends to underestimate higher usable return flow from urban water use.
Bayesian network model for usable return flow from domestic water use
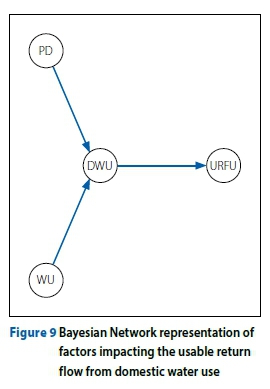
Figure 9 shows the structure of the Bayesian Network learnt from the data. The variables WU, DWU and PD are found to be significant factors impacting the usable return flow from urban water.
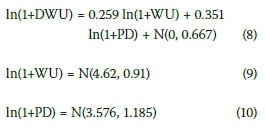
The fitted Bayesian Network model for the prediction of the usable return flow from domestic water use is:
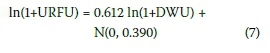
Performance of the Bayesian Network on cross-validation data:
Table 6 summarises the percentage prediction errors achieved by the Bayesian Network model. In particular it indicates that about half of the predictions are more than 23% higher or lower than the actual observation.

Figure 10 shows the actual and predicted usable return flow from domestic water use using the Bayesian Network model.
DISCUSSION AND CONCLUSION
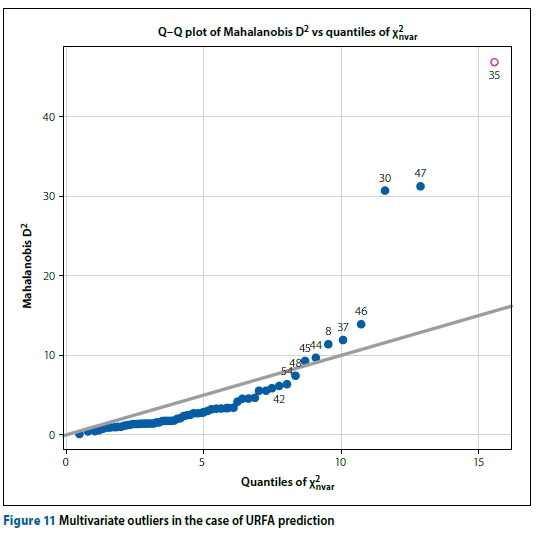
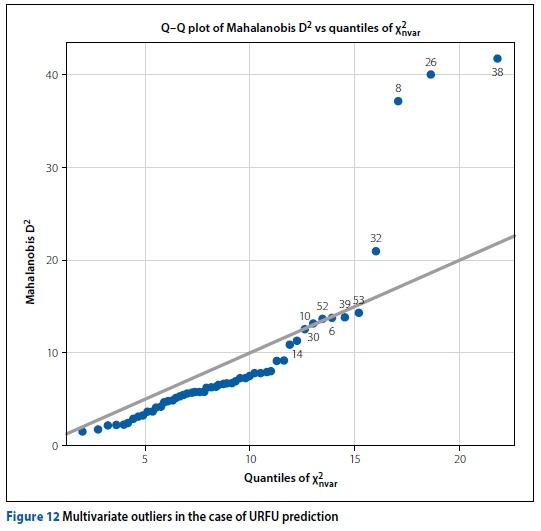
The development of decision support models that utilise demographic, water and environment-related factors to predict usable return flow can be of help to decision-makers and can make discussions about water reuse more efficient in communities faced with water scarcity. Information on usable return flow is imperative to the development and implementation of water reuse initiatives, as well as provide warning signals that can predict water supply shortages. In the agricultural sector, the variables that were found to be most useful for the prediction of usable return flow were the total water use, the agricultural water use and the cost of irrigation water. In the urban (domestic) sector, the variables that were found to be the most useful for the prediction of usable return flow were the total water use, the domestic water use and the population density. For the agricultural sector, the Linear and the Bayesian Network models yielded a median percentage absolute error of 24% and 25% respectively. For the domestic sector, the median percentage absolute error determined for both sectors was 23%. The predictions were generally more accurate for the domestic sector. The performance of the prediction models was certainly negatively affected by the presence of multivari-ate outliers, as indicated by a comparison of squared Mahalanobis distances with corresponding expected chi-square values (Figures 11 and 12). In summary, the study shows that 8% of the agricultural water use is potentially reusable, while 34% of total domestic water use is potentially reusable. The study also shows that, given the sectorial water use in a region, the usable return flow from the sector can be predicted with a reasonable degree of accuracy. Since the recorded usable return flows are constrained by the availability of infrastructure, regions with very low observed return flows, compared to the predicted ones, will tend to be regions less endowed with the necessary infrastructure. The result of this study also encourages the discussion of challenges facing reliable water supply, taking into consideration the effect of climate change.
REFERENCES
Adewumi, J, Ilemobade, A & Van Zyl, J 2010. Decision support for the planning of integrated wastewater reuse projects in South Africa. Water Science and Technology: Water Supply, 10(2): 251-267. [ Links ]
Alfarra, A, Kemp-Benedict, E, Hotzl, H, Sader, Ν & Sonneveld, B 2011. A framework for wastewater reuse in Jordan: Utilizing a modified wastewater reuse index. Water Resources Management, 25(4): 1153-1167. [ Links ]
Almeida, G, Vieira, J, Marques, A S, Kiperstok, A & Cardoso, A 2013. Estimating the potential water reuse based on fuzzy reasoning. Journal of Environmental Management, 128: 883-892. [ Links ]
Archer, E, Landman, W, Malherbe, J, Tadross, M & Pretorius, S 2019. South Africa's winter rainfall region drought: A region in transition. Climate Risk Management, 25: 100188. [ Links ]
Barton, D, Saloranta, T, Moe, S, Eggestad, H & Kuikka, S 2008. Bayesian belief networks as a meta-modelling tool in integrated river basin management pros and cons in evaluating nutrient abatement decisions under uncertainty in a Norwegian river basin. Ecological Economics, 66(1): 91-104. [ Links ]
Baudoin, M, Vogel, C, Nortjea, K & Naika, M 2017. Living with drought in South Africa: Lessons learnt from the recent El Nino drought period. International Journal of Disaster Risk Reduction, 23: 128-137. [ Links ]
Botai, C M, Botai, J O & Adeola, AM 2018. Spatial distribution of temporal precipitation contrasts in South Africa. South African Journal of Science, 114 (7/8). doi:10.17159/sajs.2018/20170391. [ Links ]
Botai, C M, Botai, J O, Adeola, A M, De Wit, J P, Ncongwane, K P & Zwane, N N 2020. Drought risk analysis in the Eastern Cape Province of South Africa. The Copula Lens Water, 12: 1938. doi: 10.3390/w12071938. [ Links ]
Botai, C M, Botai, J O, Dlamini, L, Zwane, N & Phaduli, E 2016. Characteristics of droughts in South Africa: A case study of Free State and North West provinces. Water, 8: 439. [ Links ]
Carden, K 2013. A measure of sustainability in the context of urban water management in South Africa. PhD thesis, University of Cape Town. [ Links ]
Chen, Z, Ngo, H H & Guo, W 2012. A critical review on sustainability assessment of recycled water schemes. Science of the Total Environment, 426: 13-31. [ Links ]
Chu, J, Chen, J, Wang, C & Fu, P 2004. Wastewater reuse potential analysis: Implications for China's water resources management. Water Research, 38(11): 2746-2756. [ Links ]
Department of Water Affairs (South Africa) 2014. Annual National State of Water Resources Report for the Hydrological Year 2012/2013. https://www.gov.za.documents (accessed on 14 July 2015). [ Links ]
Du Plessis, J A & Schloms, B 2017. An investigation into the evidence of seasonal rainfall pattern shifts in the Western Cape, South Africa. Journal of the South African Institution of Civil Engineering, 59(4): 47-55. [ Links ]
Fukasawa, B N & Mierzwa, J C 2020. Identification of water reuse potential in metropolitan regions using the analytic hierarchy process. Environmental and Sustainability Indicators, 8: 100064. [ Links ]
Garcia-Herrero, S, Mariscal, M, Gutierrez, J & Toca-Otero, A 2013. Bayesian network analysis of safety culture and organizational culture in a nuclear power plant. Safety Science, 53:82-95. [ Links ]
Goyal, K & Kumar, A 2020. A modelling approach to assess wastewater reuse potential for Delhi city. Water Supply, 20(5): 1716-1725. [ Links ]
Gret-Regamey, A, Brunner, S H, Altwegg, J & Bebi, P 2013. Facing uncertainty in ecosystem services-based resource management. Journal of Environmental Management, 127: S145-S154. [ Links ]
Grobicki, A & Cohen, B 1999. Water reclamation for direct re-use in urban and industrial applications in South Africa and its projected impact upon water demand. Pretoria: Water Research Commission. [ Links ]
Hochstrat, R, Wintgens, T, Melin T & Jeffrey, P 2005. Wastewater reclamation and reuse in Europe: A model-based potential estimation. Water Science and Technology: Water Supply, 5(1): 67-75. [ Links ]
Ilemobade, A, Olanrewaju, O & Griffioen, M 2013. Greywater reuse for toilet flushing at a university academic and residential building. Water SA, 39(3): 351-360. [ Links ]
Keshtkar, A, Salajegheh, A, Sadoddin, A & Allan, M G 2013. Application of Bayesian networks for sustainability assessment in catchment modeling and management (Case study: The Hablehrood River catchment). Ecological Modelling, 268: 48-54. [ Links ]
Koller, D & Friedman, N 2009. Probabilistic Graphical Models: Principles and Techniques. Cambridge, MA: MIT Press. [ Links ]
Konishi, S & Kitagawa, G 2008. Bayesian Information Criteria and Statistical Modeling. New York: Springer. [ Links ]
Leverenz, H L, Tchobanoglous, G & Asano, T 2011. Direct potable reuse: A future imperative. Journal of Water Reuse and Desalination, 1(1): 2-10. [ Links ]
Mamitimin, Y, Feike, T & Doluschitz, R 2015. Bayesian network modeling to improve water pricing practices in northwest China. Water, 7(10): 5617-5637. [ Links ]
Mantyka-Pringle, C S, Martin, T G, Moffatt, D B, Linke, S & Rhodes, J R 2014. Understanding and predicting the combined effects of climate change and land-use change on freshwater macroinvertebrates and fish. Journal of Applied Ecology, 51(3): 572-581. [ Links ]
Nagarajan, R, Scutari, M & Lebre, S 2013. Bayesian Networks in R with Applications in Systems Biology. New York: Springer Science+Business Media. [ Links ]
Newman, M C 1993. Regression analysis of log-transformed data: Statistical bias and its correction. Environmental Toxicology and Chemistry, 12(6): 1129-1133. [ Links ]
R Development Core Team 2017. A language and environment for statistical computing. Vienna, Austria. https://www.r-project.org. [ Links ]
Richards, R, Sano, M, Roiko, A, Carter, R, Bussey, M, Matthews, J & Smith, T F 2013. Bayesian belief modeling of climate change impacts for informing regional adaptation options. Environmental Modelling & Software, 44: 113-121. [ Links ]
Rositano, F & Ferraro, D O 2014. Ecosystem services provided by agroecosystems: A qualitative and quantitative assessment of this relationship in the La Pampa region, Argentina. Environmental Management, 53(3): 606-619. [ Links ]
Scutari, M 2009. Learning Bayesian networks with the bnlearn R package. arXiv preprint arXiv:09083817. https://arxiv.org. [ Links ]
Shafiquzzaman, M, Haider, H, AlSaleem, S S, Ghumman, A R & Sadiq, R 2018. Development of Consumer Perception Index for assessing greywater reuse potential in arid environments. Water SA, 44(4): 771-781. [ Links ]
Shenton, W, Hart, B T & Chan, TU 2014. A Bayesian network approach to support environmental flow restoration decisions in the Yarra River, Australia. Stochastic Environmental Research and Risk Assessment, 28(1): 57-65. [ Links ]
Smakhtin, V, Revenga, C & Döll, P 2005. Taking into account environmental water requirements in global-scale water resources assessments. International Water Management Institute. https://core.ac.uk/download/pdf/6405183.pdf. [ Links ]
South African Weather Service 2014. Annual Report 2013/2014. https://www.saws.co.za (accessed on 10 August 2015). [ Links ]
Swemmer, A M, Bond, W J, Donaldson, J, Hempson, G P, Malherbe, J & Smit, I P J 2018. The ecology of drought - A workshop report. South African Journal of Science, 2018: 114(9/10). https://doi.org/10.17159/sajs.2018/5098. [ Links ]
Uusitalo, L 2007. Advantages and challenges of Bayesian networks in environmental modelling. Ecological Modelling, 203(3-4): 312-318. [ Links ]
Yang, H & Abbaspour, K C 2007. Analysis of wastewater reuse potential in Beijing. Desalination, 212(1-3): 238-250. [ Links ]
Yang, J, Reichert, P & Abbaspour, K C 2007. Bayesian uncertainty analysis in distributed hydrologic modeling: A case study in the Thur River basin (Switzerland). Water Resources Research, 43(10). [ Links ]
 Correspondence:
S Mamane
School of Statistics and Actuarial Science, University of the Witwatersrand
Private Bag 3, Wits 2050, South Africa
T: +27 11 717 6090, E: salha.mamane@wits.ac.za
A Abimbade
Lidwala Consulting Engineers
2 Payne Road, Corner Main Office Park, Bryanston 2021, South Africa
T: +27 11 793 5486, E: aabimbade@lidwala.com / abiolaabim@gmail.com
A Ilemobade
School of Civil and Environmental Engineering University of the Witwatersrand
Private Bag 3, Wits 2050, South Africa
T: +27 11 717 7153, E: adesola.ilemobade@wits.ac.za

DR SALHA MAMANE is a Senior Lecturer in the School of Statistics and Actuarial Science at the University of the Witwatersrand in Johannesburg. His research interests cover both theoretical and applied statistics. The general theme of his research activity is modelling the interrelations of variables in a complex or dynamical system.

DR ABIOLA ABIMBADE (AMSAICE, MWISA, MNSE) is a Civil Engineer at Lidwala Consulting Engineers where he consults on turnkey solutions and projects, design of bulk water and sanitation infrastructure, and township development and establishment in southern Africa. His research interests include water reuse sustainability, decision support tools, water services management, and legislative and institutional arrangement in the water sector. He is actively involved in research and consulting activities.

PROF ADESHOLA ILEMOBADE (Pr Eng, MAP, MSAICE, MWISA) is an Associate Professor at the School of Civil and Environmental Engineering, University of the Witwatersrand, Johannesburg, where he teaches infrastructure planning and water engineering subjects at undergraduate and postgraduate levels. His research interests are in the areas of water reuse, water demand, water conservation and water supply. He has published extensively, received awards for research conducted and supervised, and led several multi-disciplinary research and consulting teams.

