


Serviços Personalizados
Artigo
 Inglês (pdf)
 Artigo em XML
 Referências do artigo
Indicadores

Links relacionados
-
 Citado por Google
 -
 Similares em Google
Compartilhar

 Permalink
Journal of the South African Institution of Civil Engineering
versão On-line ISSN 2309-8775
versão impressa ISSN 1021-2019
J. S. Afr. Inst. Civ. Eng. vol.59 no.2 Midrand Jun. 2017
http://dx.doi.org/10.17159/2309-8775/2017/v59n2a7
TECHNICAL NOTE
Effect of the minimum void ratio on the vertical intercept of the steady state line of non-plastic soils
L A Torres-Cruz; S Geyer; P R Mackechnie
ABSTRACT
The steady state line (SSL) plays a key role in understanding and modelling the mechanical response of soils. Accordingly, understanding how the SSL correlates to soil index properties is of primary importance. A previous study reported that the vertical location of the SSL (Γ1) in void ratio (e) versus mean effective stress (ρ') space is correlated to the minimum void ratio (emin). However, the correlation only included soils with narrow particle size distributions (PSD) and low fines content (FC). In the current study, published data corresponding to 30 non-plastic soils were re-processed to further explore the applicability of the r1-emincorrelation. The results indicate that the r1-emincorrelation is linear (R2 = 0.85) and valid regardless of the coefficient of uniformity (Cu), FC, and particle shape. The r1-emindataset presented herein was also compared to a previously published dataset, and good agreement was observed. It is proposed that the r1-emjncorrelation can be very useful to understand how the Γ1 of different non-plastic soils compare to one another, and to minimise the extent of triaxial testing required when characterising a soil deposit from an SSL standpoint. Limitations of the r1-emin correlation are also discussed.
Keywords: steady state line, critical state line, minimum void ratio, non‑plastic soils
INTRODUCTION
Soils reach constant values of void ratio (e), mean effective stress 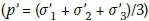 and deviator stress
  when sheared to large strains (Castro 1969). The locus of steady state (e, p', q) coordinates attained when shearing from different initial states, defines the steady state line (SSL). Because the SSL represents the stress and void ratio conditions towards which a soil evolves when sheared, it plays a key role in defining mechanical response. Two projections are typically used to define the SSL: q-p' (stress plane) and e-p' (compression plane). The q-p' projection, which reflects steady state frictional properties, is strongly dependent on particle shape (Cho et al 2006) and largely independent of particle size distribution (PSD) (Carrera et al 2011; Rahman et al 2014). By contrast, the e-p' projection, representative of stiffness, is affected by particle shape (Cho et al 2006), PSD (Thevanayagam et al 2002; Rahman & Lo 2008; Muir-Wood & Maeda 2008; Li et al 2013), and void ratio limits (Cho et al 2006; Cubrinovski & Ishihara 2000; Hemer et al 2016). Given the greater number of factors that affect the e-p' projection, it has received attention from a significant number of researchers and is the focus of this note. The e-p' projection is commonly modelled with Equation 1:

Where λ ω is the slope of the SSL in semi-logarithmic space and Γ is the void ratio at p' = 1 kPa (Figure 1). The current note will explore the correlation between the minimum void ratio (emir), which is associated with a defined maximum density state, and Γ ν
Several studies have investigated how the SSL is affected by soil index properties. Thevanayagam et al (2002) tested gap-graded mixtures composed of sand and non-plastic fines and concluded that the vertical location of the SSLs could be explained by the fines content (FC). They noted that as FC increases from zero, the SSL shifts downwards in e-p' space (Γγ decreases), and that beyond a certain FC value it shifts upwards (Γγ increases). The FC value at which the SSL shift reverses direction was termed by Thevanayagam et al (2002) as the threshold FC (TFC). The calculation of the parameters proposed by Thevanayagam et al (2002) to explain the effect of FC required knowledge of the SSLs of the different sand-fines mixtures. Consequently, the framework lacked predictive power. To overcome this, Rahman & Lo (2008) developed semi-empirical equations to calculate, as a function of FC and other PSD descriptors, the parameters in the framework proposed by Thevanayagam et al (2002). This allowed the prediction of the SSL of sands with FC < TFC, provided that the SSL of another sand-fines mixture with FC < TFC was known. More recent works show that the effect of non-plastic fines on the SSL continues to be investigated (e.g. Mohammadi & Qadimi 2015; Rahman et al 2014; Yang et al 2015).
Despite the success of Rahman & Lo (2008) in predicting several SSLs, their framework has limitations that hinder its wider applicability. For example, the framework is limited to soils with FC smaller than the TFC, which tends to be close to 40%. Additionally, the framework cannot explain the differences between the SSLs of soils with no fines but different PSDs or grain shape.
Cho et al (2006) explored the correlation between Γ1 and eminof 49 natural and crushec sands with mostly little to no fines (only six sands had FC > 12%) and a maximum coefficient of uniformity (CJ of 6.2 (only three sands had Cu> 4). They found that the correlation was linear, independent of particle shape, and of modest strength (R2= 0.54). However, the validity of the correlation for high FC values or widely graded soils remains untested. The objective of this note is to present evidence that expands the applicability of the
  correlation to a wide range of non-plastic soils, regardless of PSD descriptors such as FC and CM. The wide applicability of this correlation is considered a step towards overcoming the limitations encountered when using FC and TFC to explain the location of the SSL.
METHODOLOGY
Datasets from three references were processed to explore the validity of the  correlation: Thevanayagam et al (2002), Yang et al (2006) and Li (2013). The dataset from Thevanayagam et al (2002) includes seven soils composed of foundry sand mixed with non-plastic crushed silica fines. The resulting mixtures have FCs varying from 0% to 100% and Cuvarying from 1.7 to 47. The dataset from Yang et al (2006) includes nine soils composed of Hokksund sand mixed with non-plastic Chengbei silt. The resulting mixtures have FCs varying from 0% to 94% and Cuvarying from 2 to 14. The Thevanayagam et al (2002) and Yang et al (2006) datasets were used herein to assess the validity of the Γι-emm correlation over a wide range of FC and Cuvalues. The dataset from Li (2013) includes 14 soils of which six were made of glass balls (spherical particles) and eight of Hostun sand (angular particles). Two soils, one each of glass balls and Hostun sand, had FC =10%, whereas the remaining 12 had FC = 0%. Cuvaried from 1.1 to 20. This data-set was used herein because: (i) some of the soils made up of glass balls had considerably low eminvalues which allowed a significant extension of the lower bound of the domain of the F]_-emincorrelation; (ii) given that the particle shape of the glass balls is distinctly different from that of Hostun sand, this dataset enables a straightforward assessment of whether particle shape affects the rl-emiin correlation; and (iii) this dataset also allows assessment of the validity of the rl-emiin correlation at different Cuvalues. Figure 2 presents the PSDs of the 30 soils considered.
Values of Γ ι were calculated by fitting Equation 1 to the (p', e) points that defined the SSL of each soil (Table 1). Some of the SSLs reported by Thevanayagam et al (2002) cannot be modelled with Equation 1, due to the curvature of the SSL in e-logKp' which some soils exhibit at high stress levels (e.g. Been et al 1991; Li & Wang 1998). Consequently, some (p', e) points with high p' values were excluded from the fitting process. Similarly, given the experimental difficulties and uncertainties involved in performing triaxial tests at very low values of effective stress, two (p', e) points with p' = 1 kPa were also disregarded when calculating Γ1(see footnote c in Table 1).
As annotated in Figures 3 to 5, different methods were used to determine the emin values of each dataset. ASTM D1557 refers to the modified Proctor compaction test, and ASTM D4253 refers to the method of soil densification using a vibratory table. Although the current authors acknowledge that eminvalues from different methods are not strictly comparable, it is hypothesised that, regardless of the method, the resulting eminprovides a reasonable indicator of packing efficiency.
RESULTS AND DISCUSSION
Figures 3 to 5 suggest strong (R2> 0.90) linear r]-emincorrelations. The data point labels further suggest that the correlations are valid regardless of FC or Cu. The independence of the correlation from FC observed in Figures 3 and 4 is at odds with previous works (e.g. Thevanayagam et al 2002; Rahman & Lo 2008; Rahman et al 2014) which have suggested that Γ1is fundamentally correlated to FC. Furthermore, Figure 3 explicitly shows that essentially the same Г1-emincorrelation is followed regardless of whether FC is smaller or greater than TFC. Additionally, the angular Hostun sand and the glass balls follow the same Γ1~emin correlation despite their significantly different particle shapes (Figure 5). This result agrees with Cho et al (2006) who reported the independence from particle shape of the Γ1-emincorrelation for narrowly graded sands with low values of FC.
When all 30 soils are collectively plotted (Figure 6), a single linear correlation emerges (R2= 0.85). The slight decrease in R2(compare to Figures 3 to 5) is likely a consequence of combining SSLs calculated from triaxial tests conducted in different laboratories and following slightly different protocols, and eminvalues obtained through different procedures. For example, Prochaska & Drnevich (2005) showed that the maximum dry unit weight, which is associated to emin, can show variances of the order of ± 3% when estimated from different compaction techniques. A unique linear correlation (R2= 0.77) continues to be apparent when the data corresponding to Cho et al (2006) is included (Figure 7). This indicates that the Γ1-emiincorrelation observed by Cho et al (2006) in narrowly graded sands with low FC values is approximately the same for soils with significant amounts of non-plastic fines and large Cuvalues, such as those represented in Figures 3 to 5. The data analysed in this study has also been useful to expand the lower bound of the domain of the Γ1-emiin correlation reported by Cho et al (2006) (Figure 7).
The authors suggest that the validity of the Γ1~emincorrelation over such a wide range of non-plastic soil types is explained by the similarity in which both Γ1and eminare affected by a soil's fundamental properties. For example, they are both directly correlated to particle angularity (Li 2013; Biarez & Hicher 1994; Cho et al 2006), inversely correlated to Cu(Li 2013; Biarez & Hicher 1994; Poulos et al 1985), and respond in a similarmanner to changes in FC (Lade et al 1998; Rahman & Lo 2008). It is also important to acknowledge that the use of eminas a predictor of Γ ι may be limited by the differences between the remoulding and particle crushing mechanisms that a soil undergoes when sheared to steady state and when compacted to emin.
The authors are not recommending the use of the correlations in Figures 3 to 7 to replace triaxial testing to determine the SSL, as doing so can result in significant errors. For example, in Figure 7 a deviation from the best fit line of ± 0.1 is observed in Γι, implying a potential error of 0.2. This value is significantly higher than the error of ± 0.01 in void ratio, which was suggested by Jefferies & Been (2006) as a reasonable target error when calculating the SSL experimentally. Notwithstanding these potential errors, the correlation is very useful to qualitatively understand how the Γι values of different non-plastic soil types will compare to one another. Additionally, when studying a heterogeneous soil deposit that includes a variety of soil types, the correlation can help reduce the number of soil types whose SSLs have to be experimentally determined to fully characterise the deposit from an SSL standpoint (e.g. Hemer et al 2016).
CONCLUSIONS
The Гrl-emiincorrelation of 30 non-plastic soils has been investigated. The results indi-cate that the correlation is linear (R2= 0.85) and valid regardless of FC, Cu, and particle shape. Comparison of the results presented herein (Figure 6) with the Γ1 versus emin dataset obtained by Cho et al (2006), indicates that the Г1-emincorrelation originally observed by Cho et al (2006) for narrowly graded sands with small amounts of fines may be applicable to all non-plastic soils (Figure 7). The similarity in the way in which both Γ1and eminrespond to changes in the fundamental properties of a soil is believed to be the reason why the Г1--emincorrelation is valid over a wide variety of soil types.
Given that the effect of non-plastic fines on the SSL continues to be intensely researched, it is an important finding of this work that the Гl-emiincorrelation is not affected by FC (Figures 3 and 4). This is not entirely surprising though, as it seems unlikely that a fundamental soil property (Γ1) can be explained by a property such as FC which is arbitrarily defined as the percentage of particles smaller than 75 μηι (or 63 μηι, depending on the standard). Accordingly, it must be expected that the predictive power of FC and associated concepts like the TFC will have important limitations. The results presented herein suggest that a better understanding of the SSL can be achieved by correlating Γ1to eminrather than to FC. The authors are currently analysing an extended database and conducting triaxial experiments to continue exploring the strengths and limitations of the Гl-emiincorrelation.
NOTATION
e = void ratio
p' = mean effective stress (σ'1 + σ'2 + (/3)/3
q = deviator stress (σ'1 - σ'3)
SSL = steady state line
Γ1 = steady state void ratio that corre sponds to a mean effective stress of 1 kPa
λω = slope of the SSL in e-log10p') space
FC = fines content (< 75 μm)
PSD = particle size distribution
emin= minimum void ratio
TFC = threshold fines content
Cu= coefficient of uniformity (D60/D10)
ACKNOWLEDGEMENTS
The authors gratefully acknowledge Dr Nico Vermeulen (Jones & Wagener) and Dr Irvin Luker (University of the Witwatersrand) for their valuable insights and discussions.
REFERENCES
Been, K, Jefferies, M G & Hachey, J E 1991. The critical state of sands. Geotechnique, 41(3): 365-381. [ Links ]
Biarez, J & Hicher, P-Y 1994. Elementary Mechanics of Soil Behaviour: Saturated Remoulded Soils. Rotterdam: Balkema. [ Links ]
Carrera, A, Coop, M & Lancellota, R 2011. Influence of grading on the mechanical behaviour of Stava tailings. Geotechnique, 61(11): 935-946. [ Links ]
Castro, G 1969. Liquefaction of sands. PhD thesis, Cambridge, MA: Harvard University. [ Links ]
Cho, G, Dodds, J & Santamarina, J 2006. Particle shape effects on packing density, stiffness, and strength: Natural and crushed sands. Geotechnical and Geoenvironmental Engineering, 132(5): 591-602. [ Links ]
Cubrinovski, M & Ishihara, K 2000. Flow potential of sandy soils with different grain compositions. Soils and Foundations, 40(4): 103-119. [ Links ]
Hemer, J C, Mincione, N L M & Torres-Cruz, L A 2016. Determination of steady state lines for non-plastic platinum tailings. In: Jacobsz, S W. (Ed.), Proceedings, 1st Southern African Geotechnical Conference Held at Sun City, 4-6 May 2016. London: CRC Press/Taylor & Francis, 275-280. [ Links ]
Jefferies, M G & Been, K 2006. Soil liquefaction: A critical state approach. London: Taylor & Francis. [ Links ]
Lade, P V, Liggio, C & Yamamuro, J A 1998. Effects of non-plastic fines on minimum and maximum void ratios of sand. Geotechnical Testing Journal, 21(4): 336-347. [ Links ]
Li, G 2013. Étude de l'influence de l'étalement granulometrique sur le comportement mecanique des materiaux granulaires. PhD thesis, Nantes, France: Ecole Central de Nantes [In French]. [ Links ]
Li, G, Ovalle, C, Dano, C & Hicher, P-Y 2013. Influence of grain size distribution on critical state of granular materials. In: Yang, Q, Zhang, J-M, Zheng, H & Yao, Y (Eds.), Constitutive Modeling of Geomaterials, Berlin, Heidelberg: Springer Verlag. [ Links ]
Li, X S & Wang, Y 1998. Linear representation of steady state-line for sand. Geotechnical and Geoenvironmental Engineering, 124(12): 1215-1217. [ Links ]
Mohammadi, A & Qadimi, A 2015. A simple critical state approach to predicting the cyclic and monotonic response of sands with different fines contents using the equivalent intergranular void ratio. Acta Geotechnica, 10(5): 587-606. [ Links ]
Muir-Wood, D & Maeda, K 2008. Changing grading of soil: Effect on critical states. Acta Geotechnica, 3(1): 3-14. [ Links ]
Poulos, S J, Castro, G & France, J W 1985. Liquefaction evaluation procedure. Geotechnical Engineering, 111(6): 772-792. [ Links ]
Prochaska, A B & Drnevich, V P 2005. One-point vibrating hammer compaction test for granular soils. Proceedings, ASCE Geo-Frontiers Conference held in Austin, TX, 24-26 January. Reston, VA: ASCE. [ Links ]
Rahman, M M & Lo, S R 2008. The prediction of equivalent granular steady state line of loose sand with fines. Geomechanics and Geoengineering, 3(3): 179-190. [ Links ]
Rahman, M M, Lo, S R & Dafalias, Y F 2014. Modelling the static liquefaction of sand with low-plasticity fines. Geotechnique, 64(11): 881-894. [ Links ]
Thevanayagam, S, Shenthan, T, Mohan, S & Liang, J 2002. Undrained fragility of clean sands, silty sands, and sandy silts. Geotechnical and Geoenvironmental Engineering, 128(10): 849-859. [ Links ]
Yang, S L, Sandven, R & Grande, L 2006. Steady-state lines of sand-silt mixtures. Canadian Geotechnical Journal, 43(11), 1213-1219. [ Links ]
Yang, J, Wei, L M & Dai, B B 2015. State variables for silty sands: Global void ratio or skeleton void ratio? Soils and Foundations, 55(1): 99-111. [ Links ]
 Correspondence:
L A Torres-Cruz
Department of Civil and Environmental Engineering
University of the Witwatersrand
Private Bag 3 Wits
2050
South Africa
T: +27 11 717 7150
E: LuisAlberto.TorresCruz@wits.ac.za
S Geyer
Prime Resources Environmental Consultants
POBox 2316
Parklands
2121
South Africa
T: +27 11 447 4888
E: stephan@resources.co.za
P R Mackechnie
Department of Civil and Environmental Engineering
University of the Witwatersrand
Private Bag 3 Wits 2050
South Africa
T: +27 11 326 0030
E: mackechniep@gmail.com

DR LUIS ALBERTO TORRES-CRUZ obtained his BSc in Civil Engineering from the Universidad del Valle in Cali, Colombia, and completed his PhD in Geotechnical Engineering at the University of the Witwatersrand (Wits). His doctoral research focused on the use of the cone penetration test to assess the liquefaction potential of tailings dams. He is currently a lecturer in Geotechnical Engineering at Wits.

STEPHAN GEYER obtained his BSc in Civil Engineering from the University of the Witwatersrand. He is currently employed at Prime Resources Environmental Consultants, where he is involved in the geotechnical and design aspects of water and mining residue management, including tailings storage facilities.

PETER MACKECHNIE obtained his BSc degree in Civil Engineering from the University of the Witwatersrand.

