


Services on Demand
Article
 English (pdf)
 Article in xml format
 Article references
Indicators

Related links
-
 Cited by Google
 -
 Similars in Google
Share

 Permalink
South African Journal of Chemistry
On-line version ISSN 1996-840X
Print version ISSN 0379-4350
S.Afr.j.chem. (Online) vol.76 Durban 2022
http://dx.doi.org/10.17159/0379-4350/2022/v76a07
RESEARCH ARTICLE
The use of ex-situ nitrogen-doped olive oil-derived carbon nano-onions for application in chemi-resistive gas sensors to detect acetone at room temperature
Thomas H MongweI; Themba D NtuliI; Ludwe L SikeyiI; Neil J CovilleI; Messai A MamoII; José PM SerbenaIII; Manoko S Maubane-NkadimengI, IV, *
IDSI-NRF Centre of Excellence in Strong Materials and the Molecular Sciences Institute, School of Chemistry, University of the Witwatersrand, Johannesburg, South Africa
IIDepartment of Chemical Sciences, University of Johannesburg, Johannesburg, South Africa
IIIDepartamento de Física, Universidade Federal do Paraná, Curitiba, Paraná, Brazil
IVMicroscopy and Microanalysis Unit, University of the Witwatersrand, Johannesburg, South Africa
ABSTRACT
This study reports on the synthesis of carbon nano-onions (CNOs; ca. d < 55 nm) and nitrogen-doped CNOs (N-CNOs) using a facile pyrolysis method and ex-situ doping of the CNOs. Elemental analysis of the N-CNOs revealed that their nitrogen content depended on the ammonia flow rate. Analysis of the N-CNOs revealed that they all exhibited structural defects. After the successful synthesis of CNOs and N-CNOs, polyvinylpyrrolidone (PVP):CNOs/N-CNOs:MnO2-nanorods (MONRs) composites were prepared and used as active sensing materials. In every case, the PVP polymer was used to stabilize the MONRs for acetone detection at 25 °C. The chemi-resistive gas sensors that showed the highest acetone sensitivity (pS = 2.0 x 10⁻⁴ ppm-1) was fabricated using a pristine CNOs (pCNOs) based composite. However, the N-CNOs based sensor (a15S) presented the lowest acetone limit of detection (LoD) at 1.2 ppm. The study implicated the effect of the nitrogen and oxygen content of the CNOs surfaces on the acetone detection. Thus, a higher sensitivity with lower LoD was observed at room temperature using the pCNOs based sensor, when compared to earlier literature reports.
Keywords: acetone, carbon nano-onions, chemi-resistive gas sensor, ex-situ nitrogen doping
INTRODUCTION
About four decades ago Iijima reported on multi-layered carbon allotrope with a quasi-spherical or spheroidal shape.1,2 Additionally, Kroto and McKay also reported on the formation of quasi-icosahedral carbon nanoparticles with spiral shells.2-4 This led to the discovery of a carbon allotrope exhibiting curved multi-layered graphene sheets forming a quasi-spherical shape (particle size: 20-300 nm) and it was named as carbon nano-onions (CNOs) owing to the nanoparticles' cross-sectional resemblance of an onion.5-7
Commonly, the arc discharge and catalytic chemical vapor deposition are the most used methods to synthesize CNOs.8,9 Each synthetic method results in CNOs with different physical properties. CNOs formed by different methods can vary in their core type (i.e. hollow, metal core filled and solid), number of multi-layers (i.e. long or short range layering order), number of concentric shells, nano-particles shape (e.g. quasi-spherical, hexagonal or polyhedral) and size.8-14 The layering of CNOs multi-layers, their graphitic nature, interlayer spacing and their structural morphology can be tuned by structural modification of the nanoparticles following processes such as annealing and/or washing.14 Moreover, the precursor (hydrocarbon source) used during synthesis also governs the formation of various types of CNOs.15
Mohapatra et al., reported a facile oil-wick open flame assisted synthetic method for producing solid quasi-spherical CNOs.16 This is a hydrocarbon(s) pyrolysis method which is catalyst free and it produces CNOs in grams scale. The method accommodates the use of various combustible hydrocarbon sources such as wood, wool, diesel, lycopene (from tomato), and petrol (gasoline).16-18 Additionally, the method is cost effective since it makes use of inexpensive hydrocarbon sources. Hence, this study presents the use olive oil as a hydrocarbon source since its general composition includes an assembly of lipids such as hydrocarbon and aliphatic alcohols.19-21 Olive oil can allow for the formation of CNOs that exhibit various oxygen species and/ or oxygenated functional groups which are enormously important for various application purposes.
The formation of CNOs using the pyrolysis method is initiated by poly-aromatic hydrocarbons (PAHs) that react to form concentric fullerene-like shells, following a process similar to that of a snow accretion.22,23 Thus, hydrocarbons such as paraffin and vegetable oils usually produce CNOs with comparable particle sizes.24,25 Research on CNOs has been driven by the remarkable electrical, mechanical and physiochemical properties associated with them.26 Due to these properties, CNOs have been used in numerous applications such as catalysis, energy, sensing and storage devices.26-28 Moreover, surface modifications of CNOs such as polymer surface decoration finds application in areas such as solar cells, lithium-ion batteries, and biomedical materials in the form of CNOs composites.29 The full potential and applicability of CNOs is also dependent on properties such as surface area as well as their solubility in either aqueous or organic solvents. Heteroatoms can also be introduced into the structural matrix of CNOs to give surface modifications which affects both their chemical and physical properties.30-32 Hence, like other carbon nanomaterials (e.g. carbon nano-tubes and fullerenes), CNOs have shown a great potential in chemical gas sensing device applications.33 For example, Barbar and co-researchers recently reported on a CNOs-polystyrene composite for detection of sulphur containing amino acids following the report by Mohapatra et al., which was based on the enzymatic and non-enzymetic electrochemical glucose sensors fabricated using CNOs.34,35
Apart from the use of CNOs-polymer composites for chemical gas sensing, the sensing property of CNOs can possibly be enhanced by its use in combination with various metal oxides.36 Metal oxides made from common metals such as manganese and zinc, are used in the fabrication of n-type semi-conducting sensors.37-40 However, there are limiting characteristics for the use of metal oxide-based sensors which include high cross-sensitivity, long-term signal drift, sensitivity to humidity, and slow sensor response. Thus, CNOs can be mixed with metal oxides (e.g. MnO2) to improve the metal oxide-based sensor performance working at room temperature.40,41
The preparation of gas sensors for room temperature sensing is advantageous since it offers low power consumption and low ignition risk when detecting flammable or explosive analytes.41 The use of CNOs can increase or promote the separation of charge carriers when blended or mixed with metal oxides (herein MnO2). This will offer cooperative or synergistic activity of the CNOs-metal oxide composite material since the recombination of charge carriers will be reduced in the sensing device circuit allowing for increased migration of charge carriers.42 Therefore, a facile application of the nanomaterial in room temperature VOCs gas sensing systems can be rendered by the use of CNOs since carbon nanoparticles have been previously used together with metal oxide and selected polymers to prepare sensors for detecting analytes such as 2-methylcyclopentanone, ethanol and methanol.36,41,43 Thus, in this study we demonstrate for the first time the use of pristine CNOs (pCNOs) and nitrogen-doped CNOs-metal oxide-polymer composite in chemi-resistive volatile organic chemical gas sensors (VOCGSs) as a gas sensing active material for detecting one of the common VOCs (i.e. acetone) at room temperature.
EXPERIMENTAL
Starting materials
Olive oil (Hercules Company, Durban, South Africa) and a fibre glass wick (purchased from a local retailer) were used as received. A polished brass collecting plate (BCP, size: 140 x 140 x 1.5 mm) and a steel-tube stand (see Scheme S1) were made in the University of the Witwatersrand Physical Sciences Workshop. Ammonia (NH3: 99.98%), argon (Ar: 99.99%) and compressed air (21% oxygen) were purchased from Afrox, South Africa. N,N-dimethylformamide (HCON(CH3)2: >99.80%, (DMF)), hexane (C6H14: 99.90%), potassium permanganate (KMnO4: >99%), manganese (II) sulfate monohydrate (MnSO4-H2O: >98.00%), acetone (CH3COCH3: >99.80%) and polyvinylpyrrolidone (C6H9NO)n: >98.00%, PVP) were purchased from Merck and were used as received.
Synthesis of CNOs and metal oxide nanorods
About 15 mL of olive oil was transferred into a 50 mL glass container in which a fibre-glass wick was immersed and allowed to stand for 30 minutes.44,45 The oil-wick glass container was placed beneath the BCP (see Scheme S1) at the optimized distance of ~80 mm between the nozzle and the BCP. The distance between the luminous zone of the flame and the collection plate was monitored and maintained at ~20 mm. Thereafter, the wick was ignited to produce a flame in a controlled air environment. In a typical experiment, a gas line was used to direct the flow of air towards the burning flame. This allowed for the simultaneous control of the flame shape and/or size as well as to promote the incomplete combustion. The as-synthesized product was continuously collected onto the BCP plate for 15 minutes. This was followed by collection of the product by scraping the black carbonaceous powder from the BCP using a solid-plastic spatula. The collected CNOs were washed with hexane in a Soxhlet extractor to remove excess oil from the carbon material. The final product was labelled as pCNOs.
pCNOs were then doped with nitrogen using the ex-situ nitrogen doping process. The doping process ofthe pCNOs was conducted using chemical vapour deposition (CVD) method. The sample of pCNOs (150 mg) contained in a quartz boat was placed in a CVD reactor as shown in Scheme S2. Ammonia was passed through the sample in the presence of argon as the carrier gas at 1000 °C. The carrier gas flow rate was kept constant at 100 sccm for all three experiments, whereas the NH3 flow rates were varied (100, 150 and 200 sccm) and the three samples collected were called a1CNOs, a1.5CNOs and a2CNOs respectively. Moreover, manganese oxide nanorods were synthesized using a method previously reported by Wang et al., without any modification (see Supplementary data for details).46
Fabrication of the sensing devices
The initial step involved the preparation of a mixed materials solution (i.e. composite solution), using different CNOs (i.e. pCNOs, a1CNOs, a1.5CNOs or a2CNOs), manganese dioxide (MnO2-nanorods), PVP and DMF. DMF was used as the preferred solvent due to its ability to disperse MnO2-nanorods (MONRs) together with different CNOs (i.e. pristine and doped CNOs). PVP was then used to stabilize the MONRs under room temperature conditions. For the preparation of different CNOs composites, a 3:1:1 ratio of PVP:CNOs:MONRs was added to 3 mL of DMF. The mixture was stirred for 12 hours at room temperature followed by sonication for an hour to obtain a homogeneous suspension of the composite.
Electrodes used for the device fabrication were cleaned following a standard procedure (see Supplementary information) before drop-casting the composite solution. Different composite solutions were drop casted onto the dry inter-digitated electrodes (IDEs). A micropipette was used to drop cast 10 ||L of each composite solution onto different IDEs to give four different sensing devices. The resulting sensors were vacuum dried at 100 °C for 30 minutes and then kept in a desiccator. All sensors were labelled as pS, a1S, a1.5S and a2S for sensors made from pCNOs, a1CNOs, a1.5CNOs and a2CNOs respectively.
Fabrication and testing of the sensing devices
The fabricated sensing devices were tested using the Agilent 4284A Precision LCR meter. 1, 3, 6, 10 and 20 kHz were selected frequencies used during the tests along with resistance measurements. Tests were conducted using five intervals of 1 μL per injection of acetone in a 2.4 L analysis chamber giving various concentrations of the analyte (i.e. acetone: 136, 271, 407, 543, 678 ppm), calculated using Equation 1.47

Where Vad represents the volume of the added analyte (i.e. volume of acetone in μL) added into the chamber, Vc is the volume of the analysis chamber used (2400 mL), pa is the density of analyte (0.791 g/mL at 25 °C) and Mwa is the molecular weight of analyte (58.08 g/mol).
In a typical test, 1 |L of acetone was injected into a sealed chamber in every step. The chamber was designed in a manner that allowed for analyte injection as well as exposing the sensors to different environments (see Scheme S3). Tests were conducted in a sealed glove box environment in which the relative humidity (RH) was maintained at 27%. The RH was constantly monitored using a constant flow of nitrogen at 300 sccm that was considered as a diluting-purging gas used to limit and/or reduce high moisture contents (i.e. RH: >30%) that generally affects the analyte detection at 25 °C. Measurements on the resistance as a function of frequency measurements were conducted to select the best working frequency for each sensor. This was done with five 1 μL intervals of acetone injected into the chamber in which each sensor was exposed to the analyte for 150 seconds per 1 ||L of acetone. Thus, any changes in frequency for each sensor were able to be observed considering the strength of the blank signal divided by the background noise of the blank signal over the same time, known as the signal-to-noise ratio (SNR), given by Equation 2.48

Where |i is the signal mean or expected value and a is the standard deviation calculation of the noise given out by each sensor. The sensitivity (Ss) and the limit of detection (LoD) were calculated using Equation 3 and 4 respectively. Determinations followed the change in the sensor response per concentration unit of the analyte (i.e. the slope of a calibration curve) which is the sensitivity of a sensing device. This was the first derivative of its response (herein; the response R is the relative resistance variation R = ΔR/Ri), with respect to the concentration of the analyte, at any concentration on the response curve.49,50

Where, the change in resistance is given by ΔR = Ra - Ri in which Ra is the resistance of the sensor when exposed to the analyte, Ri is the resistance of the sensor in an inert atmosphere (under N2) or background gas and [Ca] is the concentration of the analyte. Lastly, the lowest amount of analyte in the detection system that can be detected was estimated. This was achieved by using the following LoD equation.

Where Xb is the mean response of the blank and ab is the standard deviation of the blank.51,52
Characterization of the CNOs
The CNOs morphology and surface characteristics were studied by using the scanning electron microscopy (SEM) technique (FEI Nova Nanolab 600 FIB-SEM) operated at 30 kV. Transmission electron microscopy (TEM) data were obtained from a Tecnai G2 30ST instrument operated at 200 kV. The quality and structural properties of the CNOs (2 mg; supported on a silicon wafer sample holder)) were investigated using a Jobin-Yvon T64000 Ultraviolet (UV) LabRam HR-micro Raman spectrometer with an Olympus BX41 microscope. The Raman spectrometer used was operated with a liquid nitrogen cooled charge coupled device detector working at an excitation wavelength of 514.5 nm at room temperature. The thermal stability of the CNOs (10 mg) was monitored using a Perkin Elmer 6000 thermogravimetric analyser. A Micromeritics Tristar 3000 surface area and porosity analyser was used to determine the surface area as well as the pore volume of all the CNOs (200 mg). The composition and/or surface elemental analysis of CNOs was achieved using three different techniques; (1) the Tescan Vega-3-LMU-SEM coupled with the energy dispersive spectroscopy (EDS) X-Max 80 detector, (2) the LECO-932 carbon, hydrogen and nitrogen (CHN) analyser calibrated with a sulfamethazine as a standard, and (3) the Physical Electronics Quantum 2000 X-ray photoelectron spectroscopy (XPS) equipment, that used a monochromatic Al Ka source operated at 1486.7 eV.
RESULTS AND DISCUSSION
Structural morphology analysis of the CNOs
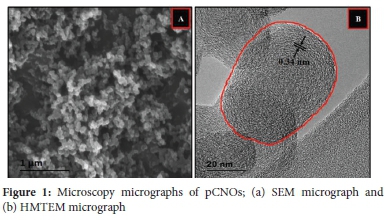
The obtained SEM micrographs revealed aggregation and/or conglomeration of quasi-spherical nanoparticles with particle sizes less than 100 nm (see Figure 1(a) and S1(a)). The observed morphology from the SEM micrographs was similar to that found in our previously work.53 SEM micrographs of the doped CNOs (i.e. ajCNOs, a15CNOs and a2CNOs) showed similar conglomerated quasi-spherical morphology without structural deformations or distortions (see Figure S1). Furthermore, the low magnification TEM micrographs revealed that the as-synthesized CNOs exhibited dense or solid quasi-spherical shapes with particle sizes of ca. 55±3 nm as shown in Figure S2(b), S2(c) and S3, supporting the SEM data. The conglomerates formed are ascribed to the van der Waals forces which led to linkages of quasi-spherical nanoparticles that are comprised of closed cages (see the highlighted quasi-sphere in Figure 1(b)) similar to those obtained by Panda et al. 54 This has revealed that the carbon nanoparticles produced are chain-like nanoparticles comprising multi-layered turbostratic shells. Moreover, Figure 1(b) also show concentric turbostratic shells of CNOs with radially continuous morphology of short-range ordered multiple concentric layers with the lattice fringe spacing of ca. 0.35 nm. The obtained lattice fringe spacing also indicated the presence of disordered graphitic carbon shells.16,55,56 The formation of the short-ranged multi-layers can be attributed to the types of radicals that facilitate the growth process of individual particles during the flame pyrolysis process. Similar results were obtained in our previous work in which the growth process known as the "snow ball" accretion process was discussed.53,57,58. In addition, these results are also comparable to those obtained by Mohapatra et al., and Reddy et al. 35,59
The nitrogen-doped CNOs (N-CNOs) showed similar shapes as compared to the pCNOs. The high magnification TEM (HMTEM) micrographs shown in Figure S2(b), (c) and (d) indicates that the conglomerated, multi-centred concentric and short-range ordered CNOs were still present following the doping process. This confirmed that the heat treatment during the doping process promoted further short-range ordering through nanoparticles healing and not the formation of new structural morphologies or growth of the nanoparticles.
Raman spectroscopic analysis of CNOs
A micro-Raman spectroscopic analysis technique was used to investigate the structural properties of CNOs obtained. The position, intensity and breadth of both bands (i.e. D- and G-band) were used as the measure for determining the quality of the CNOs. It is evident that for all samples, the D-band is positioned in the expected Raman region (i.e. between 1337 and 1346 cm-1). This observation can be ascribed to the disorder induced by C-C vibrations corresponding to the disruption of the sp2 hybridized carbon bonds. The suggested disruptions are due to the presence of dangling bonds, sp3 bonding, C and H adatoms, intercalated C and H atoms, vacancies, as well as other carbon rings arising from structural disorder.9,60 Furthermore, the presence of this D-band indicates the breathing mode of the sixfold aromatic rings in the carbon nanoparticles structural matrix.9,61 Moreover, to quantify the degree of graphitization of the CNOs, the ratio of the areas (fitted with Voigt line shapes using the Origin 8.5 inbuilt fitting fixture) of the D-band to that of the G-band (ID/IG) was estimated. Table 1 gives a summary of the Raman data obtained. The defects and/or disorder density ratios (ID/IG) are directly related to the extent of disorders in the form of sp3 hybridized carbons and the presence of either longer or shorter graphitic fragments.60,61 It can also be seen that the ID/IG values of the pristine and doped CNOs were ca.
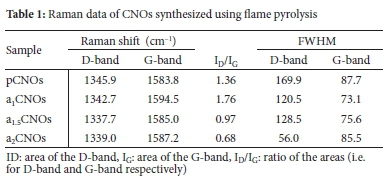
> 0.5, which further denotes a certain degree of graphitization (i.e. the presence of deformed graphitic carbon) depending on the sample. The data in Table 1 reveals that for all doped samples, there exists a down-shift (D-band) and an up-shift (G-band) with reference to the pristine sample respectively. This indicates that doped CNOs exhibit curvature distortions as seen in other curved carbon nanostructures (e.g. carbon spheres). Therefore, it can be said that N-CNOs exhibit both the armchair and zig-zag edges at the graphitic boundaries.62-64 Additionally, these shifts can be regarded to be proportional to the number of edges and/or in-plane terminations of either the hexagonal or pentagonal carbon network of the CNOs outer shells which can in turn change the sp3 to sp2 carbon fraction. This observation can be attributed to the healing effect induced by the heat treatment during doping. Moreover, the results in Table 1 also suggest that pCNOs, a15CNOs and a2CNOs exhibit a higher quantity of sp2 to sp3 carbon content with a1CNOs having the lowest quantity of sp2 to sp3 \ as its Raman spectrum shows a slightly higher D-band intensity than the G-band intensity. This is further supported by the intensities of the G-bands that are more intense than the D-bands for pCNOs, a15CNOs and a2CNOs respectively as shown in Figure S4 and S5.
In contrast, the D- and G-band FWHMs of the pCNOs are higher than those of the doped samples (see Table 1). This indicates an increased amount of structural disorder that can be ascribed to the exposure of the in-plane terminations of either hexagonal or pentagonal carbon network of the CNOs outer shells as well as amorphous carbon impurities. The exposure of the in-plane terminations on the CNOs shells can be proposed to contribute to the amount of zig-zag edge defects, thereby increasing the sp3 content within the curvature of the shells of the pCNOs.65-67 All doped CNOs showed Raman spectra with lower D- and G-band FWHM values as compared to that of the pCNOs sample, as shown in Table 1. On the other hand, the defects and/or disorder density ratio (ID/IG) for all doped samples were estimated to be ca. 1.76, 0.97, and 0.68 for a1CNOs, a15CNOs and a2CNOs respectively. This can be attributed to the removal of amorphous carbon impurities by heat treatment (i.e. at 1000 °C) used during the doping process.
The decreasing ID/IG trend can also be attributed to a remarkable reduction of the sp3 carbons after heat treatment that promoted reordering of the multi-layers in which nanoparticles underwent structural healing as suggested by TEM results. As seen in the Raman results, both a1.5CNOs and a2CNOs presented lower ID/IG than the pCNOs. This is also due to a reduction of defects or disorder from the in-plane edges of either the hexagonal or pentagonal carbon networks of the CNOs outer shells (see Figure S4(b)). There was some incorporation of nitrogen adatoms which contributed to the defect densities since the attachment of nitrogen adatoms mainly occurred on the outer shell edges. The nitrogen adatoms surface attachment was affected by the flow rate of the NH3. Moreover, at high flow rates (i.e. > 150 sccm), there were less surface attachments which resulted in less N doping of the material. The higher ID/IG ratio for the a1CNOs (ca. ID/IG=1.76) suggests that the as-prepared CNOs (i.e. pCNOs with ID/ IG=1.36)) can be doped with nitrogen heteroatoms using the lowest NH3 flow rate (i.e. 100 sccm).
Thermal stability of pristine and doped CNOs
The thermogravimetric analyses (TGA) and differential thermogravimetric analyses (DTA) data correlates with the Raman data. All CNOs samples decompose to completion (i.e. 0% sample residue) by the combustion process since the carbons residual mass remains at 0% following the completion of every TGA analysis as shown in Figure 2(a). Thus, the obtained TGA profiles suggest facile oxidative decomposition of the materials.68
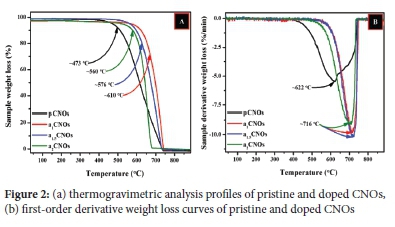
The first-order derivative weight loss curves for all samples were established as shown in Figure 2(b). The first-order derivative weight loss (FDW) curve for pCNOs exhibited a broader shape as compared to N-CNOs samples. The broader FDW curve for the pCNOs showed that the decomposition of this material happened in two stages. The decomposition peak at ~622 °C suggests a first slow decomposition ofthe disordered graphitic outer shells whereas the shoulder observed around ~700 °C can be ascribed to the decomposition of the graphitic carbon core exhibited by pCNOs. The shoulder in the FDW curve of pCNOs at a higher temperature (around ~700 °C) signifies the presence of multiple centers or a core promoted by the conglomeration of nanoparticles as previously seen in the HMTEM micrographs (see Figure S2(d)).
It is also evident that the N-CNOs homogenously decompose faster than the pCNOs since all the doped CNOs show narrower FDW curves. The doping process also increased the doped material thermal stability which suggests the doping process does not only introduce nitrogen adatoms but also modifies the structural matrix of the turbostratic CNOs (see Figure 2(b)).69,70 On the other hand, the fitted Voigt line shapes shows that the broader peak for the pCNOs has a higher full width at half maximum (FWHM ~174.6) relative to those of the doped CNOs samples (FWHM ~76.9(a1CNOs), 78.0 (a1.5CNOs), and 94.7(a2CNOs)) indicating a slow decomposition of disordered pCNOs (see Figure S6). Furthermore, the narrow peaks with lower FWHM values can also be attributed to the structural rearrangements induced by heat treatment for all doped samples. Additionally, the FWHM value of a2CNOs is higher than for both a1CNOs and a1.5CNOs which corresponds to the FWHM values of the Raman data obtained (Raman FWHM ca. 73.1 (a1CNOs) 75.6 (a15CNOs), and 85.5 (a2CNOs). This further suggests that the a2CNOs sample was poorly doped with nitrogen heteroatoms due to a higher dopant source flow rate (i.e. 200 sccm).70
In summary, the observed TGA profiles of all CNOs synthesized as well as their Raman and HMTEM data can be explained by considering the healing and growth processes involved during their synthesis. Therefore, the doping and heat treatment of the as-prepared CNOs can be thought of as promoting structural rearrangement and strength simultaneously leading to varied disordered graphitic CNOs with the different defect or disorder densities.
Elemental and surface area analysis of CNOs
The energy dispersive X-ray (EDX) spectra were analyzed and they showed that different CNOs are mainly composed of elemental carbon, oxygen, and nitrogen atoms in their structural matrix (see Figure S7 and Table S1). Notably, the carbon peaks are are due to the carbon based samples and the SEM carbon tape. Adding to the EDX results, the CHN results shown in Table 2 reveals that all samples are predominantly made of carbon with the hydrogen contents less than 10%. A decrease in nitrogen content for doped samples was observed as the flow rate of NH3 increased. The results in Table 2 show that a1CNOs (N: 3.34%) has a higher nitrogen content when compared to a15CNOs (N: 3.28%) and a2CNOs (N: 2.89%). These results signify that the use of higher NH3 flow rates when doping CNOs discouraged the introduction of nitrogen heteroatoms.
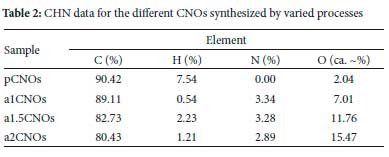
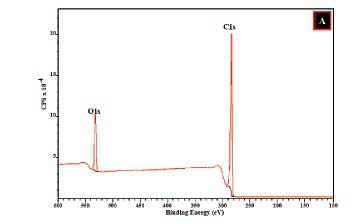
Moreover, the doping process can introduce different types of nitrogen species in the CNOs structural matrix as suggested by Dias et al.71 Hence, for most carbonaceous nanoparticles, there exist possibilities for the formation of graphitic, pyridinic, or pyrrolic nitrogen sites as well as lactam, pyridinic oxide and/or amine nitrogen attachments on the surfaces of CNOs.72,73 The oxygen content showed an increase with pCNOs > N-CNOs. The XPS data (Figure 3(a)) further reveals that the pCNOs exhibit C and O atoms in the structural matrix which can form groups such as carboxylic acid groups.74,75
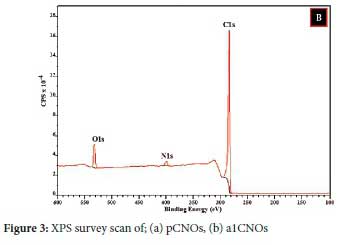
The XPS data for a1CNOs also revealed that the sample exhibited various carbon and oxygen atom arrangements along with different N bonding patterns (graphitic, pyridinic, or pyrrolic nitrogen) that exist on the a1CNOs surfaces (see Figure 3(b) and 4).72,75 The deconvolution of the C1s peak gave rise to different carbon atom types and the signals obtained comprises of carbon atoms that are hybridized differently (i.e. sp2 and sp3, see Figure 4(a)).76,77. Additionally, the deconvolution of the N1s peak revealed significant information about the different types of nitrogen that are associated with a1CNOs. It is evident from Figure 4(b), that the a1CNOs exhibit four different types of N groups and the corresponding peaks for pyridinic-N, pyrrolic-N, graphitic-N, and oxygenated pyridinic-N (i.e. NOx) were positioned at 397.71 eV, 398.48 eV, 400.15 eV, and 402.83 eV respectively (also see Figure 4(d)).72,78 This indicates a wide range of N type species with different average percentage concentrations of the N atoms present viz. 23.64%, 37.59%, 21.32%, and 17.44% for pyridinic-N, pyrrolic-N, graphitic-N, and oxygenated pyridinic-N respectively. Thus, the pyrrolic-N configuration dominated the sample and signifies the formation of a carbonaceous sample that is capable of donating charge carriers.79,80
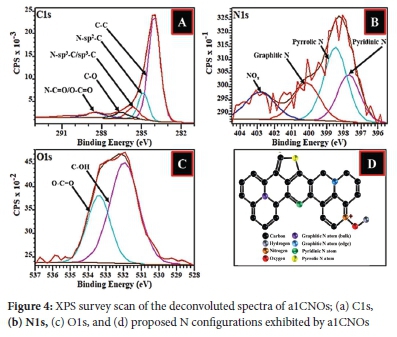
Lastly, the O1s peak was also deconvoluted as shown in Figure 4(c), and it can be confirmed that the a1CNOs sample also contained oxygenated carbon atoms with different bonding configurations.7,81 Hence, the nanoparticles produced exhibited different oxygen species on their surfaces.81,82
The surface properties (i.e. the surface areas (SA) and pore sizes (PS)) of all CNOs were investigated using the BET surface characterization technique. The surface area of pCNOs (69 m2 g-1) was less than that of the doped samples and showed a decreasing pattern with increasing flow rate of NH3 as; a1CNOs (206 m2 g-1), a15CNOs (191 m2 g-1) and a2CNOs (188 m2 g-1) (see Figure 5).
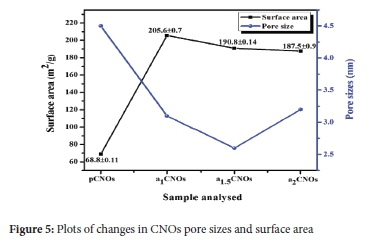
The increased content of adatoms improved the surface area of the as-synthesized CNOs, which was supported by the heat treatment that promoted the reduction of the carbonaceous mass upon doping. This suggests the continuous accretion of pCNOs particles forming multiple nucleation centres supported by the amorphous carbonaceous mass before the doping process. Furthermore, the pore size plot in Figure 5 shows that all CNOs samples exhibit inter- and intra-particle pores which suggest that the calculated defect densities from the Ramandata also contribute to these type of pores. The pore sizes are different for all CNOs samples which can be due to the possible formation of inter- and intra-particle pores on the outer shells of CNOs depending on the conformation of the nanoparticles. In summary, the BET results indicate that the surface properties of the CNOs (i.e. the pore size and surface area) are greatly influenced by the synthesis parameters (e.g. heat treatment and dopant source flow rate) which affect the curvature, shape and direct contact area (aggregation or agglomeration) of carbon nanoparticles. In addition, MONRs can provide large surface area to the MONRs/CNOs based composite to allow for high response at low concentrations of acetone such as in the case of vanadium oxide (VO2).83
Electrochemical tests for VOCGSs based on different CNOs
Signal to noise and resistance measurements of the sensing devices
Four different sensors (i.e. pS, a1S, a15S and a2S) were fabricated and tested. The signal to noise ratio (SNR) was determined using Equation 2 as discussed in Section 2.4 in which different working frequencies were used (i.e. 1 kHz, 3 kHz, 6 kHz, 10 kHz and 20 kHz). Most of the sensing devices showed the highest SNR values occurred at 10 kHz relative to the frequency working range (see Figure S8). Hence, 10 kHz was selected as the optimal working frequency for all the sensors. Moreover, the use of this frequency is preferred because it allows for fabrication of sensing systems that use lower electrical power.84
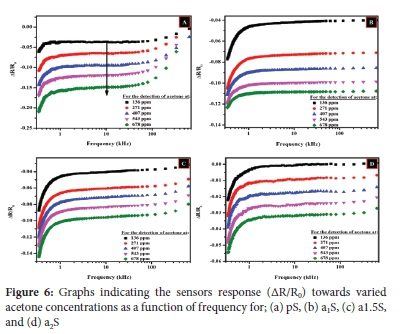
A similar response towards acetone was shown by the decrease in resistance whenever the concentration of acetone was increased (i.e. from 0 ppm to 678 ppm) for all sensors as shown in Figure S9. The differences in the shape of the baseline (i.e. resistance (R) versus frequency (f curves at 0 ppm) are as the result of potential kinetically controlled states (see Figure S9). This also includes the adsorption processes that involves chemisorption and/or physisorption for every sensing device. This can also be attributed to the dispersion and film thickness of the active sensing material. The sensors' response (AR/R0) as a function of frequency plots revealed that the shape of the b aselines for the blank measurements varied with different sensors as shown in Figure 6. These observations suggest that the adsorption of the acetone molecules on a CNOs-based sensing material selectively depends on the dipole-moment, polarity, porosity, as well as vapor pressure of the carbon surface used in the sensing composite.85,86
Acetone is one of the VOCs that is regarded as a polar aprotic analyte which means it is incapable of donating protons in hydrogen bonding interactions.87 Polar and volatile analytes usually interact with functional groups and/or active sensing sites on the sensing material surface more than their nonpolar counterparts. Thus, acetone can also facilitate a molecular interaction with the carbonaceous sensing material. Hence, in this study it is regarded as an electron donor or reducing gas based on its molecular properties. This was indicated by the decrease in resistance (i.e. increased conductivity) during its detection.88,89
Consequently, the presence of carbon embedded or supported manganese oxide nanoparticles in the sensing composites provides the n-type semiconducting properties with electrons as major charge carriers in the system containing a reducing gas. This electronic property as well as their nanoscale morphology allows for their use in acetone detection such as in the case of VO2.83,90 Notably, most metal oxides (e.g. MnO2) indicate the existence of O2- (superoxide) which rarely exists in carbonaceous materials such as in CNOs.91 Since CNOs can exhibit all other types of oxygen species except for the superoxide species, this means that the metal oxide can provide this important species for better gas sensing properties when the composite includes the two materials (i.e. CNOs and MONRs).92
All acetone sensing tests were conducted in an environment in which the relative humidity (RH) was maintained at 27%. Basically, the major charge carriers can be from different oxygen species that are responsible for establishing the charge equilibria on the carbon distributed metal oxide surface. Different oxygen species on the surface of the carbon-metal oxide sensing material can be generated by the adsorbed oxygen molecules from the air during the sensing device preparation.93 The nucleophilic type oxygen species, such as O2- (oxo), are usually involved in C-H bond cleavage (either homolytic or heterolytic) during oxidative dehydrogenation. In contrast, some oxygen species can be less electrophilic such as O2- (superoxide) and O2- (oxo).94 The existence of oxygen species such as O2- on the sensing material can promote the formation of a surface inversion layer resulting in a specific sensing response depending on the properties of the sensing material. This can occur when the oxygen species such as O2- dissociates after capturing an additional electron from a donor to form another oxygen specie as described in the reaction equations below.95
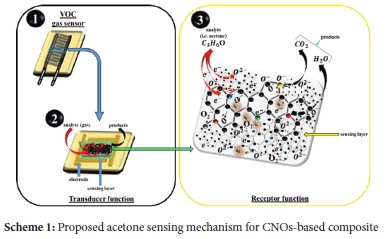
These ionized species can further promote total oxidation of acetone to form carbon dioxide (CO2) and water (H2O) as depicted in Scheme 1.96 Thus, it can be suggested that the oxidation of acetone molecules at the surface of the sensing materials follows the reaction mechanism described by Equation 7 and Scheme 1 respectively.97
Furthermore, the change in resistance is also attributed to a relatively stronger charge transfer interaction (i.e. chemisorption) as opposed to a weaker dipole or van der Waals (i.e. physisorption).98,99 Semiconducting metal oxides commonly show the abundant adsorption of oxygen species with negative charge forming electron-depletion layers (EDLs) near the surfaces of n-type metal oxide semiconductors.100 Hence, the introduction of negative charges by acetone occurs on the sensing material such that its molecules can interact with the negatively charged oxygen species on the surface of CNOs distributed and/or embedded metal oxides (i.e. MnO2) nanoparticles.101 The trapped electrons in the carbon distributed metal oxides composite sites are therefore injected into the EDL leading to the electron concentration increase and ultimately the decrease in resistance of the sensors.100,102 In summary, the composites used in this study reveal the synergistic effects between all materials used in the mixture (i.e. PVP, CNOs and MONRs). The obtained results suggest that the response of the sensors is greatly influenced by simultaneous surface interactions of acetone gas molecules with different CNOs and/or MONRs that form the sensing composite. However, this depends on the availability or exposure of active adsorption sites which can also be influenced by dispersion and film thickness of the active sensing material.
Sensitivities (S) and limit of detections (LoDs) of the sensing devices
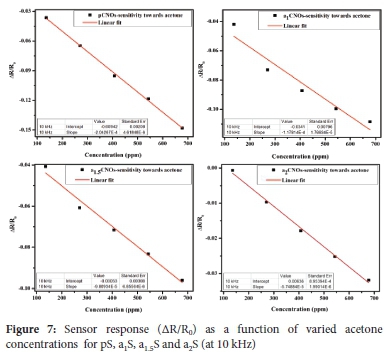
The resistance and response results obtained revealed an n-type behavior for all sensors as shown by a decrease in resistance with increasing acetone concentrations. This observation was then followed by determinations of the sensitivity of the sensors (S) under the decreasing resistance and SNR conditions (i.e. at 10 kHz) for varied acetone concentrations (ppm) respectively. The change in each sensor's response per concentration unit of the analyte was determined as the sensor's sensitivity (S) using the slope of the calibration curve.
The results in Figure 7 and Table 3 reveals that pS (S: 2 x 10⁻⁴ ppm-1) is the most sensitive sensor, 'of those studied', toward the detection of acetone. The order of sensitivity was determined as pS (S: 2.0 x 10⁻⁴ ppm-1)>a1S (S: 1.2 x 10⁻⁴ ppm-1)>aL5S (S: 9.5 x 10⁻⁵ ppm-1)>a2S (S: 5.7 x 10⁻⁵ ppm-1) and this decreasing order indicates that all sensors fabricated using N-CNOs composites exhibit lower sensitivities towards acetone. Moreover, a decreasing order of sensitivities was maintained by sensors fabricated using N-CNOs-based composites since a1S (1.2 x 10⁻⁴ ppm-1)>aL5S (9.5 x 10⁻⁵ ppm-1)>a2S (5.7 x 10⁻⁵ ppm-1). This observation can be due to the presence of the carbonyl groups (C=O) in the molecular structure of acetone. These organic groups create an electron donating effect on the CNOs-MONRs based surface that is rich with oxygenated groups leading to a better sensitivity of pS as compared to sensors based on N-CNOs. Thus, the presence of adatoms, oxygenated groups and/or amorphous carbon impurities in the pCNOs sample contributed to the higher sensitivity obtained for pS sensor. This is due to the availability of multi-active attachment sites on the pCNOs based composite layer for the attachment of acetone molecules. Moreover, a1S ad the highest sensitivity as compared to a15S and a2S due to a1CNOs being the most favored sample during the doping process (i.e. a1CNOs are highly defective with higher N content (electron-rich)).103
Additionally, a1S was the second most sensitive sensor following pS because the predominantly doped a1CNOs used for a1S exhibited nitrogen defective sites that hindered the attachment of acetone molecules. However, the nitrogen defective sites exhibited by a1CNOs alternatively promoted charge transport through proton hopping within the PVP:a1CNOs:MONRs based composite. Hence, a decrease in charge carrier resistance on the surface of the active nanoparticles was observed.
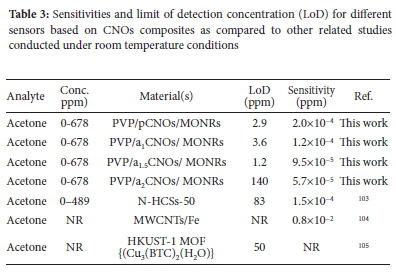
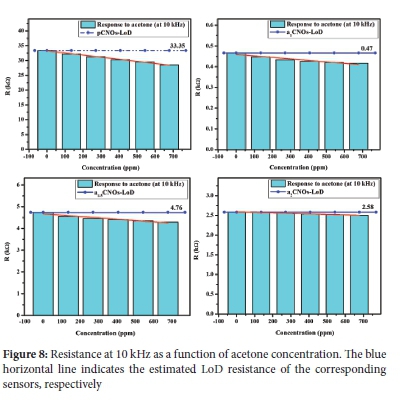
The lowest amount of acetone in the detection system that can be detected and that is significantly different from the blank was determined using the LoD equation (see Section. 2.4). As shown in Figure 8, the LoD results for all sensors indicates that the sensor with the lowest LoD is a15S (LoD: 1.2 ppm) but it is the third most sensitive sensor towards acetone (see Figure S10). Furthermore, the summary in Table 3 also reveals that the most sensitive sensor (i.e. pS) is the device with the second lowest LoD. Notably, the LoD (2.9 ppm) of pS is lower than that of the sensor fabricated using nitrogen-doped hollow carbon spheres (N-HCS) reported by Mutuma et al., (LoD: 83 ppm).103 Moreover, Mutuma et al. reported a lower sensitivity (S: 1.5 x 10⁻⁴ ppm-1) than that shown by pS (S: 2.0 x 10⁻⁴ ppm-1). This can be associated with the presence of different oxygenated groups on the pCNOs surface edges that are additionally contributing to the type of oxygen species exhibited by the active composite in the sensing device (i.e. pS sensor). However, the sensitivity reported by Mutuma et al., was higher than the sensitivities of all sensors prepared using doped samples.103 This can be attributed to the inactive nitrogen-induced defects on the N-CNOs surfaces that unfavorably allowed for the interaction of the nitrogen-containing groups with acetone molecules depending on the type of nitrogen adatoms present on the CNOs surfaces.
The use of the various carbon and metal oxide composite in this study offers a different sensing ability towards acetone due to the rapid adsorption of the reducing gas. Hence, the significance of this study is the finding oflow LoD and sensitivity values recorded for acetone using pCNOs as compared to other reports in the literature.102-106 Despite the low sensitivity shown by some of the sensors (e.g. a2S) towards acetone, the ability to detect it at lower concentrations by all sensors is also a significant finding. Furthermore, the results reveals that the controlled temperature and relative humidity gives a great potential to improve the chemical sensing properties of carbon and metal oxide nanoparticles based composites. These results also suggest future modification of carbon composites based chemical sensors. Thus, this study reports on the fundamental sensing properties of olive oil derived pristine and doped CNOs towards acetone gas molecules for the first time. Moreover, it also gives indications that the predominance of nitrogen adatoms plays a significant role in the detection process of acetone by also involving a specific type of nitrogen (e.g. pyrrolic-N) present on the surfaces of CNOs nanoparticles.
CONCLUSIONS
A facile synthesis of quasi-spherical CNOs with particle sizes of ~55 nm was successfully achieved using an olive oil flame pyrolysis method. Upon nitrogen doping of CNOs, the defect density induced in the CNOs structural matrix decreased with increasing dopant source flow rate used in the CVD reactor. The presence of CNOs structural defects and/or disorder was confirmed by the variable breadths of the first-order derivative peak (DTA, FWHM data) as well as the Raman band area ID/IG ratios. The surface areas of all the ex-situ doped CNOs were greater than 150 m2 g-1 and directly proportional to the nitrogen content. The successful doping of CNOs was confirmed by the CHN data which revealed the presence of nitrogen for all doped samples (between 2 and 4% N content). These results were further supported by the EDX and XPS data in which different oxygen species were also identified to be present in the CNOs prepared along with the dominance of the pyrrolic-N configuration. The pristine and doped CNOs showed a positive response towards the detection of acetone which was promoted by the presence of different hetero-atomic species exhibited by CNOs.
It was evident that the pS exhibited higher sensitivity towards acetone indicating that the role of ex-situ nitrogen doping process only promoted the use of highly durable CNOs with decreased surface active sites leading to poor interactions between the analyte and the active sensing surface as revealed by Raman and TGA results. Our data also indicated that the physicochemical properties of the materials used to form the composites (i.e. PVP, CNOs and MONRs) influence how the fabricated device responds towards the detection of acetone at room temperature. The LoDs and sensitivities obtained revealed a positive response of the prepared sensors towards acetone. However, the response was only observed when the three materials (i.e. PVP, CNOs and MONRs) were used to form the composite. Moreover, the a1S detector showed better sensitivity towards acetone as compared to other sensors fabricated using doped CNOs (i.e. a15S and a2S). This suggests that nitrogen-doped carbon nanoparticles can be used for the detection of acetone at room temperature. Hence, there is great potential to improve the chemical sensing properties using different composites of carbon nanoparticles, such as CNOs, and various metal oxide nanoparticles to detect different VOCs at room temperature.
ACKNOWLEDGMENTS
This work is based on the research supported in part by the National Research Foundation (NRF) of South Africa (Grant Numbers: 99196 and 118656); the University of the Witwatersrand and the Department of Science and Innovation (DSI-NRF) Centre of Excellence in Strong Materials (CoESM). Sincere gratitude goes to Ms. Rhandzu Rhikhotso at the Council for Scientific and Industrial Research (CSIR-Pretoria, South Africa) for the high magnification TEM analysis and Dr. Rudolph Erasmus (School of Physics, University of the Witwatersrand) for the Raman analysis. We also extend our appreciation to Goitsione E. Olifant and Lesego Malepe in the sensors group at the University of Johannesburg for their contribution towards device fabrication techniques as well as Clara I. Garcia-Martinez in Prof. Jose Serbena's group (Group of Organic Optoelectronic Devices (GOOD)) for technical assistance and support during the LCR meter operation at the Federal University of Parana (UFPR-Curitiba, Brazil), and a tribute to the late member of GOOD, Prof. Ivo A. Hümmelgen.
CONFLICT OF INTEREST
Authors declare that there are no conflicts of interest.
SUPPLEMENTARY MATERIAL
Supplementary information for this article is provided in the online supplement.
ORCID IDs
Thomas H Mongwe: - https://orcid.org/0000-0002-5578-512X
Themba Dominic Ntuli - https://orcid.org/0000-0003-0863-5599
Ludwe L Sikeyi - https://orcid.org/0000-0003-3917-4983
Neil Coville - https://orcid.org/0000-0001-5370-1386
Messai A Mamo - https://orcid.org/0000-0003-2775-2301
Jose Pedro Serbena - https://orcid.org/0000-0003-4286-5064
Manoko S. Maubane-Nkadimeng - https://orcid.org/0000-0001-9463-3033
REFERENCES
1. Iijima S. High resolution electron microscopy of some carbonaceous materials. J Microsc. 1980;119(1):99-111. https://doi.org/10.1111/j.1365-2818.1980.tb04081.x. [ Links ]
2. Iijima S. Direct observation of the tetrahedral bonding in graphitized carbon black by high resolution electron microscopy. J Cryst Growth. 1980;50(3):675-683. https://doi.org/10.1016/0022-0248(80)90013-5. [ Links ]
3. Iijima S. The 60-carbon cluster has been revealed. J Phys Chem. 1987;91(13):3466-3467. https://doi.org/10.1021/j100297a002. [ Links ]
4. Kroto HW, McKay K. The formation of quasi-icosahedral spiral shell carbon particles. Nature. 1988;331(6154):328-331. https://doi.org/10.1038/331328a0. [ Links ]
5. Cabioc'h T, Thune E, Jaouen M. Mechanisms involved in the formation of onion-like carbon nanostructures synthesized by ion implantation at high temperature. Phys Rev B Condens Matter. 2002;65(13):132103. https://doi.org/10.1103/PhysRevB.65.132103. [ Links ]
6. Bhinge SD. Carbon nano-onions-An overview. J. Pharm. Chem. Chem Sci. 2017;1:1-2. https://www.alliedacademies.org/articles/carbon-nanoonions-an-overview-8569.html [accessed 13 March 2022] [ Links ]
7. McDonough JK, Gogotsi Y. Carbon onions: synthesis and electrochemical applications. Electrochem Soc Interface. 2013;22(3):61-66. https://doi.org/10.1149/2.F05133if. [ Links ]
8. Kuznetsov VL, Butenko YV, Chuvilin AL, Romanenko AI, Okotrub AV. Electrical resistivity of graphitized ultra-disperse diamond and onion-like carbon. Chem Phys Lett. 2001;336(5-6):397-404. https://doi.org/10.1016/S0009-2614(01)00135-X. [ Links ]
9. Obraztsova ED, Fujii M, Hayashi S, Kuznetsov VL, Butenko YV, Chuvilin AL. Raman identification of onion-like carbon. Carbon. 1998;36(5-6):821-826. https://doi.org/10.1016/S0008-6223(98)00014-1. [ Links ]
10. Banhart F, Ajayan PM. Carbon onions as nanoscopic pressure cells for diamond formation. Nature. 1996;382(6590):433-435. https://doi.org/10.1038/382433a0. [ Links ]
11. Banhart F, Redlich P, Ajayan PM. The migration of metal atoms through carbon onions. Chem Phys Lett. 1998;292(4-6):554-560. https://doi.org/10.1016/S0009-2614(98)00705-2. [ Links ]
12. Cabioc'h T, Girard JC, Jaouen M, Denanot MF, Hug G. Carbon onions thin film formation and characterization. Europhys Lett. 1997;38(6):471-476. https://doi.org/10.1209/epl/i1997-00270-x. [ Links ]
13. Chhowalla M, Wang H, Sano N, Teo KBK, Lee SB, Amaratunga GAJ. Carbon onions: Carriers of the 217.5 nm interstellar absorption feature. Phys Rev Lett. 2003;90(15):155504. https://doi.org/10.1103/PhysRevLett.90.155504. [ Links ]
14. Huang JY. In Situ Observation of quasimelting of diamond and reversible graphite-diamond phase transformations. Nano Lett. 2007;7(8):2335-2340. https://doi.org/10.1021/nl0709975. [ Links ]
15. Salamanca M, Botero ML, Martin JW, Dreyer JAH, Akroyd J, Kraft M. The impact of cyclic fuels on the formation and structure of soot. Combust Flame. 2020;219:1-12. https://doi.org/10.1016/jxombustflame.2020.04.026. [ Links ]
16. Mohapatra D, Badrayyana S, Parida S. Facile wick-and-oil flame synthesis of high-quality hydrophilic onion- like carbon nanoparticles. Mater Chem Phys. 2016;174:112-119. https://doi.org/10.1016/j.matchemphys.2016.02.057. [ Links ]
17. Mohapatra D, Parida S, Badrayyana S, Singh BK. High performance flexible asymmetric CNO-ZnO//ZnO supercapacitor with an operating voltage of 1.8 V in aqueous medium. Appl Mater Today. 2017;7:212-221. https://doi.org/10.1016/j.apmt.2017.03.006. [ Links ]
18. Dubey P, Tripathi KM, Mishra R, Bhati A, Singh A, Sonkar SK. A simple one-step hydrothermal route towards water solubilization of carbon quantum dots from soya-nuggets for imaging applications. RSC Advances. 2015;5(106):87528-87534. https://doi.org/10.1039/C5RA14536H. [ Links ]
19. Boskou D, Blekas G, Tsimidou M. Chapter 4: Olive oil composition. In: Boskou D, editor. Olive oil. 2nd ed. Chemistry and Technology.New York: AOCS Publishing. 2006, p. 41-72. https://doi.org/10.4324/9781003040217 [ Links ]
20. Servili M, Selvaggini R, Esposto S, Taticchi A, Montedoro GF, Morozzi G. Health and sensory properties of virgin olive oil hydrophilic phenols: agronomic and technological aspects of production that affect their occurrence in the oil. J Chromatogr A. 2004;1054(1-2):113-127. https://doi.org/10.1016/j.chroma.2004.08.070 [ Links ]
21. Visioli F, Franco M, Toledo E, Luchsinger J, Willett WC, Hu FB, Martinez-Gonzalez MA. Olive oil and prevention of chronic disease: summary of an international conference. Nutr Metab Cardiovasc Dis. 2018;28(7):649-656. https://doi.org/10.1016/j.numecd.2018.04.004. [ Links ]
22. Tripathi KM, Singh A, Bhati A, Sarkar S, Sonkar SK. Sustainable feasibility of the environmental pollutant soot to few-layer photoluminescent graphene nanosheets for multifunctional applications. ACS Sustain Chem& Eng. 2016;4(12):6399-6408. https://doi.org/10.1021/acssuschemeng.6b01045. [ Links ]
23. Frenklach M. Reaction mechanism of soot formation in flames. Phys Chem Chem Phys. 2002;4(11):2028-2037. https://doi.org/10.1039/B110045A. [ Links ]
24. Dhand V, Prasad JS, Rao MV, Bharadwaj S, Anjaneyulu Y, Jain PK. Flame synthesis of carbon nano onions using liquefied petroleum gas without catalyst. Mater Sci Eng C. 2013;33(2):758-762. https://doi.org/10.1016/j.msec.2012.10.029. [ Links ]
25. Jung SH, Myung Y, Das GS, Bhatnagar A, Park J, Tripathi KM, Kim TY. Carbon nano-onions from waste oil for application in energy storage devices. New J Chem. 2020;44(18):7369-7775. https://doi.org/10.1039/D0NJ00699H. [ Links ]
26. Palkar A, Melin F, Cardona CM, Elliott B, Naskar AK, Edie DD, Kumbhar A, Echegoyen L. Reactivity differences between carbon nano onions (CNOs) prepared by different methods. Chem Asian J. 2007;2(5):625-633. https://doi.org/10.1002/asia.200600426. [ Links ]
27. Han F, Yao B, Bai Y. Preparation of carbon nano-onions and their application as anode materials for rechargeable lithium-ion batteries. J Phys Chem C. 2011;115(18):8923-8927. https://doi.org/10.1021/jp2007599. [ Links ]
28. de Heer WA, Ugarte D. Carbon onions produced by heat treatment of carbon soot and their relation to the 217.5 nm interstellar absorption feature. Chem Phys Lett. 1993;207(4-6):480-486. https://doi.org/10.1016/0009-2614(93)89033-E. [ Links ]
29. Kausar A. Carbon nano onion as versatile contender in polymer compositing and advance application. Fuller Nanotub Carbon Nanostruct. 2017;25(2):109-123. https://doi.org/10.1080/1536383X.2016.1265513. [ Links ]
30. Bartelmess J, Giordani S. Carbon nano-onions (multi-layer fullerenes): chemistry and applications. Beilstein J Nanotechnol. 2014;5:1980-1998. https://doi.org/10.3762/bjnano.5.207. [ Links ]
31. Ewels CP, Glerup M. Nitrogen doping in carbon nanotubes. J Nanosci Nanotechnol. 2005;5(9):1345-1363. https://doi.org/10.1166/jnn.2005.304. [ Links ]
32. Yu D, Nagelli E, Du F, Dai L. Metal-free carbon nanomaterials become more active than metal catalysts and last longer. J Phys Chem Lett. 2010;1(14):2165-2173. https://doi.org/10.1021/jz100533t. [ Links ]
33. Gergeroglu H, Yildirim S, Ebeoglugil MF. Nano-carbons in biosensor applications: an overview of carbon nanotubes (CNTs) and fullerenes (C 60). SN Appl. Sci. 2020;2(4):603. https://doi.org/10.1007/s42452-020-2404-1. [ Links ]
34. Babar DG, Gupta NR, Nandi G, Sarkar S. Carbon nano onions-polystyrene composite for sensing S-containing amino acids. J. Conpos. Sci. 2020;4(3):90. https://doi.org/10.3390/jcs4030090. [ Links ]
35. Mohapatra J, Ananthoju B, Nair V, Mitra A, Bahadur D, Medhekar NV, Aslam M. Enzymatic and non-enzymatic electrochemical glucose sensor based on carbon nano-onions. Appl Surf Sci. 2018;442:332-341. https://doi.org/10.1016/j.apsusc.2018.02.124. [ Links ]
36. Olifant GE, Mavumengwana V, Hummelgen IA, Mamo MA. Understanding the sensing mechanism of carbon nanoparticles: MnO2-PVP composites sensors using in situ FTIR-online LCR meter in the detection of ethanol and methanol vapour. J Mater Sci Mater Electron. 2019;30(4):3552-3562. https://doi.org/10.1007/s10854-018-00633-x. [ Links ]
37. Hulanicki A, Glab S, Ingman F. Chemical sensors: definitions and classification. Pure Appl Chem. 1991;63(9):1247-1250. https://doi.org/10.1351/pac199163091247. [ Links ]
38. Yamazoe N. New approaches for improving semiconductor gas sensors. Sens Actuators B Chem. 1991;5(1-4):7-19. https://doi.org/10.1016/0925-4005(91)80213-4. [ Links ]
39. Yunusa Z, Hamidon MN, Kaiser A, Awang Z. Gas sensors: A review. Sens. Transducers. 2014;168:61-75. [ Links ]
40. Huang J, Wan Q. Gas sensors based on semiconducting metal oxide one-dimensional nanostructures. Sensors (Basel). 2009;9(12):9903-9924. https://doi.org/10.3390/s91209903. [ Links ]
41. Okechukwu VO, Mavumengwana V, Hummelgen IA, Mamo MA. Concomitant in situ FTIR and impedance measurements to address the 2-methylcyclopentanone vapor-sensing mechanism in MnO2-polymer nanocomposites. ACS omega. 2019;4(5):8324-8333. https://doi.org/10.1021/acsomega.8b03589. [ Links ]
42. Mohapatra D, Badrayyana S, Pant A, Parida S. In-situ synthesis and optical properties of CNO-ZnO nanocomposite. Mater Lett. 2016;183:56-60. https://doi.org/10.1016/j.matlet.2016.07.050. [ Links ]
43. Rydosz A. Sensors for enhanced detection of acetone as a potential tool for noninvasive diabetes monitoring. Sensors (Basel). 2018;18(7):2298. https://doi.org/10.3390/s18072298. [ Links ]
44. Tao YX, Kaviany M. Burning rate of liquid supplied through a wick. Combust Flame. 1991;86(1-2):47-61. https://doi.org/10.1016/0010-2180(91)90055-G. [ Links ]
45. Wiener J, Dejlova P. Wicking and wetting in textiles. AUTEX Res J. 2003;3:64-71. https://www.autexrj.org/No2-2003/0054.pdf. [ Links ]
46. Wang LC, He L, Liu Q, Liu YM, Chen M, Cao Y, He HY, Fan KN. Solvent-free selective oxidation of alcohols by molecular oxygen over gold nanoparticles supported on |3-MnO2 nanorods. Appl Catal A Gen. 2008;344(1-2):150-157. https://doi.org/10.1016/j.apcata.2008.04.013. [ Links ]
47. Chen W, Laiho S, Vaittinen O, Halonen L, Ortiz F, Forsblom C, Groop PH, Lehto M, Metsala M. Biochemical pathways of breath ammonia (NH3) generation in patients with end-stage renal disease undergoing hemodialysis. J Breath Res. 2016;10(3):036011. https://doi.org/10.1088/1752-7155/10/3/036011. [ Links ]
48. Welvaert M, Rosseel Y. The definition of signal-to-noise ratio and contrast-to- noise ratio for MRI data. PLoS One. 2013;8(11):e77089. https://doi.org/10.1371/journal.pone.0077089. [ Links ]
49. Janata J. Principles of chemical sensors. 2nd ed. Atlanta: Springer; 2009. https://doi.org/10.1007/b136378. [ Links ]
50. Grundler P. Chemical sensors: An introduction for scientists and engineers. Dresden: Springer; 2007. [ Links ]
51. Shrivastava A, Gupta V. Methods for the determination of limit of detection and limit of quantitation of the analytical methods. Chron. Young Sci. 2011;2(1):21-25. https://doi.org/10.4103/2229-5186.79345. [ Links ]
52. Rahman H, Rahman MM. Estimation of limit of detection (LoD), limit of quantification (LoQ) and machine standardization by gas chromatography, Ann. BangladeshAgric. 2015;19:55-65. [ Links ]
53. Mongwe TH, Matsoso BJ, Mutuma BK, Coville NJ, Maubane MS. Synthesis of chain-like carbon nano-onions by a flame assisted pyrolysis technique using different collecting plates. Diamond Related Materials. 2018;90:135-143. https://doi.org/10.1016/j.diamond.2018.10.002. [ Links ]
54. Panda A, Arumugasamy SK, Lee J, Son Y, Yun K, Venkateswarlu S, Yoon M. Chemical-free sustainable carbon nano-onion as a dual-mode sensor platform for noxious volatile organic compounds. Appl Surf Sci. 2021;537:147872. https://doi.org/10.1016/j.apsusc.2020.147872. [ Links ]
55. Dhand V, Prasad JS, Rao MV, Bharadwaj S, Anjaneyulu Y, Jain PK. Flame synthesis of carbon nano onions using liquefied petroleum gas without catalyst. Mater Sci Eng C. 2013;33(2):758-762. https://doi.org/10.1016/j.msec.2012.10.029. [ Links ]
56. Alessandro F, Scarcello A, Basantes Valverde MD, Coello Fiallos DC, Osman SM, Cupolillo A, Arias M, Arias de Fuentes O, De Luca G, Aloise A, et al. Selective synthesis of turbostratic polyhedral carbon nano-onions by arc discharge in water. Nanotechnology. 2018;29(32):325601. https://doi.org/10.1088/1361-6528/aac4ca. [ Links ]
57. Ozawa M, Goto H, Kusunoki M, Ósawa E. Continuously growing spiral carbon nanoparticles as the intermediates in the formation of fullerenes and nanoonions. J Phys Chem B. 2002;106(29):7135-7138. https://doi.org/10.1021/jp025639z. [ Links ]
58. Mordkovich VZ, Maezawa T, Takeuchi Y. Formation of various carbon nanoclusters from laser-produced carbon plasma. Fuller Nanotub Carbon Nanostruct. 2005;12(1-2):11-16. https://doi.org/10.1081/FST-120027126. [ Links ]
59. Reddy SS, Sinha AK, Amarendra G, Shekar NVC, Bhalerao GM.. Enhancement of graphitic order in carbon black using precursor additive. Diamond Related Materials. 2020;101:107539. https://doi.org/10.1016/j.diamond.2019.107539. [ Links ]
60. Gubarevich AV, Kitamura J, Usuba S, Yokoi H, Kakudate Y, Odawara O. Onion- like carbon deposition by plasma spraying of nanodiamonds. Carbon. 2003;41(13):2601-2606. https://doi.org/10.1016/S0008-6223(03)00338-5. [ Links ]
61. Lin Y, Pan X, Qi W, Zhang B, Su DS. Nitrogen-doped onion-like carbon: a novel and efficient metal-free catalyst for epoxidation reaction. J Mater Chem A Mater Energy Sustain. 2014;2(31):12475-12483. https://doi.org/10.1039/C4TA01611D. [ Links ]
62. Nemanich RJ, Solin SA. First- and second-order Raman scattering from finite-size crystals of graphite. Phys Rev B Condens Matter. 1979;20(2):392-401. https://doi.org/10.1103/PhysRevB.20.392. [ Links ]
63. Ferrari AC, Robertson . Resonant Raman spectroscopy of disordered, amorphous, and diamondlike carbon. Phys Rev B Condens Matter. 2001;64(7):075414. https://doi.org/10.1103/PhysRevB.64.075414. [ Links ]
64. Caneado LG, Jorio A, Ferreira EHM, Stavale F, Achete CA, Capaz RB, Moutinho MV, Lombardo A, Kulmala TS, Ferrari AC. Quantifying Defects in Graphene via Raman Spectroscopy at Different Excitation Energies. Nano Lett. 2011;11(8):3190-3196. https://doi.org/10.1021/nl201432g. [ Links ]
65. Jawhari T, Roid A, Casado J. Raman spectroscopic characterization of some commercially available carbon black materials. Carbon. 1995;33(11):1561-1565. https://doi.org/10.1016/0008-6223(95)00117-V. [ Links ]
66. Cuesta A, Dhamelincourt P, Laureyns J, Martínez-Alonso A, Tascón JMD. Raman microprobe studies on carbon materials. Carbon. 1994;32(8):1523-1532. https://doi.org/10.1016/0008-6223(94)90148-1. [ Links ]
67. Yoshikawa M, Katagiri G, Ishida H, Ishitani A, Akamatsu T. Raman spectra of diamondlike amorphous carbon films. J Appl Phys. 1988;64(11):6464-6468. https://doi.org/10.1063/L342063. [ Links ]
68. Nxumalo EN, Letsoalo PJ, Cele LM, Coville NJ. The influence of nitrogen sources on nitrogen-doped multi-walled carbon nanotubes. J Organomet Chem. 2010;695(24):2596-2602. https://doi.org/10.1016/j.jorganchem.2010.08.030. [ Links ]
69. Ma X, Wang E, Zhou W, Jefferson DA, Chen J, Deng S, Xu N, Yuan J. Polymerised carbon nanobells and their field emission properties. Appl Phys Lett. 1999;75(20):3105-3107. https://doi.org/10.1063/L125245. [ Links ]
70. Kurt R, Karimi A. Influence of nitrogen on the growth mechanism of decorated C:N nanotubes. ChemPhysChem. 2001;2(6):388-392. https://doi.org/10.1002/1439-7641(20010618)2:63.0.CO;2-O. [ Links ]
71. Dias FS, Tartuci LG, Gorgulho HF, Machado WS. H. de, F. Gorgulho, W.S. Machado, Characterization of a carbon xerogel-based sensor for detection of acetone, ethanol, and methanol vapors. Sens Actuators B Chem. 2016;231:440-449. https://doi.org/10.1016/j.snb.2016.03.054. [ Links ]
72. Matsoso BJ, Ranganathan K, Mutuma BK, Lerotholi T, Jones G, Coville NJ. Time-dependent evolution of the nitrogen configurations in N-doped graphene films. RSC Advances. 2016;6(108):106914-106920. https://doi.org/10.1039/C6RA24094A. [ Links ]
73. Lin Y, Pan X, Qi W, Zhang B, Su DS. Nitrogen-doped onion-like carbon: a novel and efficient metal-free catalyst for epoxidation reaction. J Mater Chem A Mater Energy Sustain. 2014;2(31):12475-12483. https://doi.org/10.1039/C4TA01611D. [ Links ]
74. Lesiak B, Jiricek P, Bieloshapka I. Chemical and structural properties of Pd nanoparticle-decorated graphene-electron spectroscopic methods and QUASES. Appl Surf Sci. 2017;404:300-309. https://doi.org/10.1016/j.apsusc.2017.01.183. [ Links ]
75. Karaman S, Karasu S, Tornuk F, Toker OS, Gecgel U, Sagdic O, Ozcan N, Gul O. Recovery potential of cold press byproducts obtained from the edible oil industry: physicochemical, bioactive, and antimicrobial properties. J Agric Food Chem. 2015;63(8):2305-2313. https://doi.org/10.1021/jf504390t. [ Links ]
76. Yuan C, Liu X, Jia M, Luo Z, Yao J. Facile preparation of N- and O-doped hollow carbon spheres derived from poly(o-phenylenediamine) for supercapacitors, J. Mater. Chem. A. 3 (2015) 3409-3415. https://doi/org/https://doi.org/10.1039/C4TA06411A. [ Links ]
77. Pimenta M, Dresselhaus G, Dresselhaus MS, Cancado L, Jorio A, Saito R. Studying disorder in graphite-based systems by Raman spectroscopy. Phys Chem Chem Phys. 2007;9(11):1276-1290. https://doi.org/10.1039/B613962K. [ Links ]
78. Wang L, Yu P, Zhao L, Tian C, Zhao D, Zhou W, Yin J, Wang R, Fu H. B and N isolate-doped graphitic carbon nanosheets from nitrogen-containing ion-exchanged resins for enhanced oxygen reduction. Sci Rep. 2015;4(1):5184. https://doi.org/10.1038/srep05184. [ Links ]
79. Han L, Zhang P, Li L, Lu S, Su B, An X, Lei Z. Nitrogen-containing carbon nano-onions-like and grapheme-like materials derived from biomass and the adsorption and visible photocatalytic performance. Appl Surf Sci. 2021;543:148752. https://doi.org/10.1016/j.apsusc.2020.148752. [ Links ]
80. Wang Z, Chen Y, Li P, Zhou J, He J, Zhang W, Guo Z, Li Y, Dong M. Modulation of N-bonding configurations and their influence on the electrical properties of nitrogen-doped graphene. RSC Advances. 2016;6(95):92682-92687. https://doi.org/10.1039/C6RA19278E. [ Links ]
81. Kang Y, Chu Z, Zhang D, Li G, Jiang Z, Cheng H, Li X. Incorporate boron and nitrogen into graphene to make BCN hybrid nanosheets with enhanced microwave absorbing properties. Carbon. 2013;61:200-208. https://doi.org/10.1016/j.carbon.2013.04.085. [ Links ]
82. Merel P, Tabbal M, Chaker M, Moisa S, Margot J. Direct evaluation of the sp3 content in diamond-like-carbon films by XPS. Appl Surf Sci. 1998;136(1-2):105-110. https://doi.org/10.1016/S0169-4332(98)00319-5. [ Links ]
83. A. Simo, K. Kaviyarasu, B. Mwakikunga, M. Mokwena, M. Maaza. Room temperature volatile organic compound gas sensor based on vanadium oxide 1-Dimension nanoparticles. Ceram. Int. 43(Part B) (2017) 13471353. https://doi.org/10.1016/jxeramint2016.10.09L [ Links ]
84. de Langen P, Juurlink B. Leakage-aware multiprocessor scheduling, J Sign Process Syst Sign Image Video Technol. 2009;57(1):73-88. https://doi.org/10.1007/s11265-008-0176-8. [ Links ]
85. Selim MM, El-Nabarawy TA. A general relationship between adsorption of hydrocarbons and their polarizabilities on activated carbon. Carbon. 1980;18(4):287-290. https://doi.org/10.1016/0008-6223(80)90053-6. [ Links ]
86. Choi J, Park DW, Shim SE. Chemical vapour sensing behaviors of multi-walled carbon nanotube adsorbed electrospun nylon 6,6 nanofibers. Macromol Res. 2011;19(9):980-983. https://doi.org/10.1007/s13233-011-0905-x. [ Links ]
87. Andersson H, Carlsson CC, Nekoueishahraki B, Brath U, Erdelyi M. Chapter two - Solvent effects on nitrogen chemical shifts. Annu Rep NMR Spectrosc. 2015;86:73-210. https://doi.org/10.1016/bs.arnmr.2015.04.002. [ Links ]
88. Arafat MM, Dinan B, Akbar SA, Haseeb ASMA. Gas sensors based on one dimensional nanostructured metal-oxides: a review. Sensors (Basel). 2012;12(6):7207-7258. https://doi.org/10.3390/s120607207. [ Links ]
89. Fine GF, Cavanagh LM, Afonja A, Binions R. Metal oxide semi-conductor gas sensors in environmental monitoring. Sensors (Basel). 2010;10(6):5469-5502. https://doi.org/10.3390/s100605469. [ Links ]
90. Simo A, Mwakikunga B, Sone BT, Julies B, Madjoe R, Maaza M. VO2 nanostructures based chemiresistors for low power energy consumption hydrogen sensing. Int J Hydrogen Energy. 2014;39(15):8147-8157. https://doi.org/10.1016/j.ijhydene.2014.03.037. [ Links ]
91. Zhang J, Liu X, Blume R, Zhang A, Schlogl R, Su DS. Surface-modified carbon nanotubes catalyze oxidative dehydrogenation of n-butane. Science. 2008;322(5898):73-77. https://doi.org/10.1126/science.1161916. [ Links ]
92. Zhao TJ, Sun WZ, Gu XY, Ronning M, Chen D, Dai YC, Yuan WK, Holmen A. Rational design of the carbon nanofiber catalysts for oxidative dehydrogenation of ethylbenzene. Appl Catal A Gen. 2007;323:135-146. https://doi.org/10.1016/j.apcata.2007.02.008. [ Links ]
93. Kannan PK, Saraswathi R, Rayappan JBB. CO2 gas sensing properties of DC reactive magnetron sputtered ZnO thin film. Ceram Int. 2014;40(8):13115-13122. https://doi.org/10.1016/j.ceramint.2014.05.011. [ Links ]
94. Madeira LM, Portela MF. Catalytic oxidative dehydrogenation of n-butane. Catal Rev, Sci Eng. 2002;44(2):247-286. https://doi.org/10.1081/CR-120001461. [ Links ]
95. Zhang Z, Huang K, Yuan F, Xie C. Gas sensing properties and in situ diffuse reflectance infrared Fourier transform spectroscopy study of formaldehyde adsorption and reactions on SnO2 films. J Mater Res. 2014;29(1):139-147. https://doi.org/10.1557/jmr.2013.300. [ Links ]
96. Zhang Z, Wen Z, Ye Z, Zhu L. Gas sensors based on ultrathin porous Co3O4 nanosheets to detect acetone at low temperature. RSC Advances. 2015;5(74):59976-59982. https://doi.org/10.1039/C5RA08536E. [ Links ]
97. Abokifa AA, Haddad K, Fortner J, Lo CS, Biswas P. Sensing mechanism of ethanol and acetone at room temperature by SnO2 nano-columns synthesized by aerosol routes: theoretical calculations compared to experimental results. J Mater Chem A Mater Energy Sustain. 2018;6(5):2053-2066. https://doi.org/10.1039/C7TA09535J. [ Links ]
98. Wang LC, Tang KT, Teng IJ, Kuo CT, Ho CL, Kuo HW, Su TH, Yang SR, Shi GN, Chang CP. A single-walled carbon nanotube network gas sensing device. Sensors (Basel). 2011;11(8):7763-7772. https://doi.org/10.3390/s110807763. [ Links ]
99. Huang J, Wan Q. Gas sensors based on semiconducting metal oxide one-dimensional nanostructures. Sensors (Basel). 2009;9(12):9903-9924. https://doi.org/10.3390/s91209903. [ Links ]
100. Barsan N, Weimar U. Conduction model of metal oxide gas sensors. J Electroceram. 2001;7(3):143-167. https://doi.org/10.1023/A:1014405811371. [ Links ]
101. Ji H, Zeng W, Li Y. Gas sensing mechanisms of metal oxide semiconductors: A focus review. Nanoscale. 2019;11(47):22664-22684. https://doi.org/10.1039/C9NR07699A. [ Links ]
102. Berna A. Metal oxide sensors for electronic noses and their application to food analysis. Sensors (Basel). 2010;10(4):3882-3910. https://doi.org/10.3390/s100403882. [ Links ]
103. Mutuma BK, Garcia-Martinez CI, Dias RC, Matsoso BJ, Coville NJ, Hümmelgen IA. Nitrogen-doped hollow carbon spheres as chemical vapour sensors. New J Chem. 2019;43(22):8418. https://doi.org/10.1039/C9NJ00628A. [ Links ]
104. Clément P, Hafaiedh I, Parra EJ, Thamri A, Guillot J, Abdelghani A, Llobet E. Iron oxide and oxygen plasma functionalized multi-walled carbon nanotubes for the discrimination of volatile organic compounds. Carbon. 2014;78:510-520. https://doi.org/10.1016/j.carbon.2014.07.032. [ Links ]
105. Khoshaman AH, Bahreyni B. Application of metal organic framework crystals for sensing of volatile organic gases. Sens Actuators B Chem. 2012;162(1):114-119. https://doi.org/10.1016/j.snb.2011.12.046. [ Links ]
106. Lala N, Thavasi V, Ramakrishna R. preparation of surface adsorbed and impregnated multi-walled carbon nanotube/nylon-6 nanofiber composites and investigation of their gas sensing ability. Sensors (Basel). 2009;9(1):86-101. https://doi.org/10.3390/s90100086. [ Links ]
Received 25 May 2021
Revised 26 November 2021
Accepted 26 November 2021
* To whom correspondence should be addressed: Email: manoko.maubane@wits.ac.za
Supplementary Data
The supplementary data is available in pdf: [Supplementary data]

