


Servicios Personalizados
Articulo
 Inglés (pdf)
 Articulo en XML
 Referencias del artículo
Indicadores

Links relacionados
-
 Citado por Google
 -
 Similares en Google
Compartir

 Permalink
South African Journal of Animal Science
versión On-line ISSN 2221-4062
versión impresa ISSN 0375-1589
S. Afr. j. anim. sci. vol.54 no.1 Pretoria 2024
http://dx.doi.org/10.4314/sajas.v54i1.06
Prediction of milk yield using visual images of cows through deep learning
L. JembereI; M. ChimonyoII,
IUniversity of KwaZulu-Natal, Scottsville, Pietermaritzburg, 3209, South Africa
IIUniversity of Venda, Thohoyandou, 0950, South Africa
ABSTRACT
The objective of the study was to determine, through deep learning, the predictability of milk yield from a cow's side-view, rear-view image, or a combination of the two. The data size of 1 238 image pairs (the side-view and rear-view images) from 743 Holstein cows in their first or second parity, and their corresponding first-lactation, 305-day milk yield values were used to train and test Deep Learning models. The data were first split into the training and testing data at a ratio of 80:20, respectively. The training data were augmented four times, then again divided into training and validation data at the ratio of 4:1, respectively. Three principal analyses were done, the prediction of milk yield using rear-view images, using side-view images, and using a merge of the side-view and rear-view images. In all three analyses, poor predictions were observed, i.e., R2 values ranging from 0.30 to 0.38, the mean absolute error ranging from 1112.9 kgs to 1148.3 kgs, the root mean square error values ranging from 1401.2 kg to 1480.5 kg, and the mean absolute error percentages ranging from 17.0 to 17.6%. Hypothesis tests were done to check whether there was any difference between these three prediction models. There was no significant difference in performance between the prediction models. It was concluded that predicting the 305-day milk yield of Holstein cows using either view had the same level of accuracy, and no additional benefits were derived from using both the rear and side views.
Keywords: combined-view images; computer vision; Holstein cows; linear conformation traits; rear-view images; side-view images; 305-day milk yield
Introduction
Dairy production plays a critical role in employment creation and food security. In South Africa, the dairy industry is the fifth largest agricultural sector and one of the highest employment creation sectors (Ogundeji et al., 2021). As an effect of COVID-19, dairy production costs have sharply increased over the two years, primarily due to maize and soya prices (FAO, 2021; Milk Producers Organization, 2020). Based on the FAO (2020) report, South Africa's milk production dropped by ~5% in 2019 (FAO, 2021). This has resulted in job losses and the need to cull low-producing cows to have a smaller herd of high-producing cows.
Now more than ever, dairy farmers desire to predict each cow's milk yield, especially when they are still heifers. Such predictions aid farmers in making better cow replacement and culling decisions, feeding information, mating decisions, financial planning, and detecting deviating yield patterns that may indicate mastitis. Farmers, however, cannot use techniques such as genomic selection, with higher prediction accuracy, on all the animals in the herd because of expense and availability of the service at national level. Farmers often resort to using linear-type traits correlated with milk yield to make milk yield predictions albeit laborious, time-consuming, and requiring some level of expertise. Linear type traits (LTT) or conformation traits are objective descriptions of an animal's body, udder, and leg conformation (Harris, 2015). The weighting of traits in the selection indices when using linear-type traits is dependent on the literature used, as it varies widely. The question then is, can computer vision deep learning be deployed as a prediction tool for milk yield using linear type traits? Deep learning allows the machine to compute and assign necessary weights to the traits for prediction, making the prediction analysis easier and less laborious.
Deep learning is a machine learning method based on artificial neural networks (ANN) with representation learning (Hordri et al., 2017). Representation learning is when the machine is supplied with data, and it learns the representation by itself. Convolutional neural networks (CNN) used in deep learning allow the use of visual data for prediction; this is called computer vision deep learning. A convolutional neural network is a subcategory of an ANN composed of numerous building blocks, such as convolution layers, pooling layers, and fully-connected layers (Patil & Rane, 2021). Convolutional neural networks can automatically extract features on an image, learn to associate each feature with another, and the whole image can be used to assign outputs and make predictions.
Various linear type traits are correlated with milk yield (MY), e.g., angularity (ANG), rump width (RW), and most udder traits (Campos et al., 2015; Harris, 2015; Khan & Khan, 2016). Since these traits can be seen earlier in a cow's life, they are often used to predict milk yield and quality. The variability in the results of these correlations is liberal. For example, Campos et al. (2015) found a phenotypic correlation of 0.19 between rear udder width and milk yield, whereas Khan & Khan (2016) found the correlation between milk yield and rear udder width to be 0.54. Such variability can be bewildering in making predictions, especially when establishing trait weights in selection indices. Khan & Khan (2016) imputed the variations to differences in visual judgment. Therefore, it is important to consider using computer vision deep learning as a predictive tool as the prediction analysis will be automated and standardized such that biases due to differences in human judgement will be minimized.
Linear-type traits are visible and can be seen earlier in a cow's life, making them salient indicators of production traits with which they are correlated. The side and rear views of cows can provide images of the udder, rump, and angularity. Unlike other prediction methods such as genomic selection, taking images does not require special skills or expert knowledge. The images can easily be taken using a cellphone, making milk yield prediction easy and convenient.
The use of computer vision deep learning to predict milk yield is currently low, although it has a huge potential to be used (Ozkaya, 2015). The major challenge with using computer vision deep learning for predicting milk yield is that it does not directly report the specific features used to make predictions and the weights assigned to each feature. There may be a need for feature silencing to get more specified information on the actual traits used for prediction and their contribution to the prediction process. Capturing all the features necessary for milk predictions in one picture may be challenging.
The broad objective of the study was to determine, through deep learning, the predictability of milk yield from a cow's image data. The specific objectives were to:
1. Determine the predictability of 305-day milk yield using a cow's rear-view image
2. Determine the predictability of 305-day milk yield using a cow's side-view image
3. Determine the predictability of 305-day milk yield using a combination of a cow's side-view and rear-view image
Materials and Methods
All the cows used for this research were reared under a pasture-based system. They were all milked twice a day. The first milking commenced either at 0300h or 0400h and the last milking either at 1400h or 1500h, depending on the farm.
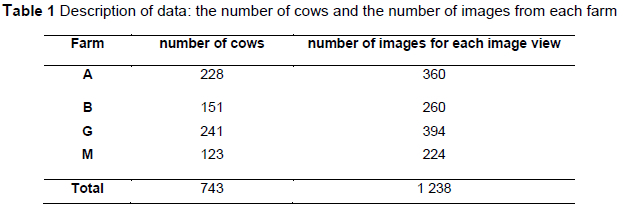
There is no rule of thumb on the minimum required sample size, especially when dealing with continuous variables for Deep Learning. Many factors influence this decision, e.g., complexity of the algorithm or the complexity of the problem (Blatchford et al., 2021). For this research, a data size of 2 476 images were used (both side-view and rear-view): 1 238 images for each image view. Three hundred sixty image pairs were from farm A, 260 pairs were from farm B, 394 pairs were from farm G, and 224 pairs were from farm M. Some of the photos were of the same cow but viewed differently; therefore, all the pictures were different. The actual number of cows used in the analysis was 743: 228 from farm A, 151 from farm B, 241 from farm G, and 123 from farm M. Table 1 summarises the number of cows and the number of images used from each farm.
The data consisted of cows' rear-view images, side-view images, and the cows' corresponding 305-day milk yield values from the first lactation. The pictures taken were of cows within their first or second lactation. These were the cows born between 2017, 2018, and early 2019. Milk yield data was prospective for cows within their first lactation, yet retrospective for cows within their second lactation. Milk yield prediction is pertinent earlier in a cow's life, hence the use of first lactation milk yield. Photos were from cows with body condition scores (BCS) of 3.25-3.75. The BCS range was selected to filter out the most malnourished, over-conditioned, and diseased cows. The images were taken from cows in various days-in-milk, irrespective of the lactation stage. Image capturing was done between 07:00 and 18:00. This means that the images included cows in different phases with respect to hours before or after milking. This was done to randomize the fullness of the udder with milk as it differs widely on one cow in a day depending on whether it has been milked.
The desired rear-view features were rump width and rear udder depth, height, and width. From the side-view, the desired features were angularity and udder depth. The cow images were taken as the cows were in the pastures. This was because there was minimal interference from the farm operations when the cows were in the fields, and the cows were more relaxed, making it easier to take pictures. The distance between the photographer and the cow varied from one picture to another. This was done to create a model that works regardless of the cow's distance from the photographer. Since the images were not captured in the chronology of the cow IDs, cow IDs were written down in the order of photo capturing. At least two images in every ten images taken showed the cow's ID to make sure the order in the book was synchronised with the order of the images.
Data pre-processing involved image renaming, image editing, elimination of images of cows that were out of range, the preparation of CSV files with image names and their corresponding milk yield values and finally, augmentation of only the training and validation images. The first step was to rename the images from the autogenerated image name to the identity of the cow in the picture. Since each cow had a side-view and rear-view image, each image name contained either an S for side-view or an R for rear-view at the end of the ID. A letter was put at the beginning of the ID to delineate images from different farms. For example, image G18123S would be a side-view image (signified by S) of the cow 18123 from Glen-herd farm (denoted by G). Some cows had more than one image for the same view. The iterations would be denoted by "(X)" after the image name: where X is the iteration number. For example, "G18123S (2)" would be the second side-view image of the cow 18123 from Glen-herd.
Some images contained more than one cow, which could interfere with the prediction analysis. Cows appearing in the background were shaded out, leaving just one cow in each image. The edited images from all four farms were then put into one computer folder. The names of each image were then extracted and put on a CSV spreadsheet. The spreadsheet contained three columns, one for the side view images, another for the rear-view images, and the last one for the 305-day milk yield records for each cow.
Twenty percent of the data were randomly extracted and pasted onto a separate CSV spreadsheet from the initial CSV file to make the testing data. The initial CSV file remained with 80% of the data, constituting the training and validation (TV) data. The TV images were augmented using the training and validation CSV information to generate more samples for analysis and reduce overfitting. It is salient to note that the testing data, different from the validation data, was not augmented. This was so that none of the permutated images from the TV samples reappeared in the test data, resulting in the model falsely performing well during model testing. However, an analysis was done where all the data was augmented, then the test data, constituting 20% of all the data created, was randomly drawn.
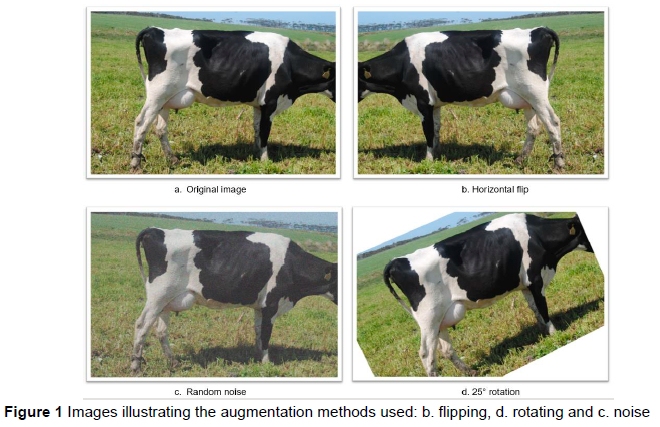
Data augmentation is the artificial generation of extra training data from the available ones (O'Mahony et al., 2020), thereby increasing the generalization ability of the model and reducing overfitting. There are various augmentation types, i.e., flipping, stretching, rotation, scaling, shearing, padding, cropping, and adding Gaussian noises. Not all augmentation types are best for every case. For example, this study deals with measurement traits, and augmentation techniques that distort image proportions or shapes, e.g. shear and stretching, reduce the data quality and prediction accuracy. The augmentation methods included in this study were random noise, 25-degree random rotation either to the left or the right and a horizontal flip. Figure 1 show illustrations of the three augmentation types used in this study.
Four random selections from these three augmentation methods were used for each picture. This means that one of the three augmentation methods was reused. However, it did not produce the same image as one out of the four augmented images would be a combination of two augmentations. For each original image used, there were five permutations, i.e., the original image plus four augmented images.
The images that were created after image augmentation had unique identifiers. Firstly, they all had an underscore at the beginning of the image name to sequentially separate them from the unaugmented images. Since there were four augmentations, each augmented image had an aug_1 to aug_4 written at the end of the actual image name. For example, the second augmentation of the image G18123R had the image name "_G18123R_aug_2".
The augmented file names and their corresponding milk yields were then annexed to the rows on the TV CSV spreadsheet. The spreadsheet now contained both the TV augmented data and TV unaugmented data. The validation data was a randomly selected 20% of the TV sample after augmentation. Random splitting of the validation data from the training data was put on the model command after importing the TV CSV file into the model. Therefore, two CSV files were imported into each model but there were three data splits; training, validation, and testing data. All the split ratios used in this research were based on a recommendation by Majurski (2019).
Data analyses was divided into hyperparameter optimisation and the actual tests using the optimal parameters. Hyperparameter optimisation is the process of establishing a set of optimal hyperparameters for a learning algorithm in machine learning. A hyperparameter is a parameter whose value regulates the learning process. The grid search hyperparameter tuning method was used to establish the optimum parameters for each model. The following parameters were examined, the best learning rate, whether to use a learning rate decay, whether to use dropouts, and the optimum number of epochs. Due to lower Central Processing Unit memory, the batch size could not be raised above 32. Therefore, the batch size for all the trials was kept at 32.
Batch size is the number of needed samples before the model is updated during model training. Batch size's significant impact is on training time and not on performance (Kandel & Castelli, 2020). The larger the batch size, the faster the computation. A learning rate decay/schedule is a predefined structure that regulates the learning rate between epochs or iterations as the learning progresses. The number of epochs is the number of complete passes on all the training data. Dropout is when some features on the image are randomly left out during model training.
Hyperparameter optimisation and the actual tests were done for three models: prediction of milk yield using rear-view only; MY prediction using side-view images only, and milk yield prediction using both side-view and rear-view images. All the analyses were carried out using the Xception pre-trained deep learning network (Chollet, 2017). A pre-trained network is a saved network that, previously, was trained on a large-scale task with a large data set. These networks are used for novel tasks through transfer learning, a process where some layers on the network are altered to suit a specific task but keeping the integrity of the network. For example, in this study, the loss function for the Xception network was changed to mean absolute error because the network was being used for a regression task. Due to inadequate graphics processing unit (GPU) space, the models were trained on a Central Processing Unit (CPU) allocator.
The images and their corresponding milk yield values were called onto the model through the CSV files. The model using the rear-view images used only two columns from the CSV files, the milk yield column and the rear-view image name column, the model using the side-view images used only the milk yield and the side-view columns, and the model using a combination of the two image views used all three columns on the CSV spreadsheet.
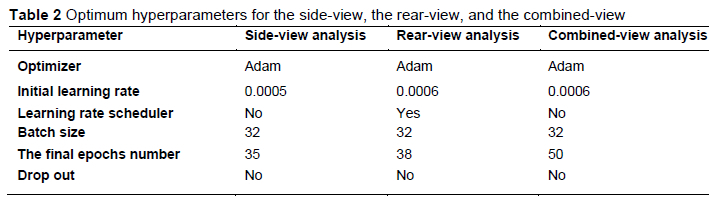
The best number of epochs was 35 for the side-view, 38 for the rear-view and 50 for the combined-view. For all the pieces of training, no dropouts were included, and the Adam optimizer was used. An optimizer is an algorithm or method used to change the attributes, such as the weights assigned to image features, of a deep learning model in order to reduce the losses. The Adam optimizer is the best optimizer for image processing problems. A learning rate schedule was used for the rear-view only, with the initial learning rate being 0.0006 for all training. The side-view and the integrated view had no learning rate decay, and their learning rates were 0.0005 and 0.0006, respectively. Table 2 shows the optimum parameters used for the side, the rear images, and a combination of the two.
The Root Mean Square Error (RMSE), mean absolute error (MAE), and coefficient of determination (R2) values were used to evaluate and update trait weights. The same statistical tools, plus the root mean square error (RMSE) and the mean absolute percentage error (MAPE), were used to report the research findings from the testing data. Of these measures, a good predictive model should have a value close to 0 for RMSE, MAE, and MAPE and a value close to 1 for the R2. For the R2 values, the cut-off points were: 0.00-0.10 = negligible correlation; 0.10-0.39 = weak correlation; 0.40-0.69 = moderate correlation; 0.70-0.89 = strong correlation, and 0.90-1.00 = very strong correlation (Schober & Schwarte, 2018). The following are the equations for each of these evaluation techniques:
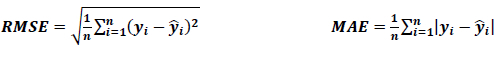
where, for the ith record:
y = observed value
y = predicted value
N =total number of data points
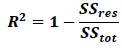
where the sum of squared residual has the following formula:
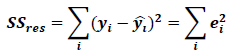
and the sum of squared total has the following formula:
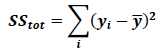
For the ith value of the SSres and SStot:
y = observed values
y = predicted value
e residuals = y, - y,
y = mean of the observed data:
Results and discussion
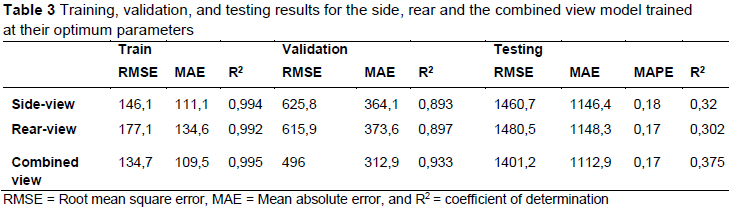
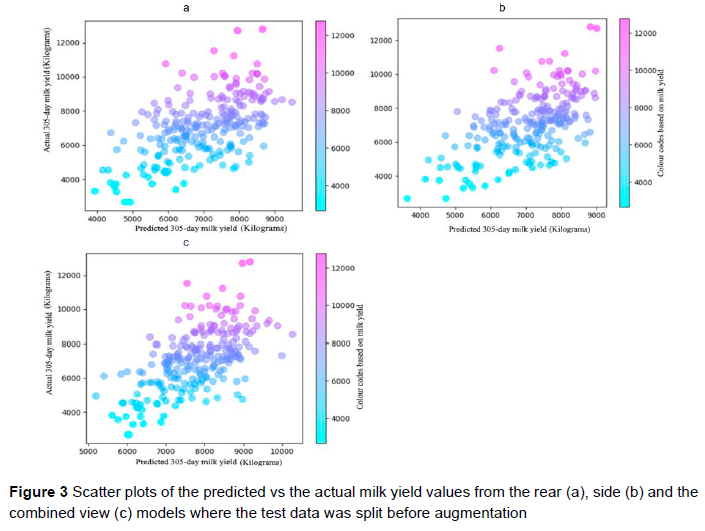
Table 3 shows the training, validation, and testing results for the side, rear and combined view models trained at their optimum parameters. The side-view model had a root mean square errors of 146.1 kg, 625.8 kg, and 1460.7 kg for the model training, validation, and testing, respectively. The mean absolute error was 111.1 kg for the model training, 364.1 kilograms for the validation, and 1146.4 kg for the testing. For the side-view model training, validation, and testing, the R2 values were 0.99, 0.89, and 0.32, respectively. The mean absolute percentage error was 0.18%.
The root mean square errors for the training, validation and testing were 177.1, 615.9 and 1480.5, respectively. The mean absolute errors were 134.6 kg for the model training, 373.6 for the validation, and 1149.3 for the testing. The R2 was as high as 0.99 for the model training and 0.90 for the validation, then drastically dropped to 0.30 for the testing. The mean absolute percentage error was only measured for the test data and was 0.17%.
The combined-view model had an RMSE, MAE, and R2 of 134.7, 109.5, and 1.00, respectively, for the training. For the model validation, the RMSE, MAE, and R2 were 496.0, 312.9 and 0.93, respectively. The test data had RMSE, MAE, MAPE, and R2 values of 1401.2, 1112.9, 0.17 and 0.38, respectively.
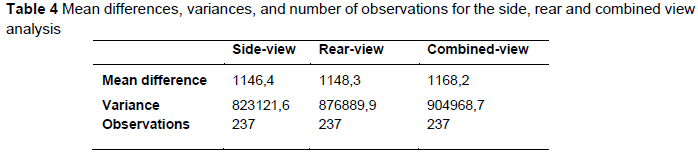
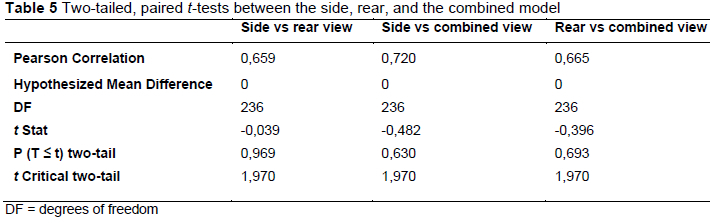
Three hypotheses were then tested, i.e., milk yield prediction is the same when using either the side-view or the rear-view images of cows, milk yield prediction is the same when using either the combined-view or only the rear-view images of cows, and milk yield prediction is the same when using either the combined-view or only the side-view images of cows. The two-tailed, paired t-test was used at a 95% significance level for all the tests. Table 4 shows the mean, variance, and the number of observations for the side, rear and combined view test data used for the t-test. The mean difference between the observed and predicted values was 1146.4 for the side-view, 1148.3 for the rear-view and 1168.2 for the combined view. Table 5 shows the comparison between the side and the rear-view model, side and combined view model, and rear and combined view model. There was no difference in performance between all the models compared in table 5 (P >0.05).
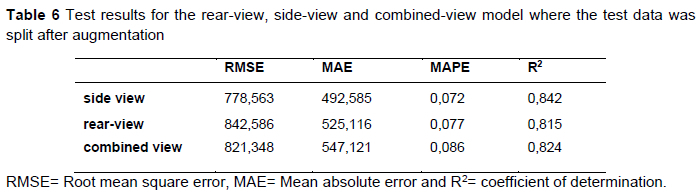
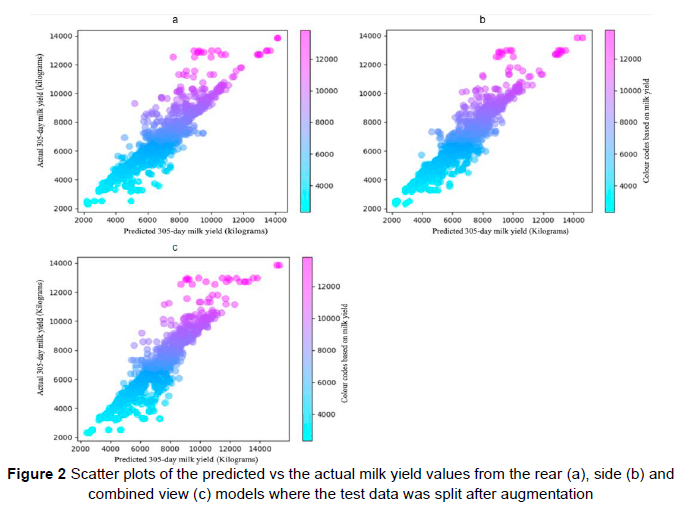
Tests were done to establish the effect of splitting the test data after augmentation. All the other parameters used in training and validating the models and the data split ratios were the same as in the tests where the test data was split before augmentation. The results of splitting the testing data after augmentation are shown in Table 6. For the rear-view, the model had an RMSE of 842.6 kg, an MAE of 525.1 kg, an MAPE of 0.08 and an R2 of 0.82 on the test data. The RMSE, MAE, MAPE and R2 were 778.6, 492.6, 0.07 and 0.84, respectively, for the side-view model. For the combined-view model, the values were 821.3, 547.1, 0.09 and 0.82 for the RMSE, MAE, MAPE, and R2, respectively.
Figure 2 shows scatter plots from the models where the test data was only split after augmentation and Figure 3 shows models where the test set was split before augmentation. The y-axis represents actual milk yield values and is colour-coded from light blue to purple. Light blue dots indicate cows with the lowest milk yield, and purple dots indicate cows with the highest milk yield. The x-axis shows the predicted milk yield.
The performance of the established model for the prediction of milk yield from the cows' rear-view images drastically dropped on the testing data compared to the validation. The drop in performance was most likely due to validation done on the augmented data. This drastically escalates the validation results, albeit making the model invariant to image rotations, colour changes or where the cow is facing in the image.
Ozkaya (2015) predicted milk yield using rear udder images and reported a coefficient of determination of 0.66. The differences in performance from Ozkaya's study can be attributed to the non-standardization of factors such as the milking time, cow's standing posture, camera pixel resolution, illumination conditions, camera location and settings, and distance from the cows in this study. The aim of not standardizing these factors was to create a model that was invariant to changes in factors such as how full the udder is with milk, the cow's standing posture, camera resolution, illumination in the environment, and distance of the cow from the camera. This, however, came at a cost, i.e., reduction in performance.
Ozkaya's analysis process was more supervised compared to this study. In the current study, the features extracted from the image and the trait weights were unknown. This suggests that some level of supervised learning may be necessary to give better predictions of milk yield from image data with the same data size.
The rear-view model was also lower than other models that used linear type traits to predict milk yield, such as the ones used by Yakubu (2011) with an R2 of 0.69 when all conformation traits evaluated were considered and Gocheva-ilieva & Yordanova (2022) with an R2 ranging from 0.93 to 0.95 when all assessed traits were considered. These studies used a wider range of linear type traits and not just traits seen from the posterior of the cow. Gocheva-Ilieva & Yordanova (2022) considered other factors that were not conformation traits, i.e. lameness, the farm, and locomotion (Gocheva-Ilieva & Yordanova, 2022) which, in turn, improved the performance of the regression. Yakubu (2011) used heart girth, fore right teat length, fore left teat length, rear right teat length, rear left teat length, udder circumference and udder height, and Gocheva-Ilieva & Yordanova (2022) used stature, chest width, rump width, rear legs (rear-view), rear leg set (side-view), hock development, bone structure, foot angle, foot depth, and udder width to predict milk yield. Therefore, there is a need to incorporate more conformation traits in the study, not just those viewed from the posterior.
The accuracy of milk yield prediction from traits viewed from the side of a cow discovered in this research was generally low. As much as various research points out the correlation between some traits seen from the side of a cow, such as angularity and stature, there are few pieces of research, if any, addressing the predictability of milk yield based only on these traits. The poor performance can be imputed to either the absence of traits that adequately explain milk yield variability or the method of prediction used (computer vision deep learning) and the training data size. Again, there was a drop in performance from validation to testing which resulted from the validation being done on data containing augmented images and the model testing done on real, unaugmented images.
Even though using both the side-view and the rear-view images to make MY predictions was expected to improve the prediction performance due to more conformation traits being considered, this did not confer substantial improvement in performance. The insignificant performance improvement after considering all traits is likely due to correlations between the side-view and the rear-view traits. This means that the poor performance when only one image view was considered was not because of inadequate traits to explain variability in milk yield. The only commendable explanation for the poor performance is that, currently, computer vision deep learning gives poor milk yield prediction.
The applicability of this method of milk yield prediction is not limited to Holstein cows only. It extends to other dairy breeds such as Jersey, Ayrshire, Guernsey, Brown Swiss, and Shorthorn. Deep learning models specific to these breeds can be made.
There was no difference in performance between the side-view and the rear-view model (p >0.05). This means the weight of side-view traits as gestalt in explaining variability in MY is the same as the rear-view traits weight. In other words, the side-view image is as essential as the rear-view in explaining variability in milk yield.
When the test data was split after augmentation, the models performed exceptionally better than the one where the test data was split before augmentation. The better performance was because the model's test cases were not entirely new. Even though data augmentation improves learning by artificially increasing the sample size and training the model to be invariant to changes such as rotation, colour, and the direction the cow is facing on the image, it cannot be used for the testing data as some of the images are not entirely novel for the model.
For all analyses, predictions were poorer for very high-producing cows, i.e. MY > 10000 kg (refer to the scatter plots). This could have been because of a limited number of cows within this range for proper model learning or because there is little trait difference between high-producing and very high-producing cows. Other factors besides linear conformation traits may be impelling a cow to move from high milk production to very high milk production. These could be factors such as management, feed quality and availability and other genetic factors, such as feed conversion efficiency.
Conclusions
Predicting the 305-day milk yield of Holstein cows using either the side or the rear-view has the same level of accuracy. No additional benefits are derived from using a combination of the rear and the side view images. The predictions are, however, weak for all image views, i.e., the rear-view, the side-view, and a combination of the rear-view and the side-view. The 305-day milk yield prediction was poorer for cows producing milk above ten thousand kilograms. It is recommended that certain aspects of the images be standardized to maximize prediction performance through image data, i.e. cow distance from the camera, cow postures, udder fullness and environmental illumination. This, however, will narrow down the types of images from which milk yield prediction can be made.
Acknowledgments
National Research Foundation funded the study (Ref no. MND200707541421 ). The author acknowledges Bloekolaan Dairy Farm, Glen Herd Dairy, Sand Water, and Milagro Farm for providing the data used in this research.
Authors' contributions
LJ collected the data for this study, conducted the statistical analyses and collaborated in the interpretation of the results and wrote the initial draft of this manuscript; MC collaborated in interpreting the results, supervised, and finalized the manuscript. Both authors have read and approved the finalized manuscript.
References
Blatchford, M. L., Mannaerts, C. M., & Zeng, Y., 2021. Determining representative sample size for validation of continuous, large continental remote sensing data. Int J Appl Earth Obs Geoinf, 94, 102235. https://doi.org/10.1016/j.jag.2020.102235. [ Links ]
Campos, R. V., Cobuci, J. A., Kern, E. L., Costa, C. N., & McManus, C. M., 2015. Genetic parameters for linear type traits and milk, fat, and protein production in Holstein cows in Brazil. Asian-Austral J Anim Sci. 28(4), 476-484. https://doi.org/10.5713/ajas.14.0288. [ Links ]
Chollet, F. pis., 2017. Xception: Deep Learning with depthwise separable convolutions. Google, Inc. Doi:10.48550/arXiv.1610.02357 [ Links ]
FAO, 2021. Dairy market review, food, and agriculture organisation of the United Nations. food and agriculture organization of the United Nations, April, 1-13. Retrieved February 4, 2022 from the FAO website https://www.fao.org/3/cb4230en/cb4230en.pdf. [ Links ]
Gocheva-Ilieva, S., Yordanova, A., 2022. Predicting the 305-day milk yield of Holstein-Friesian cows depending on the conformation traits and farm using Simplified Selective Ensembles. Mathematics. https://doi.org/10.3390/math10081254_Academic. [ Links ]
Harris, R., 2015. Phenotypic correlations between linear type conformation traits, production and fertility in a once-a-day milked dairy cattle herd: A thesis presented in partial fulfillment. http://mro.massey.ac.nz/handle/10179/7430. [ Links ]
Hordri, N. F., Samar, A., Yuhaniz, S. S., & Shamsuddin, S. M., 2017. A systematic literature review on features of deep learning in big data analytics. Int. J. Adv. Soft Comp. Appl. 9(1), 32-49. Retrieved 20 August, 2021 from the Academia website: https://www.academia.edu/33049709/A_Systematic_Literature_Review_on_Features_of_Deep_Learning_in_Big_Data_Analytics. [ Links ]
ICAR, 2015. Conformation Recording of Dairy Cattle. June, pp. 1-42. https://www.icar.org/wp-content/uploads/2015/08/Conformation-Recording-CR-WG.pdf. [ Links ]
Kandel, I., & Castelli, M., 2020. The effect of batch size on the generalizability of the convolutional neural networks on a histopathology dataset. ICT Express, 6(4), 312-315. https://doi.org/10.1016/j.icte.2020.04.010. [ Links ]
Khan, M. S. M. A., Khan, M. S. M. A., 2016. Genetic and phenotypic correlations between linear type traits and milk yield in Sahiwal cows. Pak J Agric Sci, 53(2), 483-489. https://doi.org/10.21162/PAKJAS/16.3369. [ Links ]
Majurski, M., 2019. Small Data Deep Learning : AI Applied to domain datasets. Retrieved 21 August 2021 from the National Institute of Standards and Technology website: https://www.nist.gov/system/files/documents/2019/08/27/workshopslides-small_data_convnets.pdf. [ Links ]
Milk Producers Organization. (2020). Dairy Market Trends, May 2020 Executive. TAPPI Journal, 19(5). https://doi.org/10.32964/tj19.5. [ Links ]
O'Mahony, N., Campbell, S., Carvalho, A., Harapanahalli, S., Hernandez, G. V., Krpalkova, L., Riordan, D., & Walsh, J., 2020. Deep Learning vs. traditional Computer Vision. Advances in Intelligent Systems and Computing, 943(Cv), 128-144. https://doi.org/10.1007/978-3-030-17795-9_10. [ Links ]
Ozkaya, S., 2015. Prediction possibility of milk yield from udder measurements using digital image analysis on Holstein cows. Indian J. Anim. Res. 49(3), 388-391. https://doi.org/10.5958/0976-0555.2015.00050.3. [ Links ]
Patil, A., & Rane, M., 2021. Convolutional Neural Networks: An overview and its applications in pattern recognition. smart innovation, systems, and technologies. 195, 21-30. https://doi.org/10.1007/978-981-15-7078-0_3. [ Links ]
Schober, P., & Schwarte, L. A., 2018. Correlation coefficients: Appropriate use and interpretation. Anesthesia and Analgesia. 126(5), 1763-1768. https://doi.org/10.1213/ANE.0000000000002864. [ Links ]
Yakubu, A. (2011 ). Path analysis of conformation traits and milk yield of Bunaji cows in smallholder herds in Nigeria. Agricultura Tropica et Subtropica, 44(3), 152-157. [ Links ]
Zink, V., Zavadilová, L., Lassen, J., Stípková, M., Vacek, M., & Stolc, L., 2014. Analyses of genetic relationships between linear type traits, fat-to-protein ratio, milk production traits, and somatic cell count in first-parity Czech Holstein cows. Czech J Anim. Sic. 59(12), 539-547. https://doi.org/10.17221/7793-cjas. [ Links ]
Submitted 20 February 2023
Accepted 29 June 2023
Published 26 March 2024
# Corresponding author: Michael.Chimonyo@univen.ac.za

