



Services on Demand
Journal

Article
 English (pdf)
 Article in xml format
 Article references

 Automatic translation
 Send this article by e-mail
Indicators
Related links
-
 Cited by Google
-
 Similars in Google
Share

 Permalink

Journal of the South African Institution of Civil Engineering
On-line version ISSN 2309-8775Print version ISSN 1021-2019
J. S. Afr. Inst. Civ. Eng. vol.66 n.4 Midrand Dec. 2024
https://doi.org/10.17159/2309-8775/2024/v66n4a3
TECHNICAL PAPER
Estimation of Areal Reduction Factors in South Africa, Part 1: Development and evaluation of a software interface
J P J Pietersen; O J Gericke; J C Smithers
ABSTRACT
Areal Reduction Factors (ARFs) are used to convert average design point rainfall depths to an areal (catchment) design rainfall depth to serve as primary input to estimate the design flood associated with a specific storm duration and return period. This paper presents the development and critical evaluation of a stand-alone software interface to estimate regional, geographically-centred ARFs using the methodology developed by Pietersen (2023). By considering standard input variables in a range of catchment areas, the application of the ARF software demonstrated that it is an easy-to-use software tool for the rapid estimation of ARFs in both gauged and ungauged catchments, and with the aid of the default and combined algorithm, geographically-centred ARFs which vary with return period can be estimated. Given that the other geographically-centred ARF methods reviewed in this paper do not take return periods into account and have not been validated using local and up-to-date rainfall data applicable throughout South Africa (SA), it is recommended that the ARF software be incorporated as the standard estimation procedure for long duration (> 24-hour), geographically-centred ARFs in SA. In addition, the proposed methodology and ARF software should also be further validated for short (< 24-hour) and long (> 24-hour) durations by applying it to actual catchments distributed throughout SA and subjected to different rainfall-producing mechanisms.
Keywords: Areal Reduction Factors, ARF software, design rainfall, floods, geographically-centred
INTRODUCTION
In deterministic event-based Design Flood Estimation (DFE) methods, Areal Reduction Factors (ARFs) are used to convert average design point rainfall depths to an areal (catchment) design rainfall depth to serve as primary input to estimate the design flood associated with a specific storm duration and return period (Alexander 2001). Geographically-centred or storm-centred empirical methods, analytical methods, or radar data can be used to estimate ARFs (Svensson & Jones 2010; Pietersen et al 2023). The geographically-centred approach describes the ratio between areal design and average design point rainfall of the same return period and record length (Bell 1976), while the storm-centred ARFs are not bound by a fixed geographical area, but rather reflect the extent of individual storm events of variable rainfall intensity (Pietersen et al 2015).
Extensive national-scale ARF studies are limited to the United States of America (USWB 1957; 1958), United Kingdom (Faulkner 1999), Australia (Siriwardena & Weinmann 1996; Jordan et al 2013; Podger et al 2015a; 2015b), Austria (Breinl et al 2020) and South Africa (Pietersen 2023; Pietersen et al 2023). Apart from these national-scale studies, numerous pilot-scale studies were also conducted internationally. In South Africa the pilot-scale ARF studies, which are all regarded as being limited to specific temporal and spatial scales and not accounting for any regional differences, are limited to the storm-centred approaches of Van Wyk (1965) and Wiederhold (1969), and the geographically-centred approaches of Alexander (1980; 2001). Recently, Pietersen (2023) developed a regionalised approach to estimate long-duration (> 24-hour), geographically-centred ARFs using daily rainfall data representative of the 78 homogeneous long-duration rainfall clusters associated with the Regional Linear Moment Algorithm and Scale Invariance (RLMA&SI) regionalisation scheme in South Africa (Smithers & Schulze 2004). The sample ARFs were estimated using 2 053 circular catchments and 1 779 daily rainfall stations distributed throughout South Africa. Five ARF regions were deduced from the rainfall clusters and a single regional empirical ARF equation, with unique regional calibration coefficients, was derived. In contrast to other ARF methods used in South Africa, e.g. Wiederhold (1969) and Alexander (2001), the ARF method proposed by Pietersen (2023) varies with return period. Furthermore, the storm-centred approaches of Van Wyk (1965) and Wiederhold (1969) are mainly regarded as graphical procedures, as shown in Figures 1and 2, respectively.
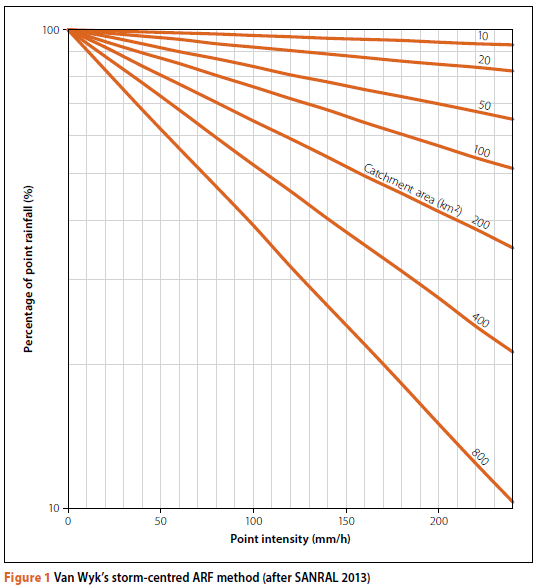
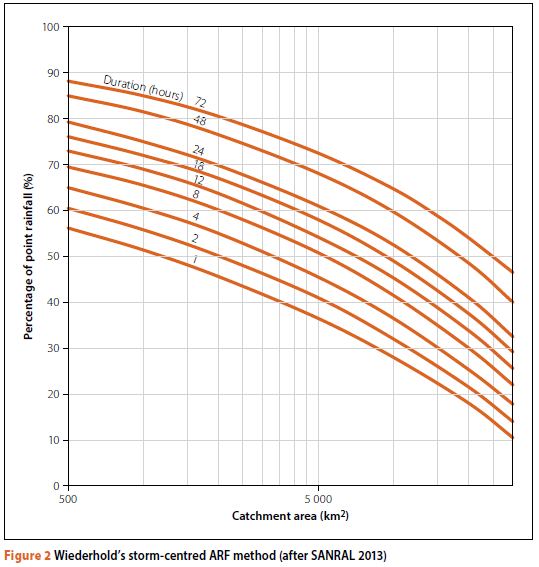
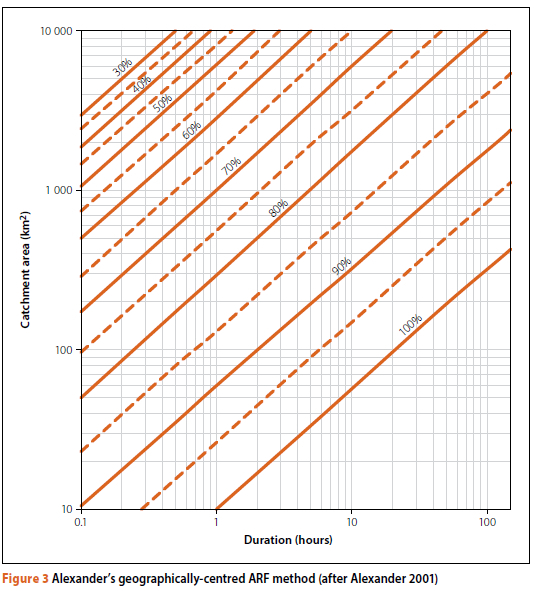
Apart from being regarded as graphical procedures, these storm-centred ARF approaches (Figures 1and 2) are currently also incorrectly applied by practitioners in a geographically-centred manner, i.e. the variable location storm-centred ARFs which reflect the extent of individual storm events of variable rainfall intensity, are applied to a geographically fixed catchment area where the average design point rainfall is estimated from point rainfall statistics. During the period 1980 to 2001, Alexander (1980; 2001) transposed and developed local ARF diagrams from the UK Flood Study Report (FSR) ARF diagrams as initially developed and proposed by the Centre for Ecology and Hydrology (CEH) (NERC 1975; Faulkner 1999). Apart from also being regarded as a graphical procedure (cf Figure 3, limited local rainfall data was used during the calibration and verification thereof in South Africa, while the ARF estimates remain constant for all return periods. Various attempts were made by Op Ten Noort and Stephenson (1982) to convert the graphical procedures of Van Wyk (1965), Wiederhold (1969) and Alexander (1980) to numerical equations. However, these equations have not been widely adopted in practice and the ARF diagrams as shown in Figures 1 to 3 are still included in the South African National Road Agency Limited (SANRAL) Drainage Manual (SANRAL 2013), which is regarded as an authoritative text on DFE in South Africa.
Given the occurrence and frequency of flood events, along with the uncertainty involved in the estimation thereof, it is necessary to provide practitioners with an appropriate software application to replace the current graphical ARF estimation procedures widely used in practice. By incorporating the current availability of improved computing power and various software applications in hydrology, improvements in the application of ARF estimation methods are necessary to improve DFE and the subsequent design of hydraulic infrastructure. In general, a software application will not only enhance practitioners' decision-making process, but it could also be updated periodically to remain relevant in an international context.
The aim of this paper is to present the development of a software tool to enable practitioners to utilise the regional, geographically-centred ARF methodology developed by Pietersen (2023) at a national scale in South Africa. The specific objectives are to: (i) develop a stand-alone ARF software interface, (ii) critically evaluate the software results against a selection of numerical and graphical geographically-centred ARF estimation methods currently used in local and/or international practice in a range of catchment areas, and (iii) investigate the impact which any inconsistency, possible bias, and/or relative errors between the currently used and recommended (this paper) geographically-centred ARF methods could have on the areal (catchment) design rainfall values and resulting peak discharge estimates when deterministic event-based DFE methods are used in practice. Typically, a range of standard input variables, e.g. catchment area, storm duration, and return period, will be considered to evaluate the consistency between the different ARF estimation methods. Subsequently, no specific study area was selected and, as a result, the next section contains a description of the methodologies adopted and the results obtained. This is followed by the discussion and conclusions.
METHODOLOGY AND RESULTS
This section contains the methodology adopted to achieve all the specific objectives and the associated results.
Development of the ARF software interface
MATLAB' software was used to simplify and reduce the nonlinear (second-order polynomial) log-transformed empirical equation as developed by Pietersen (2023) to result in Equations 1 and 2, which are respectively incorporated as the default and combined algorithm in the ARF software interface.
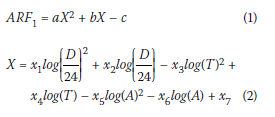
Where:
ARF1 i s the estimated Areal Reduction Factor (%) subjected to 0 < ARF1 < 100%
A is the catchment area (km2) subjected to A < 30 000 km2
D is the storm duration (hours) subjected to 24-hour < D < 168-hour
T is the return period (years) subjected to T < 200-year
X is the major expression variable
a to c are the major expression constants
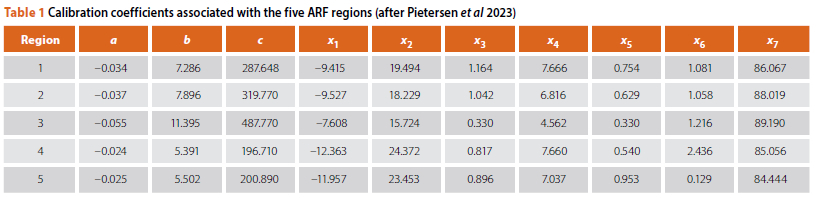
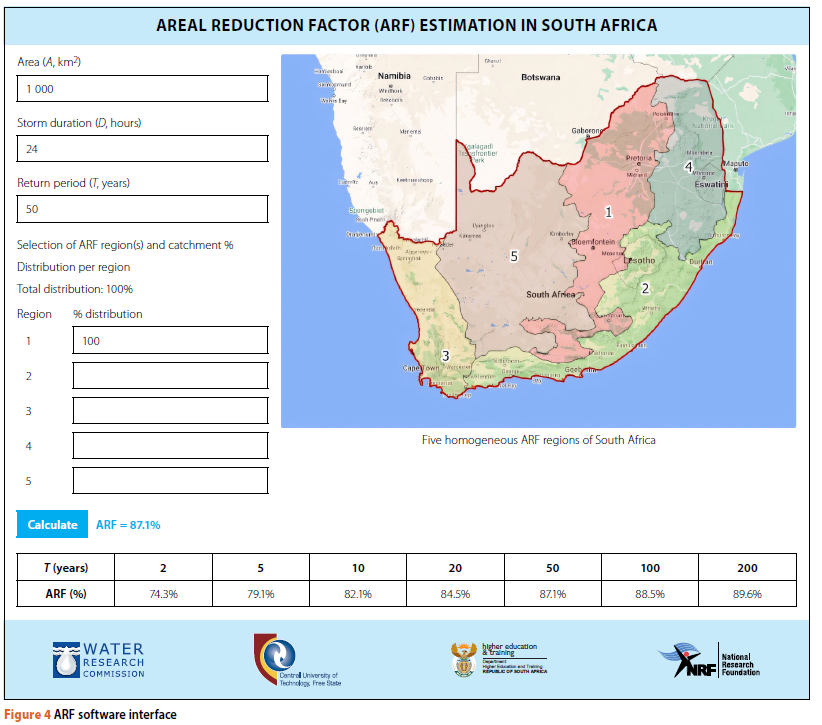
x1 to x7 are the regional calibration coefficients (Table 1 for the regions shown in Figure 4
The ARF software interface, as shown in Figure 4 was developed as a stand-alone application using Visual Studio Code (VSC) in an Integrated Development Environment (IDE) to enable users to run the software through a web browser. VSC is a source-code editor compatible with a variety of programming languages, e.g. Java, JavaScript, Go, Nodejs, Python, and C++, while VSC IDE is available for Windows, Linux and/or the Macintosh Operating System (MacOS). Hence, VSC IDE was used to incorporate a combination of different program languages, e.g. Hypertext Mark-up Language Version 5 (HTML 5), Cascading Style Sheets Version 3 (CSS 3), Bootstrap 4, and JavaScript to enable the development of the interface. As shown in Figure 4 after entering the required input parameters, e.g. catchment area (A, km2), storm duration (D, hours), return period (T, years), and the relevant catchment percentage distribution (%) within a specific/multiple ARF region(s) 1-5, the ARF value (%) based on Equation 1 is estimated. In addition, the ARF estimates which vary with return period, e.g. 74.3% (2-year) to 89.6% (200-year), are summarised in tabular format.
The software interface neither requires any external database nor contains any cookies, and is available in the public domain. The *.zip file is available on request from the first author and can be executed directly as a portable software utility on the user's computer.
In applying the ARF software interface, various ARF diagrams associated with different storm durations and return periods in each ARF region can also be generated. Typical examples of such ARF diagrams based on Equation 1 in Region 4 are shown in Figures 5(a) and 5(b), which illustrate the relationship between ARFs, catchment area, and all durations (24 - 168-hour) associated with the 50-year return period, and all return periods (2 - 100-year) associated with the 24-hour duration, respectively.
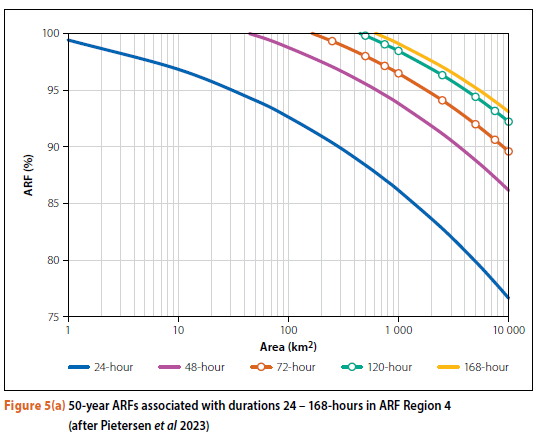
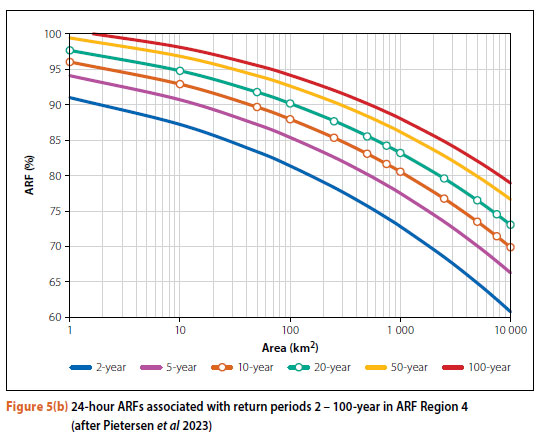
The ARF diagrams shown in Figures 5(a) and 5(b) are limited to 100%, while the ARF values decrease with an increasing catchment area and a decreasing storm duration and return period. Given that the association between the actual catchment size (A) and plausible storm durations (D) is very often overlooked in standard ARF calibration procedures, numerically calibrated equations and/or equations derived from ARF diagrams can often result in unrealistic ARF estimates exceeding 100%. Such ARF estimates > 100% are typically evident when only pre-defined, fixed catchment areas and storm durations linked to the default observation interval (daily/ sub-daily) of available rainfall data are considered, while it is actually highly unlikely to have a short storm duration associated with a large catchment area and vice versa. Subsequently, many other ARF equations available in practice will also provide ARF estimates exceeding 100% under these circumstances, while unrealistic (negative) values towards the lower ARF range are also probable. As a result, all the ARF software interface values (Equation 1) are limited to 100%, while the user is cautioned when unrealistic input parameters (A, D & T) are entered. However, when Equation 1 is applied manually, ARF estimates exceeding 100% could still be possible in certain area-duration ranges. Similarly, most of the other ARF equations derived from ARF diagrams will also exceed 100% in these ranges given their inability to distinguish between plausible and unrealistic area-duration ranges.
Comparison of geographically-centred ARF methods
This section focuses on the comparison of the ARF software estimation results (Equation 1) against a selection of numerical and graphical geographically-centred ARF estimation methods currently used in local and/or international practice to establish the consistency and/or possible bias using Equation 1. The inclusion of both numerical and graphical procedures which are supposedly the same are justified, given that some practitioners still prefer to use the ARF diagrams as opposed to the derived equations.
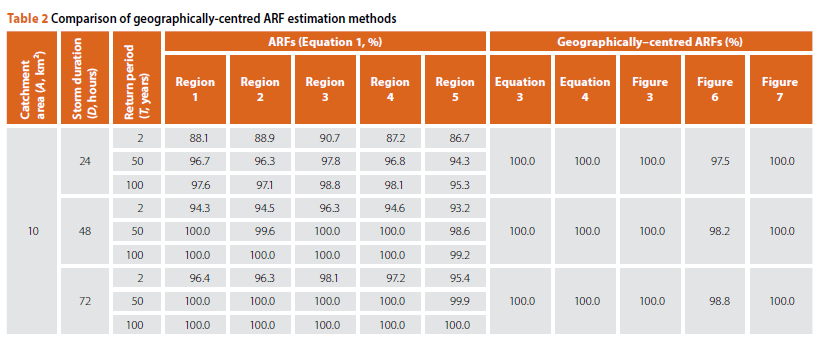
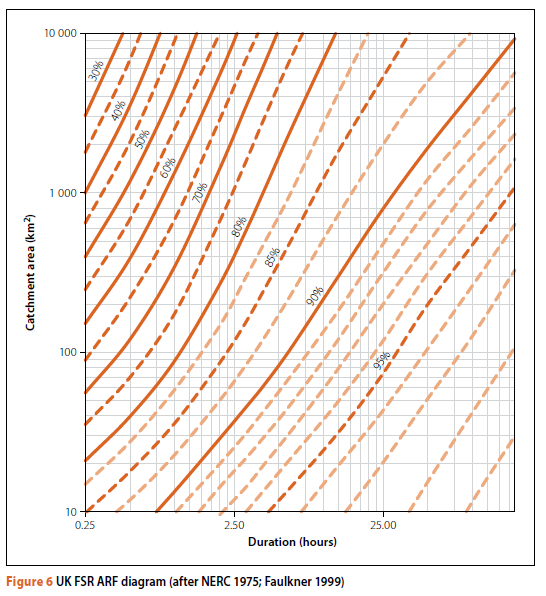
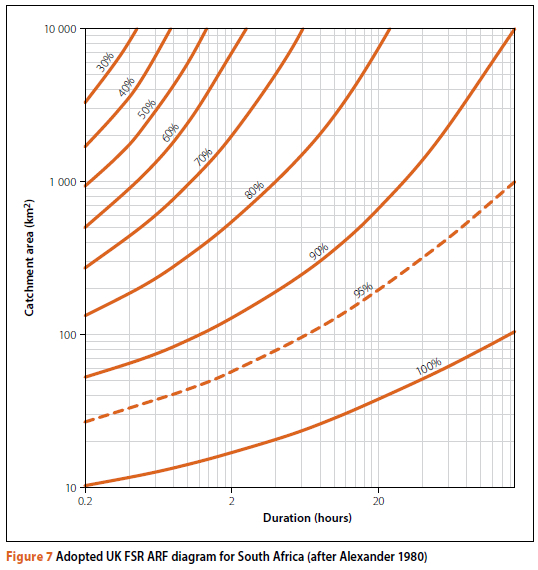
Typically, standard input variables and their associated ranges, e.g. catchment area (10 - 30 000 km2), storm duration (24, 48 and 72 hours) and return periods (2, 50 and 100 years), as listed in Table 2(pp 29-31), were used as input to Equation 1 and the following geographically-centred methods: (i) Equation 3 (after Alexander 1980; Op Ten Noort & Stephenson 1982), (ii) Equation 4 (after Alexander 2001; SANRAL 2013), (iii) Figure 3(Alexander 2001), (iv) Figure 6(NERC 1975), and (v) Figure 7(Alexander 1980).
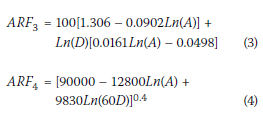
Where:
ARFi is the estimated Areal Reduction Factor (%)
A is the catchment area (km2)
D is the storm duration (hours).
As expected, all the ARF estimates in Table 2decrease with an increasing catchment area. The ARF estimates based on Equation 1 increase with both an increasing storm duration and return period in all the ARF regions, given that rainfall events of a longer duration are more likely to be evenly distributed over the catchment area under consideration. The ARF estimates based on Equation 1 in Region 3 are also slightly higher when compared to the other regions, especially for catchment areas exceeding 100 km2 and at higher return periods (T > 50-year).
Such higher ARFs require a higher degree of similarity between the areal design rainfall and average design point rainfall values, However, by assuming a more uniform temporal and spatial rainfall distribution to result in similar areal design rainfall and average design point rainfall values would be incorrect given that the winter rainfall is highly variable in Region 3, Subsequently, the latter higher ARF values in Region 3 can only be ascribed to the lower density of the rainfall-monitoring network,
All the other ARF estimation methods listed in Table 2provided constant ARF values irrespective of the return period under consideration, In general, all the ARF estimates increase with increasing storm duration, except for A < 100 km2
where Equations 3 and 4 were curtailed to 100%. Figure 6resulted in ARFs < 100% for all the return periods and storm durations under consideration, while ARFs ≈ 100% are typically associated with Figures 3 (A < 100 km2) and 7 (A < 50 km2), respectively.
The mean relative error (MRE) between Equation 1 and the other geographically-centred ARF estimation methods listed in Table 2were estimated using Equation 5. The positive (overestimation) and negative (underestimation) MRE results associated with the 2, 50 and 100-year return periods are shown in Figures 8 to 11 to identify and highlight any trends present in the following areal ranges:
■ 10 - 100 km2 (Figure 8)
■ 500 - 1 000 km2 (Figure 9)
■ 5 000 - 10 000 km2 (Figure 10)
■ 20 000 - 30 000 km2 (Figure 11).
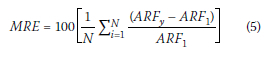
Where:
MRE is the mean relative error (%, with underestimations denoted by (-) negative values)
ARF1 is the Areal Reduction Factor estimated using Equation 1 (%)
ARFy is the Areal Reduction Factors estimated using either Equation 3 (Figure 7, Equation 4 (Figure 3, and/ or Figure 6(%)
i is from 1 to N, depending on the number of catchment areas, storm durations, and return periods considered
N is the sample size.
Areal range 10 - 100 km2 (Figure 8)
In considering the MRE differences between Equation 1 and the other ARF estimation methods, it is evident that the other methods generally tend to overestimate the ARF estimates in comparison to Equation 1. In all cases where Equations 3 and 4 are curtailed to 100% (as in the case of Equation 1), the similarity between their corresponding ARF diagrams, i.e. Figures 7 and 3, becomes prevalent. Overall, Equation 4 and/or Figure 3demonstrate the highest MRE differences up to 7.3% in all the regions. In comparison to Equation 1, the under-estimations are generally less significant, with Figure 6demonstrating the highest underestimations in all the regions, i.e. -1.3% < MRE < -2.3%.
Areal range 500 - 1 000 km2 (Figure 9)
In this areal range, the overestimation of ARFs in comparison to Equation 1 was similar to those recorded in the 10 - 100 km2 areal range; however, the overestimations are less significant (4.2% < MRE < 9.4°/o) and more consistently demonstrated by all the methods. Hence, different methods resulted in the highest overestimations, e.g. Regions 1 and 2 (Equation 3), Region 3 (Equation 4), Region 4 (Figure 3 and Region 5 (Figure 7. As expected, comparable results were produced by Equation 4 and Figure 3 respectively. Overall, the underestimations are slightly higher (-0.8% < MRE < -5%) and, as before, Figure 6demonstrated the highest MRE differences in all the regions.
Areal range 5 000 - 10 000 km2 (Figure 10)
The MRE differences between Equation 1 and the other ARF estimation methods ranged between -12.5% and 15.2%. In terms of overestimations, similar MRE trends are evident in Regions 1 and 5, and Regions 2 and 4, while the lowest overestimations are evident in Region 3. Equation 4 and Figure 3respectively demonstrated the largest underestimations, as follows: -8.4%< MRE < -13.1%. As highlighted before, Equation 4 is the numerical equivalent of Figure 3and such similar results are likely to be recorded.
Areal range 20 000 - 30 000 km2 (Figure 11)
Only Equations 3 and 4 apply to this areal range. In considering the MRE differences between Equation 1 and the latter two methods, it is generally evident that Equation 3 is more biased towards overestimations (7.1% < MRE < 13%), while Equation 4 is more likely to result in underestimations in this areal range, i.e. -12% < MRE < -19.7%.
DISCUSSION
In the Introduction section, a clear distinction was made between geographically-centred and storm-centred ARF approaches. It was also highlighted that South African practitioners currently apply the storm-centred approaches, e.g. Figure 1 (Van Wyk 1965) and/or Figure 2 (Wiederhold 1969) incorrectly in a geographically-centred manner, given the proposed use thereof in the SANRAL (2013) Drainage Manual. In fact, storm-centred ARFs should not be applied when uniform rainfall depth over a catchment area is assumed and the average design point rainfall is estimated from point rainfall statistics. Conceptually, in event-based DFE, a uniform temporal and spatial distribution of average design point rainfall over a catchment area for the duration of the storm is normally assumed, and as a result, only geographically-centred ARFs should be used to convert these values to areal (catchment) design rainfall. Given that storm-centred ARFs are not bound by a fixed geographical (catchment) area and reflect the extent of individual storm events of variable rainfall intensity, the use thereof should be limited to estimate changes in the areal distribution of rainfall intensity during a storm. Ultimately, if practitioners indeed wish to apply Figures 1and/or 2 (storm-centred approaches), Alexander (2001) recommended that a correction factor of up to 1.15 should be applied, but this was not officially tested and documented. Subsequently, it is imperative that in future updates of the SANRAL Drainage Manual, which is regarded by many practitioners as an authoritative text on DFE, a clear distinction should be made between the different ARF approaches and their intended (correct) use.
In considering the above, it is evident why the development of the ARF software tool reported in this paper is limited to geographically-centred ARFs. As a result, and in accordance with the specific study objectives, the ARF software results were only evaluated against a selection of geographically-centred ARF estimation methods currently used in local and/or international practice in a range of catchment areas. Overall, as shown in Table 2 the ARFs estimated using Equation 1 and applicable to certain return periods, were similar to the other geographically-centred methods under consideration in the different catchment area and storm duration ranges. The ARF estimation methods seem to converge at between 97% and 100% when higher return periods (T > 50-year) and storm durations (D > 48-hour) are considered in the areal range up to 100 km2.
In general, all the ARF estimates decrease with increasing catchment area and a decreasing storm duration. Apart from varying with catchment area and storm duration, only the ARF estimates based on Equation 1 vary with return period, i.e. decrease with a decreasing storm duration and return period.
The implication of the MRE differences as highlighted in Figures 8 to 11, especially when these methods are applied in practice, needs to be emphasised. Although Equation 3 and Figures 6 and 7 were considered in this study, they are less likely to be used in flood hydrology practice in South Africa. On the other hand, Equation 4 / Figure 3(after Alexander 2001; SANRAL 2013) is currently earmarked by SANRAL (2013) as the preferred geographically-centred ARF estimation method in South Africa. Hence, practitioners should typically be made aware of any differences between Equation 1 and Equation 4 / Figure 3 In the areal range 10 - 100 km2, MRE differences (overestimations) up to 7.3% were evident. In the areal ranges 500 - 1 000 km2 and 5 000 - 10 000 km2, the magnitude of the MRE differences (overestimations) was limited to 9.1%, while underestimations of up to -12.5% were recorded. In the areal range 20 000 - 30 000 km2, Equation 4 was more biased towards underestimations up to -19.7%. In general, these underestimated ARF values will typically result in lower areal (catchment) design rainfall values, which ultimately will result in lower peak discharge estimates when deterministic event-based DFE methods are used. The opposite is also true, i.e. larger ARF values would result in higher areal (catchment) design rainfall and peak discharge estimates. However, given that Equation 4 (after Alexander 2001; SANRAL 2013) does not vary with return period and has not been validated using local and up-to-date rainfall data applicable throughout South Africa, the deployment of Equation 1 using the ARF software interface and associated procedures is recommended for general use for storm durations exceeding 24 hours.
CONCLUSIONS
The aim of this paper was to present the development and critical evaluation of a stand-alone software interface to estimate regional, geographically-centred ARFs using the methodology developed by Pietersen (2023) by considering standard input variables in a range of catchment areas. The application of the ARF software demonstrated that it is an easy-to-use software tool for the rapid estimation of ARFs in both gauged and ungauged catchments, and with the aid of the default and combined algorithm (Equations 1 and 2), geographically-centred ARFs which vary with return period can be estimated. Thus, the ARFs estimated do not only vary with return period, but the approach is also compatible with the current and recommended RLMA&SI design rainfall database available in South Africa, given that the design point rainfall information contained in this database needs to be converted to areal (catchment) design rainfall by applying an ARF.
In general, it is imperative to recognise that the comparison of any results, whether estimated using existing or newly developed empirical approaches (as applicable to the ARFs presented in this paper), should consider how these different empirical approaches were derived, i.e. using either a storm-centred or geographically-centred approach. Hence, given that the other geographically-centred ARF methods reviewed in this paper do not take return periods into account and have not been validated using local and up-to-date rainfall data applicable throughout South Africa, it is recommended that the ARF software (inclusive of the latest design rainfall information) be incorporated as the standard estimation procedure for long duration (> 24-hour) geographically-centred ARFs in SA. However, Pietersen et al (2023) highlighted that the calibration and verification of the default and combined algorithm (Equations 1 and 2) as included in the ARF software, are limited to durations of 24-hour to 168-hour, despite the acceptable short duration ARF estimates achieved during random tests conducted for durations < 24-hour. Subsequently, it is recommended that short duration ARFs for South Africa should be developed by either using an updated sub-daily rainfall database, improved approaches to disaggregate daily rainfall data into sub-daily rainfall, or the scaling factors associated with the RLMA&SI approach (Smithers & Schulze 2004). For the interim, it is suggested that the latter scaling factor approach and ARF software should be used in combination to justify and compare the ARF estimates obtained for durations < 24-hours, given that ARFs do not necessarily scale with duration in a similar fashion as the mean of the 1-day RLMA&SI design point rainfall values.
In addition, given that all the data sets used for the calibration and/or verification of Equation 1 are only regarded as estimated sample values, the application of the proposed methodology and ARF software should also be further validated for all durations by applying it to actual catchments distributed throughout South Africa and subjected to different rainfall-producing mechanisms. As a result, the latter ARF estimates and subsequent areal (catchment) design rainfall estimates can then be translated into design peak discharges using appropriate deterministic event-based DFE methods to ultimately highlight the impact thereof on flood estimation results at a catchment level.
ACKNOWLEDGEMENTS
This research was funded by the:
■ Water Research Commission (WRC) through WRC Project K5-2924
■ Central University of Technology, Free State (CUT) in collaboration with the Department of Higher Education and Training (DHET)
■ National Research Foundation (NRF) of South Africa.
Several individuals deserve specific mention:
■ WRC Reference Group members for their valuable comments, feedback and suggestions.
■ The anonymous reviewers for their constructive review comments which have helped to significantly improve the paper.
REFERENCES
Alexander, W J R 1980. Depth-area-duration-frequency properties of storm rainfall in South Africa. Technical Report TR103. Pretoria: Department of Water Affairs. [ Links ]
Alexander, W J R 2001. Flood risk reduction measures: Incorporatingflood hydrology for Southern Africa. Pretoria: Department of Civil and Biosystems Engineering, University of Pretoria. [ Links ]
Bell, F C 1976. The areal reduction factor in rainfall frequency estimation. Institute of Hydrology Report No 35. London: Natural Environment Research Council. [ Links ]
Breinl, K, Müller-Thomy, H & Blöschl, G 2020. Space-time characteristics of areal reduction factors and rainfall processes. Journal of Hydrometeorology, 21: 671-689. [ Links ]
Faulkner, D 1999. Flood estimation handbook. Vol 2: Rainfall frequency estimation. Wallingford, UK: Institute of Hydrology. [ Links ]
Jordan, P, Weinmann, E, Hill, P & Wiesenfeld, C 2013. Australian rainfall and runoff: Collation and review of areal reduction factors from applications of the CRC-forge method in Australia. Canberra, Australia: Institution of Engineers. [ Links ]
NERC (Natural Environment Research Council) 1975. Flood studies report. London: NERC. [ Links ]
Op Ten Noort, T H & Stephenson, D 1982. Flood peak calculation in South Africa. Water System Research Programme Report No 2/1982. Johannesburg: University of the Witwatersrand. [ Links ]
Pietersen, J P J 2023. Development and assessment of regionalised areal reduction factors for catchment design rainfall estimation in South Africa. Unpublished DEng Thesis. Bloemfontein, South Africa: Central University of Technology. [ Links ]
Pietersen, J P J, Gericke, O J, Smithers, J C & Woyessa, Y E 2015. Review of current methods for estimating areal reduction factors applied to South African design point rainfall and preliminary identification of new methods. Journal of the South African Institution of Civil Engineering, 57(1): 6-30. [ Links ]
Pietersen, J P J, Gericke, O J & Smithers, J C 2023. Derivation of long duration geographically-centred areal reduction factors for catchment design rainfall estimation in South Africa. Journal of Hydrology: Regional Studies, 50(2023): 101542. DOI: 10.1016/j.ejrh.2023.101542. [ Links ]
Podger, S, Green, J, Jolly, C & Beesley, C 2015a. Creating long duration areal reduction factors. Proceedings, Vol 1, 36th Hydrology and Water Resources Symposium: The Art and Science of Water, Engineers Australia, 7-10 December, Hobart, Australia, pp 39-48. [ Links ]
Podger, S, Green, J, Stensmyr, P & Babister, M 2015b. Combining long and short duration areal reduction factors. Proceedings, Vol 2, 36th Hydrology and Water Resources Symposium: The Art and Science of Water, Engineers Australia, 7-10 December, Hobart, Australia, pp 210-219. [ Links ]
SANRAL (South African National Road Agency Limited) 2013. Drainage manual, 6th ed. Pretoria: SANRAL. [ Links ]
Siriwardena, L & Weinmann, P E 1996. Derivation of areal reduction factors for design rainfalls in Victoria. Report No 96/4. Victoria, Australia: Cooperative Research Centre for Catchment Hydrology. [ Links ]
Smithers, J C & Schulze, R E 2004. The estimation of design rainfall for South Africa using a regional scale invariant approach. Water SA, 30(4): 435-444. [ Links ]
Svensson, C & Jones, D A 2010. Review of methods for deriving areal reduction factors. Journal of Flood Risk Management, 3(2010): 232-245. [ Links ]
USWB (United States Weather Bureau) 1957. Rainfall intensity-frequency regime. Part 1: The Ohio Valley. Technical Paper No 29. Washington, DC: USWB. [ Links ]
USWB 1958. Rainfall intensity-frequency regime. Part 2: Southeastern United States. Technical Paper No 29. Washington, DC: USWB. [ Links ]
Van Wyk, W 1965. Aids to the prediction of extreme floods from small watersheds. Johannesburg: Department of Civil Engineering, University of the Witwatersrand. [ Links ]
Wiederhold, J F A 1969. Design storm determination in South Africa. HRU Report No 1/1969. Johannesburg: Hydrological Research Unit, University of the Witwatersrand. [ Links ]
 Correspondence:
J P J Pietersen
Department of Civil Engineering, Faculty of Engineering, Built Environment and Information Technology, Central University of Technology
Free State, Private Bag X20539, Bloemfontein, 93 00
E: jpietersen@cut.ac.za
O J Gericke
Department of Civil Engineering, Faculty of Engineering, Built Environment and Information Technology, Central University of Technology
Free State, Private Bag X20539, Bloemfontein, 93 00
E: jgericke@cut.ac.za
J C Smithers
Centre for Water Resources Research and School of Engineering, University of KwaZulu-Natal
Pietermaritzburg, 3201
E: smithers@ukzn.ac.za

DR JACO PIETERSEN (PrTechEng, MSAICE) is currently employed as a Senior Lecturer at the Central University of Technology, Free State (CUT) in the Department of Civil Engineering. He obtained his D Eng (Civil) degree from the CUT in 2023. Apart from his 14 years of academic experience, he also worked for five years at an Internationally recognised civil engineering consultancy. He has a special interest in flood hydrology and water resources management, and has published various papers focusing on design rainfall estimation. He is also involved in research projects funded by the Water Research Commission (WRC).

PROF JACO GERICKE (PrEng, IntPE(SA), FSAICE) is the Head of Department (Civil Engineering) at the Central University of Technology, Free State (CUT). He obtained his PhD Engineering (Agriculture) degree from the University of KwaZulu-Natal (UKZN) in 2016 and has more than 25 years of professional and academic experience, mainly in the fields of hydrology, water resources management, and river hydraulics. He has published several papers in the design hydrology field and is involved in research projects funded by the Water Research Commission (WRC).

PROF JEFF SMITHERS (PrEng) was awarded PhD, MSc Eng, and BSc Eng (Agric) degrees from the University of Natal (now known as the University of KwaZulu-Natal (UKZN)). He is currently serving as the Umgeni Water Chair in Water Resources Research and Innovation, and is also the Director of the Centre for Water Resources Research, both at UKZN. He has a wide range of research interests, which include engineering and design hydrology, and in this capacity he is leading the National Flood Studies Programme, which is updating and modernising methods used for design flood estimation in South Africa. He also holds an Adjunct Professorial appointment in the Centre for Agricultural Engineering at the University of Southern Queensland in Toowoomba, Australia, and a Global Chair appointment in the Centre for Regenerative Design & Engineering for a Net-Positive World (RENEW) at the University of Bath, United Kingdom.