



Services on Demand
Journal

Article
 English (pdf)
 Article in xml format
 Article references

 Automatic translation
 Send this article by e-mail
Indicators
Related links
-
 Cited by Google
-
 Similars in Google
Share

 Permalink

South African Computer Journal
On-line version ISSN 2313-7835Print version ISSN 1015-7999
SACJ vol.38 n.1 Grahamstown 2026
https://doi.org/10.18489/sacjv38i1/24116
RESEARCH ARTICLE
A vector-based computational framework for comparative analysis of Kenyan Sign Language and American Sign Language phonology
Catherine Waithera Wangari; Lawrence Muchemi; Peter Waiganjo
Department of Computer Science, University of Nairobi, Kenya. Email: Catherine Waithera Wangari - wangari.catherine1@gmail.com (CORRESPONDING); Lawrence Muchemi - lmuchemi@uonbi.ac.ke; Peter Waiganjo - waiganjo@uonbi.ac.ke
ABSTRACT
This paper introduces a new vector-space computational approach for comparative phonology of Kenyan Sign Language (KSL) and American Sign Language (ASL) using minimal pairs contrasts. Using formal SignWriting (FSW) notation, the framework compiles handshape, location, movement, orientation and non-manual features into structured phonological vectors. These vectors enable quantitative assessment of phonological distance between KSL and ASL signs that correspond over matched items in the lexicon. We calculate pairwise, phonologically-based component and global Euclidean distances for a set of minimal pairs, pointing to systematic differences in phonological organisation of the glosses in the dataset. This research highlights the importance of language specific models in sign recognition systems because direct model transfer from ASL to KSL yields significant representational mismatches. Centering on a dual symbolic and geometric representation of sign language data, this work presents a scalable, linguistically motivated approach to cross-linguistic sign analysis that has the potential to find uses in natural language processing, low-resource language modelling and accessible sign technologies.
Categories • Applied computing → Arts and humanities → Language translation
Keywords: Formal SignWriting, minimal pairs, phonological distance, computational linguistics, vector representation, gesture digitisation
1 INTRODUCTION
Kenyan Sign Language (KSL) has undergone significant transformation under strong cultural and educational influences. During the 1970s and 1980s, many Deaf-education programmes in Kenya adopted American Sign Language (ASL)-based curricula, resulting in widespread contact signing, borrowing of ASL handshapes and classifiers, phonological convergence in movement patterns and, the emergence of hybrid forms among younger signers. The introduction of Signed English (SE) and Signed Exact English (SEE) were designed to visually mirror English grammar and further integrate English-derived markers into KSL discourse (Lucas, 2001; Okombo & Akach, 1997). In addition, KSL has developed over time through community interaction, inter-school sports, urban drift and Deaf community media resulting in mild regional variations throughout Kenya (Sandler & Lillo-Martin, 2006). This blend of local invention and global influence has resulted in an enviable but complex KSL lexicon that not only offers greater richness, but also variability that presents formidable challenges for descriptive linguistics and computational modelling.
The native phonology of KSL was reformed by such outside conventions, making it difficult to separate core KSL structures from borrowed ones. Grounding this study on the linguistic typologies proposed by Stokoe and Marschark (2005) and Uchida et al. (2024) as well as the phonological framework proposed by Stokoe and Marschark (2005), it is then possible to perform a systematic quantification of phonological contrasts, while informing the development of recognition systems that preserve KSL's unique linguistic identity. The contributions of this study are:
1. Quantify parameter level differences between KSL and ASL.
2. Visualise statistical patterns in phonological distributions, and
3. Explore the above implications in KSL recognition systems.
1.1 Sign Language Notation Systems
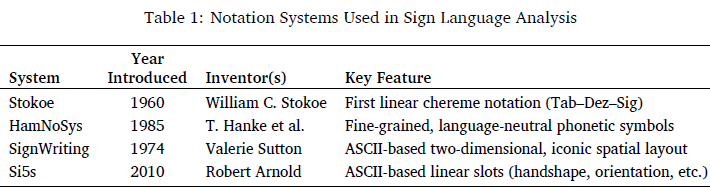
Efforts to create systems that formalise systems to formalise sign language, have led to the evolution of sign language notation systems. Notation systems are formal representations of the phonological, and articulatory properties of signed languages that can be used for linguistic analysis, teaching or computation. One of the first widely accepted notational systems for sign languages was introduced by William C. Stokoe in 1960 (Stokoe & Marschark, 2005), that started a new era for linguistic study and treatment of sign language. Stokoe proposed a ternary system of cheremes, Tab (place), Dez (configuration) and Sig (motion), that demonstrated that ASL has phonological structure in parallel to spoken languages (Benedicto & Brentari, 2004). This pioneering model laid the groundwork for subsequent notational innovations.
In 1985, Thomas Hanke presented HamNoSys (Hanke, 2004), a highly granular, language neutral set of phonetic symbols, suitable for cross-linguistic work as well as corpus annotation. In 1974, Valerie Sutton's SignWriting (Sutton, 2010) capitalised on an ASCII based iconic, two dimensional spatial layout, enabling intuitive representation of both manual and non manual features that closely mirror signing space and enhance community literacy. More recently, Robert Arnold in collaboration with others developed Si5s writing system (Bragg et al., 2018) in 2010, which employs lightweight ASCII based format with fixed slots for handshape, orientation, location, and movement, optimising computational parsability for large scale NLP applications. Table 1 summarises four principal sign notation systems, Stokoe, SignWriting, HamNoSys, and Si5s, across their dates of inception, creators, and defining innovations.
1.2 Adoption of the Notation Systems
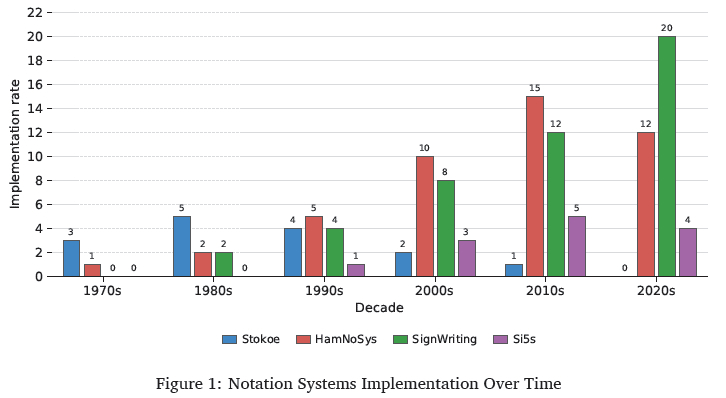
Over the past six decades, sign-notation systems have seen varied trajectories of adoption within research corpora and national projects. In the 1970s, Stokoe's system led with three implementations, while SignWriting appeared once (Parkhurst & Parkhurst, 2010; Stokoe & Marschark, 2005), reflecting early interest in formal sign transcription. The 1980s saw modest growth for HamNoSys projects and SignWriting projects as well, as researchers sought greater phonetic detail (Moryossef et al., 2024). In the 1990s, HamNoSys adoption increased to five corpora, so did four SignWriting initiatives and the first Si5s usage, indicating the emergence of computational needs (Brozdowski et al., 2019; Kato, 2008; Majchrowska et al., 2022). The 2000s were a turning point; HamNoSys was used in ten of the big projects, SignWriting in eight and Si5s in three of them giving an equilibrium between phonetic detail and computational cost melding (Hu et al., 2021; Uchida et al., 2024). In the 2010s, HamNoSys saw fifteen adoptions and uptake of SignWriting increased to twelve as community-led documentation grew (Ponti et al., 2019; Yang, 2021). The last decade of the spectrum is dominated by twenty for SignWriting, highlighting its attractiveness to both researchers and Deaf communities while HamNoSys and Si5s retain their popularity (Da Rocha Costa & Pereira Dimuro, 2002). These trends show a growing adoption of SignWriting for both academic and community sign language documentation, as illustrated in Figure 1.
1.3 Phonological Contrast Theory in Sign Language
The phonological contrast hypothesis for sign language forms the foundational framework to describe the internal structure of signs, and their organisation in terms of a sign language's phonemic inventory. Based on structural linguistic theories, this theory speculates that signs (just like words in spoken languages) are made up of meaningless discrete units of form, which can be recombined (Brentari & Sandler, 1992; Sandler & Lillo-Martin, 2006). The best-known formalisation of this was from William Stokoe who proposed the idea of sign language primes: tab (the location), dez (handshape) and sig (movement), arguing that these elements function similarly to phonemes in spoken languages (Stokoe & Marschark, 2005).
A key methodological tool in this framework is the identification of minimal pairs of signs that differ in at least one phonological parameter. For example, both SORRY and PLEASE in ASL use the same movement, handshape contrast but have a different initial configuration, thus, such pattern shows contrastive context and provides evidence that handshape is to be considered as a phonemic feature (Mweri, 2018; Sevcikova, 2015). By systematically identifying such pairs, one can trace the inventory of contrastive signs through a sign language and the phonology lying behind them.
2 EXPERIMENTAL APPROACH
This section discusses aspects of notation systems, and compares the phonology of KSL and ASL. Based on the work of Stokoe, our approach investigates how phonological features are implemented using a computing framework that uses FSW to represent signs as multi-dimensional vectors.
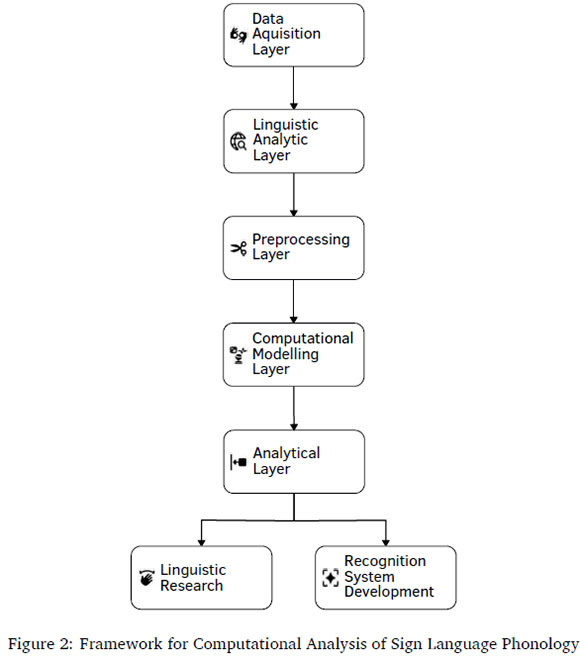
Figure 2 shows the framework of a layered architecture illustrating the process for computational analysis of sign language phonology applicable to annotated sign corpora such as those encoded in FSW (Center for Sutton Movement Writing, 2017). The process begins with the Data Acquisition Layer, which sources annotated visual sign data. Then a Linguistic Analytical Layer, where minimal pairs signs are identified. Then data is then further filtered and preprocessed by the Preprocessing Layer with deduplication and parsing of symbol structures before vectorisation. Then, the Computational Modelling Layer decodes phonological features, handshape, location, movement, orientation and non-manuals, to vectors. Lastly, the Analytical Layer calculates Euclidean distance metrics for these vectors, allowing contrastive phonological comparison between the two sign languages. This pipeline enables scalable and interpretable sign language analysis for linguistic research as well as the development of recognition systems.
2.1 Comparative analysis of the Notation Systems
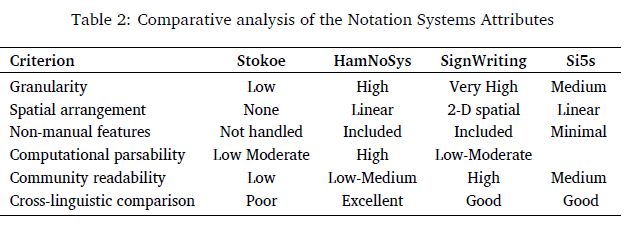
To determine the most effective notation for KSL, we evaluated Stokoe, HamNoSys, SignWriting, and Si5s across six dimensions: granularity, spatial arrangement, non-manual feature encoding, computational parsability, community readability, and cross-linguistic applicability in Table 2.
Stokoe's original phoneme notation laid a vital foundation for understanding linguistic phonemes, but it offers low granularity and no spatial layout, limiting its use for fine-grained phonetic or morphological analyses (Kato, 2008; Martin et al., 2000; Sutton, 2009). HamNoSys in contrast, provides exceptionally high phonetic detail and excels at cross-linguistic comparison through its extensive and language-neutral inventory (Comrie, 1989; Majchrowska et al., 2022; Wanzare et al., 2024). However, its linear, symbol-dense format deters community uptake. SignWriting stands out by combining very high sub-lexical granularity with a two-dimensional, iconic spatial representation that closely mirrors natural signing space (Brentari, 1998; Da Rocha Costa & Pereira Dimuro, 2002; Freitas et al., 2017; Kammann, 2012). Si5s offers streamlined, ASCII-based encoding that maximises computational parsability (Jiang et al., 2023; Moryossef et al., 2024), but at the expense of detailed spatial and non-manual information.
Crucially, these prominent attributes are represented in the word cloud in Figure 3. They are mapped directly onto the above evaluation criteria, underscoring why SignWriting's unique balance of visual reliability and accessibility makes it the optimal choice for capturing and comparing the distinctive grammatical and lexical features of KSL.
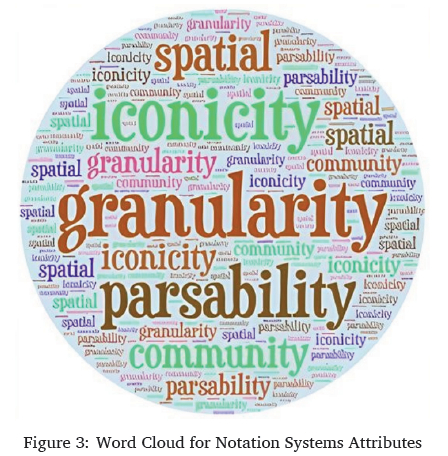
Prominent terms such as granularity, parsability, iconicity and spatial features reflect ongoing concerns in literature on sign language notation systems. This visualisation qualitatively summarises Table 2 depicting the thematic priorities that have shaped the evolution and adoption of sign language notation systems over time.
2.2 Data Collection
As the first step towards creating structured dataset of KSL signs, we transcribe image data into Sutton's SignWriting notation using existing image corpora of KSL images from publicly available datasets. All data in this study come from secondary sources and are transcribed in FSW. Five primary phonological parameters are encoded in FSW using organised combinations of glyphs, which can be parsed.
Morgan and Mayberry (2012) created a highly coded KSL lexical database to include 1,880 non-compound signs, which contained over 50 phonetic features for each sign. Most importantly, this resource also contains a set of 461 minimal pairs that was collected according to a structured method for lexical contrast which allows locating it on the exclusive side of sign language studies. Complementing this, Mweri (2018) provides illustrative minimal pairs spanning handshape, movement, location, and orientation, such as "githeri" versus "luo" for handshape, "porridge" versus "ignore" for movement, and "complain" versus "fear", along with "true" versus "false", for orientation, demonstrating explicitly phonemic contrast in KSL.
2.3 Extraction of minimal pairs and Quality control
Each gloss in the corpus is meticulously transcribed into its constituent phonological features using Sutton's SignWriting system. The transcribed data is organised into a database. The innovative criteria of Brentari and Sandler (1992) are used to build a valid minimal-pairs dataset for the phonemic contrast analysis in KSL, but adapted and contextualised for KSL through the Morgan and Mayberry (2012) classification, which classified them during minimal pairs extraction.
To ensure the integrity and consistency of the FSW data in minimal-pairs phonology contrast analysis for KSL, we apply a multiple-tier quality check mechanism. First, all FSW entries are schema validated to make sure that each conforms structurally to a formal FSW grammar which re-centres numeric bounds on symbol codes and requires the presence of all five core phonological parameters. The FSW string of each sign is checked against expected segment numbers and symbol combinations to verify that it is complete and structurally sound. Second, tokenisation of symbols is executed utilising a deterministic parser, which separates all the FSW symbols into their atomic elements and then translates them to machine-readable vectors. Each vector represents sign features in quantitative terms and can be computationally examined and contrasted across minimal pairs. Third, deduplication is enforced by applying token signature hashing, where each sign's feature vector is reduced to a fixed signature hash to remove exact duplicates.
2.3.1 Justification for KSL-ASL Gloss Pairings
Direct alignment of gloss terms between two sign languages requires careful linguistic consideration, as glosses often differ significantly across languages. In this study, we aligned selected glosses in KSL and ASL for comparative phonological vectorisation. This alignment was motivated by two primary factors:
Lexical Borrowing: Following the introduction of ASL in Kenyan Deaf education from the 1980s onward, KSL underwent decades of contact-induced change. Educators and interpreters frequently incorporated ASL signs into KSL classrooms and materials. As a result, a substantial portion of the KSL lexicon consists of loan words and signs historically cognate with ASL. Estimates suggest that 20-33% of KSL signs are ASL-related in both form and meaning (Okombo & Akach, 1997). Where such borrowings occur, the glosses can be considered true lexical equivalents.
Dictionary-Based Equivalence: The most systematic and practical justification for our gloss pairings is dictionary alignment. The source KSL signs are drawn from a 2004 video dictionary, and corresponding ASL signs were identified through standard lexical resources, including Signing Savvy, HandSpeak and KSL dictionary (HandSpeak, 2025; Mstadi Africa, 2025; Signing Savvy, 2025). This method ensures that glosses match at the English label level (e.g., "OAT MEAL" , "PORRIDGE"), and supports reproducibility. The chosen glosses reflect concepts commonly indexed in both lexicons and exclude culturally localised items (e.g., "GITHERI" or "UGALI") for which no ASL equivalents exist.
2.4 Vectorisation of Sign Gestures
Each gloss sign is mapped to an array of sub-vector components of a comprehensive vectorised representation FVs for a given sign s, such that: Each sign s is represented as a feature vector in Equation (1):

where: Hs: Handshape is represented as a 4-dimensional vector capturing sub-phonological features:

Handshapes are not orthogonal, and as such, each handshape is represented by a vector of sub-features that capture key articulatory properties, such as selected fingers, joint configuration, finger spread, and thumb position. This decomposition aligns with established phonological models and enables a more nuanced representation of inter-sign similarity. Similar hand shapes such as those differing only by aperture or thumb position are able to be distinguishable, improving representational fidelity. Handshape Hs is extracted from FSW glyphs within the symbol ranges S10x-S38x, each corresponding to a specific finger configuration.
The Location Ls is inferred from the 2D spatial placement of symbols in the sign box, normalised to a grid map as used in the ISWA 2010 (Center for Sutton Movement Writing, 2017) symbol set. The pixel coordinates (x, y), referenced in Equation (2) are extracted directly from FSW symbol metadata using standard signwriting tools. These coordinates correspond to relative positions of symbols in a 1000×1000 pixel canvas. For this study, we standardised the signing space to a bounding box of 400-600 pixels in both x and y axes, based on empirical inspection of bounding boxes of handshapes in the exported FSW files. This bounding box captures the active signing space centred on the torso.
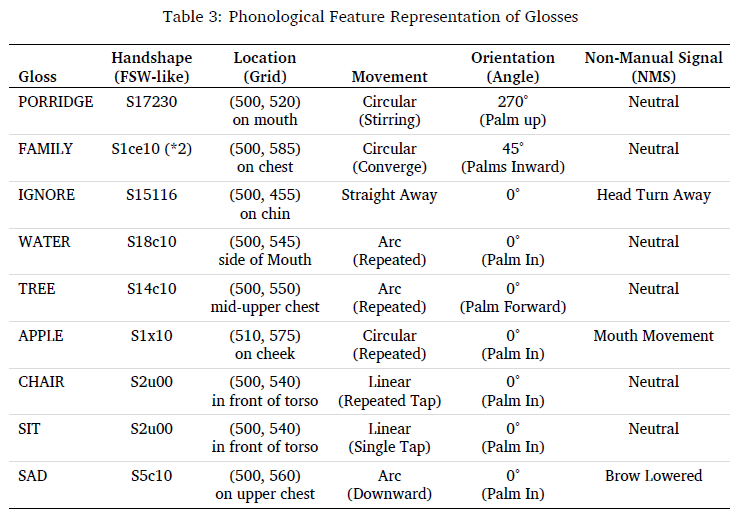
The transformation to grid indices (X, Y), as shown in Table 3 is computed programmatically. They are normalised into a fixed grid of 10 × 10 such that Ls = [xs, ys] ∈ R2, where the origin represents the centre of the signer's body, and axes are scaled to reflect signing space proportions. Given an FSW coordinate (x, y) in the pixel space, it is mapped to (X, Y) on a 10×10 grid using Equation (2). This mapping ensures consistent discretisation of signing space across all samples.

The original coordinate space, x ∈ [xmin, xmax] is [400, 600] and y ∈ [ymin, ymax] is [400, 600]. The Target grid coordinate X ∈ 0, ..., 9 and Y ∈ 0, ..., 9. Therefore, xmin = 400, xmax = 600 and ymin = 400, ymax = 600.
Movement Ms uses the glyph codes, and translates these into movement vectors based on direction and path type. It is encoded using the dynamic trajectory of a sign and is represented as in Equation (3):

where: φ is the angular direction of movement (in radians), derived from glyph orientation. mt is a movement type index encoded as one-hot vector drawn from the phonologically distinctive set, (linear, arc, circular, repeated, zigzag, wavy). r ∈ {0, 1} is a binary repetition flag indicating whether the movement is repeated. d ∈ {0, 1, 2} denotes normalised duration (short (0), medium (1), long (2)).
These movement features are grounded in sign phonology literature, which identifies contrastive movement patterns as critical to meaning. This vector structure ensures phonologically significant distinctions like circular versus zigzag or repeated versus single arc, are explicitly encoded and distinguishable in the vector space. This model is based on phonological studies such as (Brentari & Sandler, 1992; Brentari, 1998), which identify these movement types as lexically contrastive in sign languages.
Orientation Os is extracted from modifiers in FSW that denote palm and finger directionality. These are represented using unit vectors on a circle, in Equation (4), where θ is the orientation angle in radians, typically one of eight cardinal or intercardinal directions (0°, 45°, ..., 315°).

Non-manual features Ns are identified from facial and head glyphs. They represent facial and upper-body articulations that co-occur with manual signs and carry essential grammatical and phonological information. They are encoded as a multi-label vector capturing the presence or absence of key linguistic articulators. The following categorical features are used:
Eyebrows: raised, lowered.
Eyes: wide, squint, neutral.
Mouth Shape: open, pursed, neutral.
Head Movement: nod, shake, tilt, turn.
Gaze Direction: direct, upward, downward, side.
Each sign's Non-manual feature vector encodes which of these components are active, based on annotation or glyph metadata. For example, a sign performed with brow-lowering and head-tilt is encoded as:

This rich encoding allows our model to capture cross-linguistic variation in facial grammar and supports meaningful comparison between languages where non-manual features carry lexical and grammatical contrasts such as negation via headshake and question via eyebrow raise.
From the above, the updated parameter vectorisation model translates each sign's discrete phonological components into computational vector representations as in Equation (5):

The above parametric model is central to this research's aim of transforming Formal SignWriting into mathematically tractable structures. It facilitates computational analysis and phonological comparison of KSL signs, contributing to corpus-based sign language processing. Equally, it supports distance-computability of vectorised parameters using Euclidean distance metrics, paired t-test and permutation test to quantitatively evaluate phonemic contrasts.
2.5 Euclidean Distance Computation
The measurement of phonemic contrasts between KSL gloss pairs is formalised using a feature-space distance metric, which quantifies the dissimilarity between signs represented as computational vectors. The primary metric employed is the Euclidean distance is in Equation (6), calculated as:

where FVs and FVj are the vectors of the signs s and j respectively. This metric is suitable for mixed continuous and embedded categorical features, and it ensures that differences in any one phonological dimension are captured as measurable divergence in geometric space. For more granular analysis, we compute parameter-specific distances as below:

This model represented in Equation (7) is used to quantify the phonological dissimilarity between two signs s and j with respect to a single phonological parameter p. In this formulation, FVp(i) denotes the vector representation of parameter p for the sign s, while FVp(j) represents the corresponding vector for the sign j. Each vector has a dimensionality of np, which reflects the number of phonological features encoded for that parameter. The component FVp(s)k refers to the value of the k-th feature in the vector for sign s. The Euclidean normalisation ∥.∥, (L2 normalisation) measures the straight line distance between the two vectors in feature space, computed by taking the squared difference of each feature dimension, summing across all features, and applying the square root. The result, dp(s, j), expresses how different two signs are with respect to parameter p. If dp(s, j) = 0, signs s and j are identical in parameter p. However, a larger dp(s, j) indicates greater phonological dissimilarity in that parameter. The parameter-specific distance then feeds into the overall phonological distance computed by the model in Equation (8):

For example, in the case of handshape, where vectors may be represented using multi-feature encodings, two identical handshapes will yield a distance of zero, while two non-identical handshapes will yield a fixed distance. By focusing on the component-wise distances, this method ensures that statistical evaluations align with linguistic definitions of phonemic contrast, supporting the experiment's aim to validate KSL's unique phonemic structure through Formal SignWriting representations.
3 RESULTS AND DISCUSSION
3.1 Visualisation of Phonological Contrast
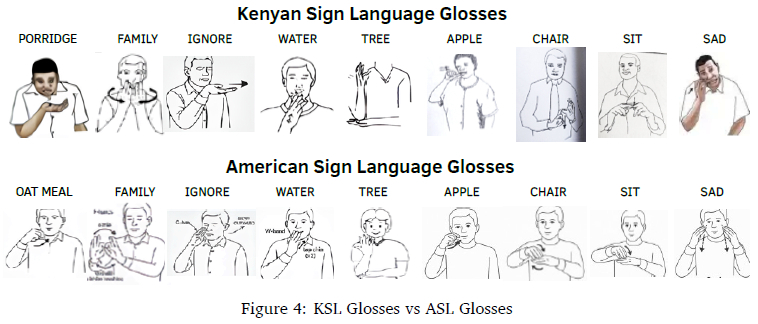
KSL signs are explicitly encoded in the spatial and symbolic syntax of FSW, where each glyph in a sign corresponds to a Unicode-like symbol with geometric coordinates and category identifiers. Table 3 shows a curated dataset that represents a controlled construction of KSL glosses in Figure 4.
The handshape is coded as a categorical variable based on the FSW symbol groups, location information is approximated by 2D spatial locations of symbols in the sign box, and normalised to a grid map similar to the ISWA 2010 symbol set. Movement is represented by dynamic arrow symbols (circular, straight, arc and zigzag) that indicate directionality and type of path, each over a vector-based encoding. Orientation is based on modifiers that reference passed palm and finger orientation as angles rounded to the closest 45°. Finally, non-manual signals like facial expression or head movement are obtained from symbol clusters.
This granular decomposition enables precise computational comparisons between signs. It aligns with contemporary linguistic analyses that treat sign parameters as phonological primitives (Sandler & Lillo-Martin, 2006), thus reinforcing the suitability of FSW for phonemic-level analysis in KSL.
3.2 Vector Representation
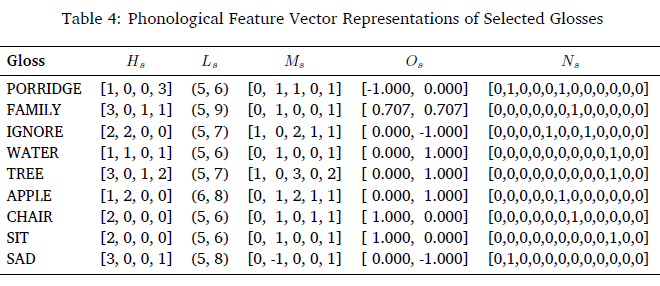
In Table 4, each entry in the table encodes a single sign as a composite feature vector FVs. The vectorised representations are standardised to facilitate cross-linguistic comparison in a shared high-dimensional feature space. This encoding enables quantitative analysis to assess cross-linguistic phonological alignment.
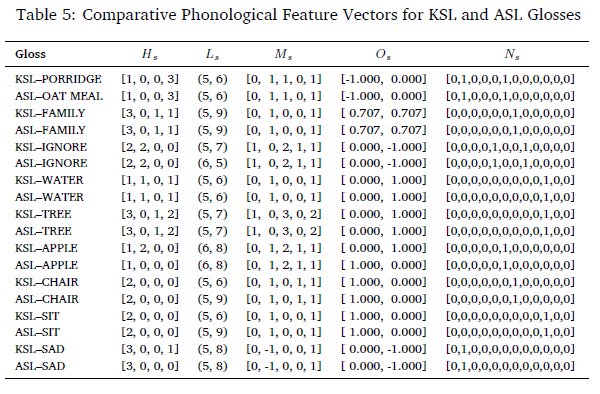
Table 5 represents a comparative vectorisation table that consolidates phonological data from both KSL and ASL, standardising each gloss into a high-dimensional vector space.
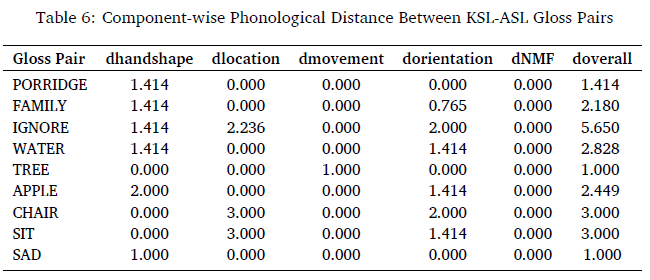
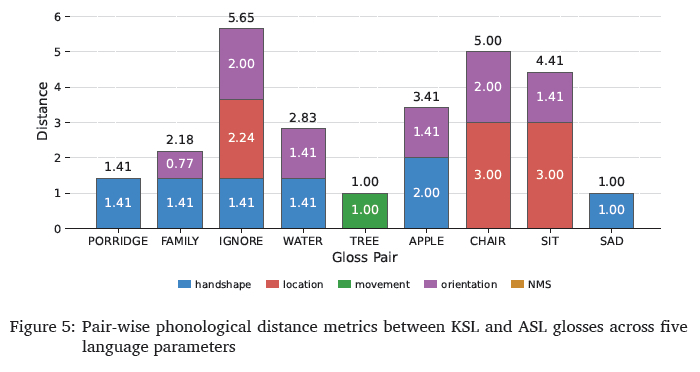
Table 6 shows the pairwise phonological distances between the selected KSL signs and their ASL equivalents, measured across the core parameters. Each row corresponds to a sign pair, and each column quantifies the Euclidean distance between the signs vectorised representations for the specified parameter.
These results are further qualitatively represented in Figure 5. They illustrate that while certain signs exhibit strong cross-linguistic structural similarity (TREE), others diverge substantially due to language-specific iconic strategies.
The orientation and handshape show the most common source of divergence across the nine gloss pairs. This confirms that the two languages often employ distinct articulatory forms to express similar semantic content. TREE and SAD show near-complete phonological convergence with variance in only one component, yielding the lowest distance score (1.000). Conversely, IGNORE displays maximum dissimilarity, with significant deviations in handshape (Flat Hand vs. 4-Hand), location (Temple vs. Nose), and orientation (Palm Out vs. Palm Forward), thus producing the highest overall phonological distance (5.650). FAMILY, WATER, APPLE, CHAIR and SIT, fall in an intermediate range.
4 STATISTICAL VALIDATION OF PHONOLOGICAL SUB-VECTORS
To quantitatively assess whether the five phonological sub-vectors contribute equally to the overall phonological distance, we formulate a null and alternate hypothesis and apply two statistical tests: parametric paired t-tests and non-parametric permutation tests.
For this study, we adopt a stricter significance level of α = 0.01 to account for the small sample size (n = 9) gloss pairs. A conventional threshold of 0.05 is more susceptible to Type I errors in small samples where statistical variability is high. In addition, testing five sub-vectors against the overall phonological distance introduces a risk of inflated family-wise error. This more conservative threshold ensures that only the most substantial and consistent differences are considered statistically significant.
Hypothesis Formulation
We test the following hypotheses:
H0: There is no significant difference in the contribution of subvector specific distances' to the overall phonological distance across gloss pairs in KSL and ASL.
The alternative hypothesis:
(HA) assumes that subvectors specific distances' contribution is significantly uneven to the overall phonological distance.
Paired t-Test
A paired sample t-test is applied to each sub-vector component across the nine aligned gloss pairs. It evaluates whether the mean difference between two related samples is statistically significant. This is appropriate for our design, where each gloss concept is shared between KSL and ASL but potentially differs in its phonological encoding.
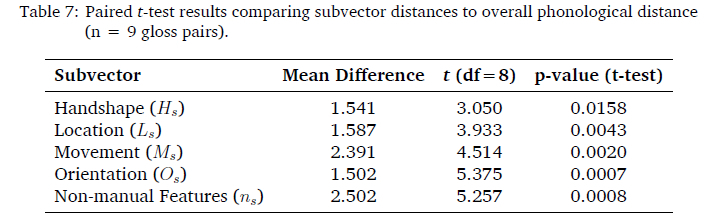
Table 7 summarises the results of paired-sample t-tests comparing each sub-vector specific phonological distance to the overall distance across nine KSL-ASL gloss pairs. At a significance level of p < 0.01, all sub-vectors except handshape (Hs) show statistically significant differences from the overall phonological distance. Notably, movement (Ms), orientation (Os), and non-manual features (Ns) display the strongest deviations, with t-values exceeding 4.5 and p-values below 0.002. These results indicate that these sub-vectors contribute disproportionately to the overall phonological distance, supporting our interpretation of non-uniformity in phonological divergence across feature dimensions in sign languages. Handshape had a mean difference of 1.541, and a t-value t(8) = 3.050, suggesting that the measure significantly differed from overall phonological distance. However, with a predetermined level of significance α = 0.01, the resulting p-value (p = 0.0158) is not less than the required significance level.
Relative to the other phonological sub-vectors, handshape had the smallest t-value and highest p-value, meaning greater variability across gloss pairs and a weaker contribution to overall phonological distance. This suggests that while handshape shows a measurable effect on the overall distances, the influence is less robust under stricter statistical control, justifying the importance of sensitive modelling in sign language phonology.
4.1 Permutation Test
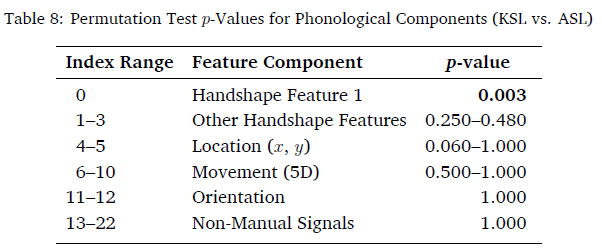
To further validate the phonological differences between corresponding KSL and ASL glosses, we conducted a non-parametric permutation test on each dimension of the full phonological vector representation. We used 10,000 permutations, which yields a p-value resolution of 0.0001 and falls within the 5,000-10,000 range recommended in the statistical literature for stable and interpretable results in small-sample studies (Good, 1994; Tuğran et al., 2015). Table 8 presents the resulting permutation test p-values for each phonological component.
These results reinforce the earlier parametric analysis and indicate that, among the 23-dimensional phonological vectors, only the first handshape feature exhibits a statistically significant difference (p = 0.003) between KSL and ASL glosses. This aligns with phonological theory, as handshape is often the most linguistically contrastive and least iconic parameter across sign languages. All other subcomponents, including movement, orientation, and non-manual signals, fail to reach significance levels, further supporting the high structural similarity in these dimensions for the gloss pairs. This corroborates the parametric findings, confirming that the differences observed are unlikely to arise by chance, even under minimal distributional assumptions.
4.2 Hypothesis Decision
Given the consistent statistical significance across both parametric and non-parametric tests, we reject the null hypothesis (H0) that there is no significant difference between the contribution of sub-vector specific distance to overall phonological distance. The results support the alternative hypothesis (HA) that phonological sub-vectors do not contribute uniformly to overall phonological distance.
The results are consistent with the alternative hypothesis that states feature parameters play an important role in interlingual phonological diversity. Though both KSL and ASL are very different languages, it seems as if most of these differences can be attributed to only a few phonological features that have enough weight to shape the overall distance metrics. However, such closeness might have occurred due to factors related to the experiments but not part of them, and therefore treating distance as a whole by flattening it may obscure these effects. That is why decomposing vector representations into separate phonological components is not just a good idea, it is methodologically necessary. It allows us to find a way to break down the contribution of specific features to the larger variation pattern.
CONCLUSION
Our findings provide evidence for the phonological distinctiveness of KSL, shown in our distance analysis, and statistical significant tests between components in the Kenyan Sign Language (KSL) and American Sign Language (ASL). The validation results have significant implications for the development of sign language recognition systems and underscore the necessity for language-specific training, because variability in features components suggests that models trained on ASL are likely to perform poorly when applied directly to KSL, resulting in substantial misclassifications.
The computational framework for KSL signs is useful to analyse phonological distance with Euclidean metrics, which will be applicable to phonemic pairs. By breaking up each sign into small, phonological parts we demonstrate how the model supports complex queries such as "find me all KSL signs that include a handshape A at the level of (around) your jaw". Further, the Euclidean model proposed in this work is easily interpretable and scalable, with each dimension in the vector space directly corresponding to a phonological relevant feature. This enables analysability and easy integration into natural language processing (NLP) and sign technology.
LIMITATIONS AND FUTURE WORK
This research acknowledges several limitations, one is a small sample gloss pair size. This restricts the generalisability of statistical findings. Next is the assumption of linearity in calculating Euclidean distances across sub-vector distances in all phonological dimensions, this is not a true reflection of linguistic saliency. In the future it would be interesting to see how well a larger set of gloss pairs that come from different, multiple sub-domains perform. Also, from the results, future work will include using a weighted distance metrics in machine learning to better capture the importance of phonological sub-vectors. Cross-linguistic comparison to other sign languages would also verify the extent of generalisation of this result.
References
Benedicto, E., & Brentari, D. (2004). Where did all the arguments go?: Argument-changing properties of classifiers in ASL. Natural Language & Linguistic Theory, 22(4). https://doi.org/10.1007/s11049-003-4698-2 [ Links ]
Bragg, D., Kushalnagar, R., & Ladner, R. (2018). Designing an animated character system for American Sign Language. ASSETS '18: Proceedings of the 20th International ACM SIGACCESS Conference on Computers and Accessibility, 282-294. https://doi.org/10.1145/3234695.3236338
Brentari, D., & Sandler, W. (1992). Phonological representation in American Sign Language. Language (Baltimore), 68(2), 359. https://doi.org/10.2307/416945 [ Links ]
Brentari, D. (1998). A prosodic model of sign language phonology. MIT Press. http://direct.mit.edu/books/monograph/2418/bookpreview-pdf/2398743
Brozdowski, C., Secora, K., & Emmorey, K. (2019). Assessing the comprehension of spatial perspectives in ASL classifier constructions. Journal of Deaf Studies and Deaf Education, 24(3), 214-222. https://doi.org/10.1093/deafed/enz005 [ Links ]
Center for Sutton Movement Writing. (2017). Sutton SignWriting fonts [Licensed under the SIL Open Font License v1.1]. Retrieved June 11, 2025, from https://slevinski.github.io/SuttonSignWriting/characters/symbols
Comrie, B. (1989). Language universals and linguistic typology: Syntax and morphology (2nd). University of Chicago Press. https://press.uchicago.edu/ucp/books/book/chicago/L/bo24426144.html
Da Rocha Costa, A. C., & Pereira Dimuro, G. (2002). SignWriting-based sign language processing. Advances in Artificial Intelligence, Lecture Notes in Computer Science. https://doi.org/10.1007/3-540-47873-6_22
Freitas, F. A., Peres, S. M., Lima, C. A. M., & Barbosa, F. V. (2017). Grammatical facial expression recognition in sign language discourse: A study at the syntax level. Information Systems Frontiers, 19(6), 1243-1259. https://doi.org/10.1007/s10796-017-9765-z [ Links ]
Good, P. (1994). Permutation tests. Springer New York. https://doi.org/10.1007/978-1-4757-2346-5
HandSpeak. (2025). HandSpeak: Sign language resources and American Sign Language (ASL) tutorials. HandSpeak LLC. Retrieved May 8, 2025, from https://www.handspeak.com/
Hanke, T. (2004). HamNoSys-representing sign language data in language resources and language processing contexts. Proceedings of the LREC2004 Workshop on the Representation and Processing of Sign Languages. https://www.sign-lang.uni-hamburg.de/lrec/pub/04001.html
Hu, H., Zhao, W., Zhou, W., Wang, Y., & Li, H. (2021). SignBERT: Pre-training of hand-model-aware representation for sign language recognition. 2021 IEEE/CVF International Conference on Computer Vision (ICCV), 11067-11076. https://doi.org/10.1109/iccv48922.2021.01090
Jiang, Z., Moryossef, A., Müller, M., & Ebling, S. (2023). Machine translation between spoken languages and signed languages represented in SignWriting. Findings of the Association for Computational Linguistics: EACL 2023. https://doi.org/10.18653/v1/2023.findings-eacl.127
Kammann, J. (2012). The role of phonology and semantics in the lexical processing of ASL core lexical items and classifier constructions [Doctoral dissertation, University of California, San Diego]. https://digitalrepository.unm.edu/ling_etds/20/ [ Links ]
Kato, M. (2008). A study of notation and sign writing systems for the Deaf. Intercultural Communication Studies, 17(4), 97-114. https://www.sciltp.com/journals/ics/articles/2008244008 [ Links ]
Lucas, C. (2001). Sociolinguistic variation in American Sign Language. Gallaudet University Press. https://doi.org/10.2307/j.ctv2rh2959
Majchrowska, S., Plantykow, M., & Olech, M. (2022). Handling sign language transcription system with the computer-friendly numerical multilabels. Retrieved June 23, 2025, from https://arxiv.org/abs/2204.06924
Martin, J., Signer, A., & Clark, K. (2000). A linguistic comparison of two notation systems for signed languages: Stokoe notation and sutton SignWriting. Proceedings of the International Sign Language Research Conference. https://www.semanticscholar.org/paper/87c70109692581013340e7b54ef9d88b928d110a
Morgan, H. E., & Mayberry, R. I. (2012). Complexity in two-handed signs in Kenyan Sign Language. Sign Language and Linguistics, 15(1), 147-174. https://doi.org/10.1075/sll.15.1.07mor [ Links ]
Moryossef, A., Zilberman, R., & Langer, O. (2024). SignWriting-evaluation: Effective sign language evaluation via SignWriting. Retrieved June 18, 2025, from https://arxiv.org/abs/2410.13668
Mstadi Africa. (2025). KSL dictionary [Android App]. Mstadi Africa. Retrieved April 4, 2025, from https://play.google.com/store/apps/details?id=com.mstadi.ksldictionary.ksldict
Mweri, J. G. (2018). Kenya Sign Language (KSL) phonology: Articulatory properties and phonological processes. Linguistics and Literature Studies, 6(4), 169-182. https://doi.org/10.13189/lls.2018.060403 [ Links ]
Okombo, D. O., & Akach, P. O. (1997). Language convergence and wave phenomena in the growth of a national sign language in Kenya. International Journal of the Sociology of Language, 125(1). https://doi.org/10.1515/ijsl.1997.125.131 [ Links ]
Parkhurst, S., & Parkhurst, D. (2010). A cross-linguistic guide to SignWriting®: A phonetic approach. SIL International. https://www.signwriting.org/archive/docs7/sw0617_Cross_Linguistic_Guide_SignWriting_Parkhurst.pdf
Ponti, E. M., O'Horan, H., Berzak, Y., Vulić, I., Reichart, R., Poibeau, T., Shutova, E., & Korhonen, A. (2019). Modeling language variation and universals: A survey on typological linguistics for natural language processing. Computational Linguistics, 45(3), 559-601. https://doi.org/10.1162/coli_a_00357 [ Links ]
Sandler, W., & Lillo-Martin, D. C. (2006). Sign language and linguistic universals. Cambridge University Press. https://doi.org/10.1017/cbo9781139163910
Sevcikova, Z. (2015). Categorical versus gradient properties of handling handshapes in British Sign Language (BSL): Evidence from handling handshape perception and production by deaf BSL signers and hearing speakers. https://doi.org/10.1017/langcog.2015.4
Signing Savvy. (2025). Signing savvy: American Sign Language (ASL) video dictionary and learning resource. Signing Savvy, LLC. Retrieved May 8, 2025, from https://www.signingsavvy.com/
Stokoe, W. C., & Marschark, M. (2005). Sign language structure: An outline of the visual communication systems of the American Deaf. Journal of Deaf Studies and Deaf Education, 10(1), 3-37. https://doi.org/10.1093/deafed/eni001 [ Links ]
Sutton, V. (2009). SignWriting sign languages are written languages! SignWriting basics. Deaf Action Committee for SignWriting. http://www.SignWriting.org/deaf
Sutton, V. (2010). The International SignWriting Alphabet (ISWA 2010) [Symbol archive]. Sutton's SymbolBank. Retrieved May 20, 2025, from http://www.MovementWriting.org/symbolbank
Tuğran, E., Kocak, M., Mirtagioğlu, H., Yiğit, S., & Mendes, M. (2015). A simulation based comparison of correlation coefficients with regard to type I error rate and power. Journal of Data Analysis and Information Processing, 3(3), 87-101. https://doi.org/10.4236/jdaip.2015.33010 [ Links ]
Uchida, T., Miyazaki, T., & Kaneko, H. (2024). HamNoSys-based motion editing method for sign language. Proceedings of the Language Resources and Evaluation Conference (LREC-COLING 2024), 376-385. https://aclanthology.org/2024.signlang-1.42
Wanzare, L., Okutoyi, J., Kang'Ahi, M., & Ayere, M. (2024). Kenyan Sign Language (KSL) dataset: Using artificial intelligence in bridging communication barrier among the Deaf learners. Proceedings of the African Computational Linguistics Conference. https://doi.org/10.52968/15069208
Yang, Y. (2021). The structure of classifier constructions and some related theoretical issues. Macrolinguistics, 9(15), 1-24. https://doi.org/10.26478/ja2021.9.15.1 [ Links ]
Received: 29 September 2025
Accepted: 4 June 2026
Online: 31 July 2026