


Services on Demand
Journal

Article
 English (pdf)
 Article in xml format
 Article references
 Send this article by e-mail
Indicators
Related links
-
 Cited by Google
 -
 Similars in Google
Share

 Permalink
Journal of the Southern African Institute of Mining and Metallurgy
On-line version ISSN 2411-9717Print version ISSN 2225-6253
J. S. Afr. Inst. Min. Metall. vol.125 n.7 Johannesburg Jul. 2025
https://doi.org/10.17159/2411-9717/1619/2025
PROFESSIONAL TECHNICAL AND SCIENTIFIC PAPERS
Fatigue performance improvement using laser shock peening in high strength ductile metallic materials
S.L. GeorgeI; R. TaitII; A. BeckerII; A. CarlisleII
ICentre for Materials Engineering, Department of Mechanical Engineering, University of Cape Town, South Africa. http://orcid.org/0000-0002-6084-6361
IIDepartment of Mechanical Engineering, University of Cape Town, South Africa
ABSTRACT
Surface treatments like laser shock peening (LSP) induce residual stresses penetrating up to 1 mm deep, surpassing traditional methods, thus significantly increasing the potential impact on materials prevalent in the automotive and aerospace sectors. Through extensive fatigue testing and fractography investigations, it was determined that LSP resulted in a fatigue life increase of over five times for aluminium alloy AA7075-T6 and titanium Ti-6Al-4V. Increased fatigue life was also noted in AISI316 stainless steel, which showed increases in fatigue life of 1.7x. While fatigue life in all cases improved, the efficacy of LSP was shown to be material dependent.
Keywords: laser shock peening, compressive residual stress, fatigue performance, AA7075-T6, Ti-6Al-4V, AISI 316
Introduction
Fatigue failure is one of the most common failure mechanisms in industry where cyclic loading is experienced, contributing to an estimated 80% of all mechanical service failures (ASM International, 2008). Many such failures result from fatigue cracks initiating at stress concentration sites found on the surface of components (ASM International, 2008). The fatigue life of a component comprises fatigue crack initiation as well as crack propagation, with initiation commonly being related to the surface condition of the component, such as surface finish and the presence of surface or sub-surface defects. To prolong the fatigue life of components, surface treatments can be utilised. Surface treatments aim to achieve one or more of the following: reduction of local stress concentrations, removal or neutralisation of existing defects, or reduction of tensile residual stress through the introduction of compressive residual stress (CRS), (Cui, 2002). Such residual stresses are introduced into the surface layers of the component to increase the number of cycles associated with the crack initiation stage. These local residual stresses (normally compressive) counteract applied stresses (often tensile in nature), thereby delaying the onset of crack initiation. Residual compressive stresses at crack tips and surrounding material can reduce fatigue crack propagation rates, resulting in an overall increase in the fatigue life of the component (Montross, et al., 2002). One of the most effective and widely used surface modification processes is shot peening (SP), which is a cost-effective and robust process. Studies have been conducted into how the shot peening process affects the residual stress (Peyre, 1996; Hammond, 1990). Magnitudes of residual stresses produced by a shot peening process are at least as great as tensile strength of the material being peened (Metal Improvement Company, 2005). However, the SP process itself has limitations (Montross, et al., 2002; Kulekci, Esme, 2014), such as deterioration of surface finish and limited penetration depth of the compressive residual stresses. LSP CRS layer is typically 4-5 times deeper that the depth achieved through traditional SP (Gupta et el., 2017). The laser shock peening process introduces a slightly rougher surface finish to the sample, when compared to SP (Montross, et al., 2002). Surface roughness plays a critical role in the crack initiation stage of the fatigue testing (Montross, et al., 2002). Therefore, it can be important to eliminate surface roughness as a contributing factor to facilitate a direct comparison between laser shock peened (LSP) samples and non-laser shock peened (non-LSP) samples. The induced roughness can be removed before the peened components can be put into service, but Montross, et al. (2002) raised a concern regarding the offset of shot peen induced benefits through the removal of some of the residual stress in the surface layer in the context of SP where the CRS layer is relatively thin. Liu et al. (2017) determined that the benefit of improved surface quality from post LSP polishing may be considered as overriding the disadvantage of a reduced CRS layer thickness if the penetration depths are great enough.
There are increasing demands for lower operational costs, higher safety measures, and better lifetime performance characteristics in industry. As such, significant pressure has been placed on the manufacturing systems and surface processing technologies to produce components that are 'near flawless' and require as few processing steps as possible before completion. One of the surface treatment techniques that has been developed recently, in response to these demands, is laser shock peening (LSP). LSP utilises highspeed and high-energy neodymium lasers to focus short-duration coherent energy pulses onto the surface of the component. A high amplitude stress wave propagates into the material, thereby causing the surface layer to yield in compression, and plastically deform. This localised plastic deformation produces both strain hardening and residual compressive stress at the surface of the laser peened component and extends below the surface of the material (Clauer, 1997), up to a depth of approximately 1 mm (Clauer, 2001) or more. LSP is reported to have a limited minimal effect on the surface roughness of the material (Zhang, 2010; Schubnell, 2023) compared to SP. The extent of roughness changes is directly related to the laser process parameters and the use of a protective coating layer during the LSP process (Zhang, 2010; Schubnell, 2023). The LSP process can be applied to the finished surface of a part or before the final finishing step. Regions inaccessible to SP, such as small fillets and notches, can be treated by being considered for treatment using LSP. The application of LSP to parts where line-of-sight access is available is very straightforward, making it an easy process to use in industry (Holmes, 2013). LSP has been shown to significantly improve the fatigue performances of engineered components (Montross, et al., 2002; Ren et al.). Over and above the benefits to fatigue life, laser shock peening can result in improved performance in wear, corrosion, and stress corrosion cracking for a variety of materials, (Montross, et al., 2002; Abdullahi, 2014). The fatigue life of stainless steel has been investigated by various researchers (Peyre, 1996; Bikdeloo, et al., 2020) and has been shown to improve the fatigue life of components. Bikdeloo et al. (2020) showed that AlSl 316L stainless steel exhibits approximately 125% increase in fatigue life with single LSP layers and 170% with a second layer. Other materials, such as carbon steels, aluminium alloys, titanium alloys, and nickel-based super-alloys have also shown improved fatigue life through the application of LSP, where scanning parameters were investigated in detail (Abdullahi, et al., 2014; Adu-Gyamfi, et al., 2018; Sano, et al., 2006; Correa, et al., 2015]). Other considerations regarding the efficacy of LSP are related to crystal structure and stacking fault energies of the material, as deformation mechanisms differ, thus, affecting the CRS and the microstructure evolution in the affected layer (Deng et al., 2023). The scanning pattern has a marked effect on the efficacy of LSP on fatigue life enhancement. FEM simulations and experimental results by Adu-Gyamfi et al., (2018) have shown that the CRS layer is strongly affected by the LSP scanning patterns in aluminium alloy AA2024 (Adu-Gyamfi, et al. 2018). Three scanning patterns were investigated. While all scanning patterns showed an increase in fatigue life, the highest increase in fatigue life experienced with an L-spiral scanning pattern (Adu-Gyamfi, et al. 2018). While in LSP of AA7075 notched samples in bending fatigue (Peyre et al., 1996), it has been shown that there is a dramatic improvement in the fatigue life with clear differences in the early and later stages of crack growth, where the fatigue life improvements from LSP can be separated into a sevenfold increase in the early crack growth stage and only a three-fold increase in the later propagation stage. For AlSl 316L stainless steel, Correa et al. (2015) found that a fatigue enhancement from LSP can be increased from 166% to 471% by optimising the pulse sequence and scanning pattern, and that greatest improvements were seen when the crack propagation direction is perpendicular to the fatigue load (Correa et al., 2015).
The aim of this work is to assess the effect of LSP on the fatigue life extension for three different high strength, high toughness materials, namely aluminium alloy AA7075, Ti-6Al-4V, and AlSl-316 stainless steel. These materials represent a variety of structures and characteristics, namely a face centred cubic (FCC) material with a high stacking fault energy (SFE), a material with an HCP structure, and an FCC material with a low SFE, respectively. These characteristics will influence the efficacy of the LSP in each case. Therefore, the penetration depth of the LSP induced case hardened layer and its effect on the crack initiation zone are quantified for each material. Through this, the relative material specific efficacy of LSP for fatigue life improvement can be evaluated.
Experimental procedure
Selected materials and fatigue testing set-up
The three materials selected for this investigation were AA7075 aluminium alloy in the T6 condition, Ti-6Al-4V titanium alloy, and AlSl 316 stainless steel alloy. The material was sourced in extruded rod form with varied diameters. To standardise the sample geometry, surface finish and properties, all samples were turned on a lathe to a final diameter of 12 mm and were partitioned to 80 mm in length. Circular cross section samples were chosen to eliminate the effects of laser pulse area overlap (Zhao et al.,2017). During bending fatigue, the specimen span was equivalent to four times the diameter (i.e., S = 4D), which corresponds to dimensions suggested in both the ASTM E1290-02 (ASTM Standard E1290-02, 2002) and E399-90 standards (ASTM Standard E399-90, 1990) for fracture toughness testing, although no Standard specifically makes use of un-notched, cylindrical bend test specimens for fatigue testing.
Laser shock peening and sample surface roughness
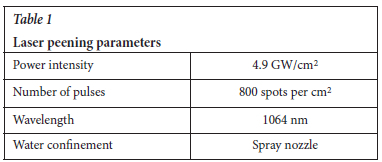
The laser shock peening process parameters are shown in Table 1 The laser shock peening parameters for each material were tested on typical Almen strips to determine the correct saturation intensity.
The non-LSP samples were polished for 10 seconds with 1200 grit paper, where the samples were rotated relative to the grinding media. The samples were polished to a surface finish corresponding to Ra of 0.2 micron prior to testing using diamond impregnated lubricant and cloth on a rotating sample. The surface roughness values were determined using a profilometer. The LSP process, performed on polished samples, introduces shallow, homogeneous dimples onto the surface of the specimen, related to the laser parameters. These dimples produced an Ra of 2.28 micron. To eliminate the effects of surface roughness on the fatigue life data, a number of the LSP samples were briefly polished after peening, to achieve a surface finish Ra of 0.2 micron. This small amount of polishing was assumed to contribute negligible surface hardening on the samples relative to the LSP process and was thus, not included as part of the case hardening investigation. AA7075-T6 samples were used to evaluate the effect of surface finish on fatigue life, and fatigue testing was performed on three conditions: (i) as-polished, non-LSP, (ii) LSP and, (iii) LSP-polished. For the titanium and stainless-steel samples, the tests were performed on as-polished non-LSP and LSP-polished (where the surface was polished to achieve a surface roughness of the order of 0.2 micron).
LSP penetration depth: hardness profiles and fracture surface analysis
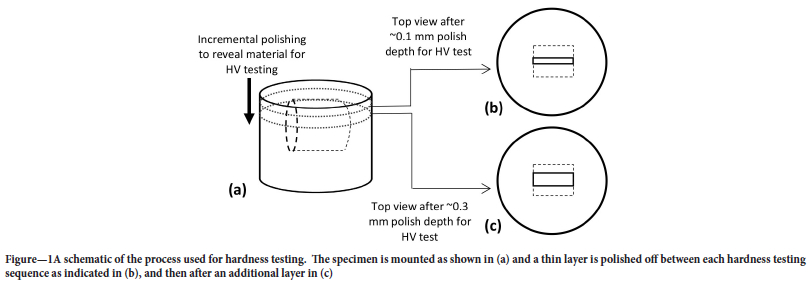
The depth of penetration of the LSP and the CRS layer thickness was determined from a combination of hardness testing and fracture surface analysis. Incremental micro hardness measurements were taken at increasing surface depths on unfatigued specimens through successive polishing and indentations to obtain a hardness profile for increasing depth from the surface. Longitudinal sections of the test specimens, of a length L (between 15 mm and 20 mm) were mounted in resin with their surfaces parallel to their cylindrical axes exposed from the resin and incrementally polished, removing a surface layer of nominally 3 μm thick per polish step. A schematic of this process is shown in Figure 1 This process of polishing the surface of the specimen, measuring the thickness of the mount, and then making several HV indents on the surface, using the full length of the mounted specimen is used to increase the number of indents for each depth to improve statistical uncertainties in HV number. This increase in polishing depth is repeated until the total depth of polishing is approximately 1 mm, or where a sudden decrease in hardness was achieved consistently, indicating the end of the LSP penetration depth.
Determination of penetration depth through fracture surface analysis was performed through fractography on the fracture surfaces themselves and through crack path analysis on cross-sections through samples after failure. The fractography analysis included the identification of ductile and brittle features, crack initiation sites (surface or sub-surface). For crack path analysis, samples representing a section through the fracture surface (i.e., perpendicular to the fracture surface) of the failed samples were cut, mounted, ground, and polished to a colloidal silica finish in preparation for viewing using light microscopy with a Nomarski prism. Rounding of the polished edges is due to the polishing process resulting in poor edge retention between the sample edge and the mount resin, but this did not affect the interpretation of the crack path. Light micrographs allowed for the analysis of the crack path in the various materials and conditions. A deviation in the crack path is expected at a point corresponding to a sudden change in residual stress, such as the limit of the LSP penetration depth on the crack initiation side and the final fracture side of the samples.
Fatigue performance
The fatigue performance of the various test specimens was evaluated under cyclic loading using a 100 kN electro-servo hydraulic fatigue machine (ESH) at the University of Cape Town, Centre for Materials Engineering. Test specimens of all materials, in both the LSP and non-LSP conditions, were fatigued to failure using a 3-point bending system at a constant amplitude bending stress. The testing frequency was set at 10 Hz using a sinusoidal wave at a stress ratio (R) of 0.1.
For the AA7075-T6 material, the initial stress estimate used to calculate the required load for the fatiguing of the test specimens in the T6 material condition was determined by looking at stresses used to generate S-N curves for AA7075-T6 found in literature. An incremental bending fatigue approach was then implemented to adjust incrementally the stress level to a level at which crack initiation occurred at a desirable cycle count of approximately 30 000 cycles. Based on the superimposed curve, a fatigue life of 30 000 cycles could be achieved somewhere in the applied stress range of 482 MPa to 551 MPa, achieved through incremental increases in the fatigue testing stress level. A final stress of 585 MPa was found to result in specimens failing at approximately 30 000 cycles, and this stress was kept constant for the test specimens in their respective material conditions regardless of the surface treatment that they had received. The stress level of 1080 MPa was used for Ti-6Al-4V and 1150 MPa for AISI 316 stainless steel, both calculated using Equation 1.
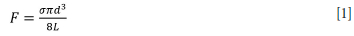
Where d is the diameter of test specimen, L is the span length and σ is 90% of ultimate stress (σUTS). This consistent equivalent stress level allowed the effects of the varying surface treatments on the fatigue lives of the test specimens to be determined.
Microstructure observations and fractography
The cross section through the fracture surface of the failed samples was viewed to analyse the crack path in the different materials using light microscopy, where any changes in the crack path direction in the region corresponding to the CRS and LSP penetration depth was evaluated. The study did not focus on crack initiation sites. Fractography was performed using an FEI NovaNano SEM scanning electron microscope (SEM) to examine the fracture surfaces of the samples in the LSP and non-LSP conditions. Characteristic features identified on the fracture surfaces during fractography were related to the failure modes and the influence of the laser peened layer of material at the surface.
Results and discussion
Laser shock peening penetration depth for all materials
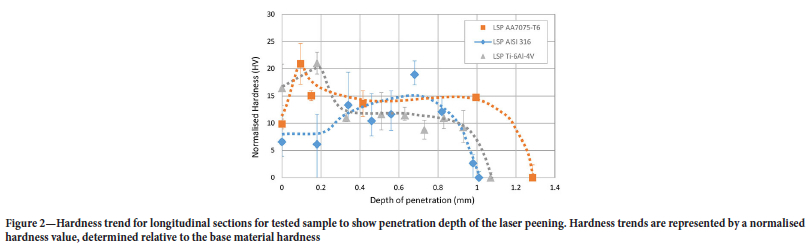
The hardness results from the longitudinal sections of the test specimens were plotted. The schematic in Figure 1describes the experimental approach for hardness mapping. In the AA7075-T6 condition, the surface hardness was 185 HV, with a drop-off to 167 HV after 1.2 mm depth. In the Ti-6Al-4V the hardness was 334 HV at the surface that extended to a depth of 0.2 mm, a subsequent decrease to approximately 320 HV until 0.95 mm, and a drop to 309 HV beyond 1 mm. For the AISI 316, the hardness gradually increased from 281 HV at the surface to 294 HV at a depth of 0.65 mm, and then rapidly decreased to a hardness of 275 HV at a depth of 1 mm. The normalised hardness is defined here as the change in hardness value (ΔHV) relative to the measured hardness of the parent material, where the parent material hardness is the hardness unaffected by the LSP. The normalised hardness profiles are presented in Figure 2 The penetration depth for all three materials is of the order of 1 mm, and this result is consistent with results documented by Clauer (1997; Clauer 2001). The penetration depth would be expected to increase with an increasing number of passes of the laser peening, as was shown by Zhou et al. (2023) in the case of AA7075 over a range of laser process parameters and passes (ASTM Standard E399-90, 1990).
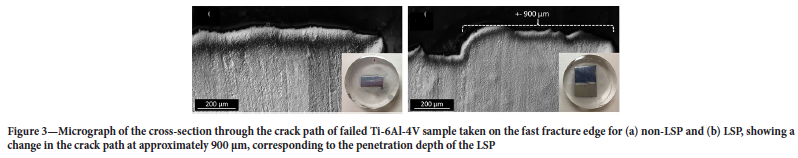
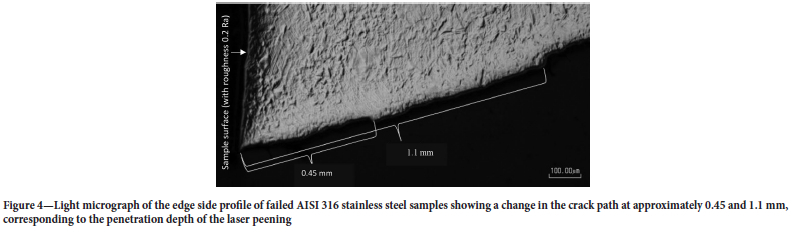
The fracture surface cross section of the failed samples was studied to identify the presence of crack path. Directional changes were attributable to a change in the properties of the material. This property change is directly related to the transition between the LSP-affected material and the parent material. Figure 3shows the cross section through a failed Ti-6Al-4V sample, while Figure 4shows an equivalent AISI316 stainless steel sample. The image shows the fast fracture edge of the samples (as opposed to the crack initiation side) as the effect of a property change was more pronounced on the side of the sample. The non-perpendicular angle of the fracture surface to the surface edge is a result of the compression curl (Quinn et al. 2005). There is a noticeable deviation in the crack path for both the Ti-6Al-4V and the AISI 316 samples, as shown in Figure 3and Figure 4 respectively. The crack path deviation typically corresponds to the change in properties at the transition of the case depth of the LSP. The measured depth at the step in the crack path is approximately 1 mm in both cases. This indicates a change in the residual stress of the material attributed to the residual stresses associated with the penetration depth of the LSP. These depths correspond to the depth measured with hardness results as illustrated in Figure 2 Similar depths of penetration for AA7075 are reported by Zhou et al. (2023), for Ti-6Al-4V by Dyer et al. (2024) and for stainless-steel by Wu et al. (Wu, et al., 2023).
Fatigue performance
Aluminium AA7075 - Effect of laser peening on fatigue life
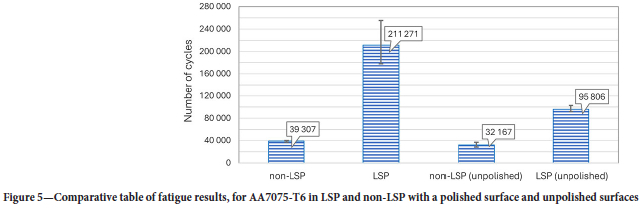
The results of the fatigue testing for AA7075 in four different conditions can be seen in Figure 5 The four different conditions represent the effect of laser peening on polished AA7075-T6 samples and the effect of laser peening on unpolished samples. From these results we can determine the effect of laser peening on the fatigue life of AA7075 in the T6 aged condition.
The AA7075 samples in the non-laser shock peened condition (non-LSP) failed after an average of approximately 39 000 cycles, while the samples that had undergone laser shock peening achieved a maximum of approximately 211 000 cycles. This is an improvement of more than five times with the application of laser shock peening. These results are for samples with the same equivalent surface roughness value, Ra, of approximately 0,2. This was achieved by polishing the samples before and after laser shock peening.
Aluminium AA7075 - Effect of surface roughness on fatigue life
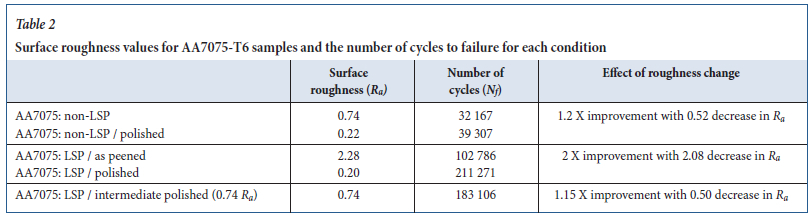
The effect of surface roughness is determined by identifying the number of cycles to failure in the fatigue test results on laser shock peened and non-laser shock peened samples in the polished and unpolished conditions. The results are also shown in Figure 5 The surface roughness values are shown in Table 2 The table also shows the number of cycles to failure associated with each condition and the calculated improvement in fatigue life with the improved surface roughness owing to polishing.
For samples that have not been exposed to laser peening, there is an improvement of approximately 1.2 times in the fatigue life with a decrease in Ra from 0.74 to 0.22. For samples that have been laser shock peened, in the as-peened condition there is a surface roughness of 2.28, which results in a fatigue life of 102 700 cycles. After peening followed by surface polishing to improve the Ra to 0.2, there is an improvement of the fatigue life in the order of about twice the fatigue life. This shows that surface roughness does play a very important part in the fatigue life, but also shows that the change in surface roughness does not fully account for the improved fatigue life after laser shock peening, where, for the equivalent roughness values, the un-peened material exhibits an 18% improvement, while the peened exhibits a 44% improvement.
Titanium alloy Ti-6Al-4V
The fatigue life data for Ti-6Al-4V can be found in Figure 6 The fatigue life for Ti-6Al-4V with no laser peening was approximately 27 000 cycles, while after laser peening the fatigue life improved by more than five times, to approximately 143 300 cycles. This shows that titanium alloy Ti-6Al-4V responds very well to laser peening in the context of fatigue life extension, with a 5.3 times larger fatigue (81%). This is a far greater increase than the 22.2% increase documented by Zhang et al . (2010). The discrepancy between this work and Zhang may be due to a number of contributing factors, namely, the surface roughness, which is not explicitly stated in the work by Zhang et al. (2010), the testing parameters of the different tests, where the load fatigue force ratio was 0.3 as opposed to the 0.1 from this present work, or the underlying microstructure of the material, which had been specially heat treated to provide a bi-modal starting structure by Zhang et al. (2010). The difference in fatigue life increase owing to LSP may also be a result of a combination of the afore-mentioned effects.
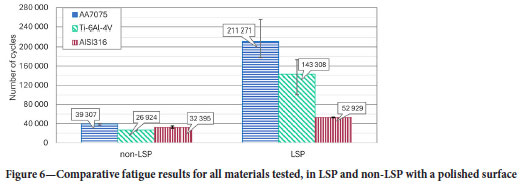
Stainless steel AISI316
The fatigue life data for AISI 316 stainless steel can be found in Figure 6 The non-laser peened fatigue life was found to be approximately 32 400 cycles, while after laser peening this improved by 1.63 times to nearly 53 000 cycles. A similar investigation by Stamm et al. (1996) into the high cycle fatigue behaviour of austenitic stainless steel AISI 316L showed an increase in the fatigue life of 1.2 times. This is slightly lower than the 1.6 increase seen in this present investigation. This difference may be attributed to the fact that Stamm et al. (1996) did not polish the as-peened surface prior to fatigue testing. The increase in the fatigue life does indicate the relative effectiveness of laser shock peening on stainless steel. The reduced impact of LSP on fatigue life in FCC materials with low SFE has been highlighted by Deng et al., 2023 and is associated with dislocation mobility and twinning mechanisms in low SFE austenitic stainless steels.
Fractography
The fracture surfaces of the as-received and the laser shock peened tested samples were analysed and compared. For each tested sample and processing regime, images were captured in the crack initiation region; the crack propagation region within 1 mm of the edge of the specimen; the crack propagation region beyond the LSP case depth; and finally, within the fast fracture region.
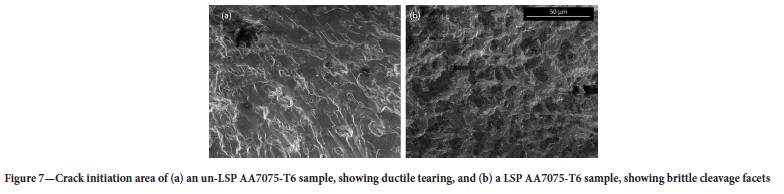
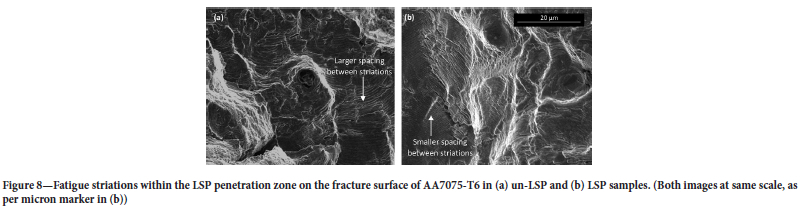
The fractographic images revealed that the specimens subjected to LSP were indeed more brittle in the LSP zone than the non-LSP specimens, as can be seen in Figure 7 This was indicated by brittle fracture characteristics, such as cleavage facets in Figure 7(b) for the non-LSP specimenAA7075-T6 and a smoother fracture surface. The spacing between fatigue striations on the fracture surfaces in the as-received specimens appear to be far greater than the spacing between fatigue striations in the LSP specimens, as seen in Figure 8(a) and Figure 8(b), respectively. The difference in fatigue striation spacing is in agreement with the results of Ren et al, (2013).
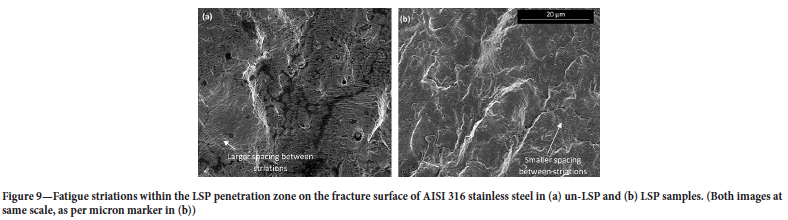
Measuring the distance between striations, it was found that the spacing in the as-received 7075-T6 is approximately 1.1 μm, while the spacing in the LSP 7075-T6 is approximately 0.4 μm. The smaller spacing implies a more brittle material that develops because of compressive residual stress and the reduced dislocation mobility owing to LSP (Ren et al., 2013). A similar trend can be seen in Figure 9for AISI 316 where, by performing an approximate measurement of the distance between fatigue striations on the micrograph, it was found that the measured spacing between striations in the as-received specimen is approximately 0.7 μm, whereas the measured spacing between the striations in the LSP specimen is approximately 0.3 μm. Thus, the specimen that has been subjected to LSP is more resistant to crack growth than the as-received specimen, indicating that there is greater residual stress in the LSP zone.
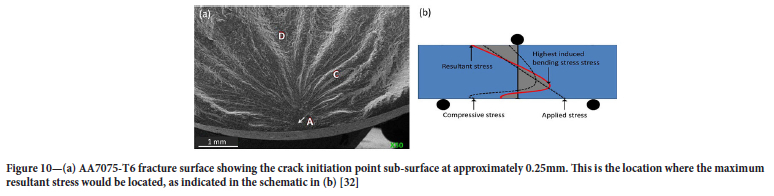
The fractography in Figure 10 (a) shows an AA7075-T6 sample where the crack initiation site is sub-surface, at 0.3 mm away from the surface (the annotations A, C, and D represent crack initiation site, cleavage and dimpled fracture surface (ductile tearing), respectively). The applied bending stress combines with the peening induced residual stress, creating a resultant stress profile, where the highest tensile stress on the profile is just below the surface hardened layer, as shown in Figure 10 (b). The schematic diagram in Figure 10 (b) illustrates the combined residual LSP stress and pure bending stress, two triangles across the bending section representing tension on the side opposite the load point of 3-point bending, and compression on the opposite face. The schematic also indicates the presence of the residual stress from peening, which is compressive but is limited to a narrow subsurface depth. The LSP CRS layer tapers away deeper, but still within a confined layer close to the surface, into the material towards the neutral axis, where the tensile bending stress begins to dominate. The resultant of the two stresses reduces the surface tensile stress substantially and puts the peak tensile stress at some point inside the surface from which the crack initiates and radiates. After some fatigue loading, there is no evidence of a surface crack, as it is growing radially from this highest stress regime sub-surface. Suddenly the crack breaks through the surface and at this point, the sample goes from having no noticeable surface crack to having a visible surface crack driven by the growth of an internal crack of between 5 mm to 10 mm long, showing that it grew from the inside radially in all directions and finally broke through the surface.
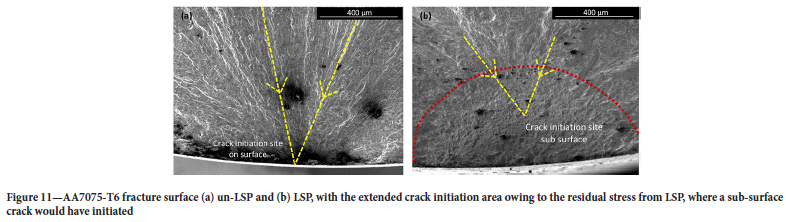
Figure 11 (b) shows that, in the aluminium LSP specimens, crack initiation occurred just beneath the surface of the specimen, as opposed to at the surface in the non-LSP sample in Figure 11 (a), where the crack initiation point is clearly at the surface and would be the result of typical persistent slip banding as part of the initiation process. In Figure 11 (b), the chevron marks point to the crack initiating at the edge of the transition area where there is a change in the residual stress in the material, which corresponds to approximately 0.8 mm. The expansion of the initiation region after LSP indicates that for samples that have been exposed to laser shock peening, many fatigue cycles are spent on the crack initiation phase before crack propagation occurs in a steady state manner. Figure 6shows features on the fracture surface within the crack initiation region for AA7075-T6 and highlights the change in the material because of the LSP process. The LSP sample exhibits cleavage facets on the fracture surface, which are features associated with brittle materials, while the non-LSP sample exhibits dimples, which are typical ductile features. This same trend was seen in both the Ti-6Al-4V and the AISI 316. However, in the titanium and stainless steel the crack initiation region was smaller than that of the aluminium alloy. The change in depth of the transition region is also illustrated in the hardness profiles in Figure 2 This indicates that materials have different susceptibilities to the effects of the LSP process. The susceptibility is related to the crystal structure and the SFE of the material, which dictates the slip planes available for deformation and the mobility of the dislocations under load.
Conclusions
Laser shock peening (LSP) significantly enhances the fatigue performance of various materials. The efficacy of LSP is approximated by the relative increase in fatigue life for the peened versus non-peened conditions. Three materials were considered, aluminium AA7075-T6, an FCC material with a high SFE, AISI 316 austenitic stainless steel, an FCC material with a low SFE and Ti-6Al-4V, and an HCP and BCC two-phase structure. All three materials are considered ductile, high strength materials with good corrosion resistance properties. The results indicate that aluminium AA7075-T6 with an FCC structure and a high SFE responds best to LSP and shows the greatest increase in fatigue life in the LSP condition.
The main findings of the work are summarised below:
> In the case of aluminium alloy AA7075-T6, LSP extended fatigue life by more than five times when the surface roughness was polished to an R_a of 0.2 microns, matching that of the non-LSP sample.
> For as-LSP treated AA7075-T6, the surface roughness was measured at 2.28 microns, and this untreated roughness still resulted in a 4.1-fold increase in fatigue life. When the surface roughness was equalised at 0.2 microns, LSP improved the fatigue life of AA7075-T6 by 5.4 times. This indicates that reducing the surface roughness-without compromising the LSP-induced case depth-is key to maximizing fatigue life across different materials.
> For titanium alloy Ti-6Al-4V and AISI 316 stainless steel, LSP increased fatigue life by 5 times and 1.7 times, respectively. This demonstrates that titanium alloy Ti-6Al-4V and aluminium alloy AA7075-T6, both ductile at room temperature, are far more responsive to LSP than AISI 316 stainless steel.
> Results indicate that the improvement in fatigue life can be attributed to the residual compressive stresses induced by LSP (although not quantified in this work), rather than the penetration depth, which was approximately 1 mm for all three materials tested.
> LSP samples exhibited a notable expansion in the crack initiation zone for all materials and a sub-surface crack initiation point, as evidenced by the features on the fracture surfaces.
Future work in this area must include quantification of the compressive residual stress in each material and the dislocation structures in the CRS layer that are linked to crystal structure and dislocation mobility.
In conclusion, LSP is an effective method for improving the fatigue life of components made from aluminium AA7075-T6, titanium Ti-6Al-4V, and AISI 316 stainless steel. However, the degree of improvement varies between materials, with some being more susceptible to the benefits of LSP-induced compressive residual stress, which penetrates up to 1 mm into the material.
Acknowledgments
Acknowledgments to Daniel Glaser at the National Laser Centre (NLC) at the Council for Scientific and Industrial Research (CSIR) in South Africa for the laser peening of the investigated samples, and to the Electron Microscope Unit (EMU) at the University of Cape Town for the use of the electron microscopes and operator guidance by Miranda Waldron.
References
Abdullahi, K., GujbaK., Medraj, M. 2014. Materials vol. 7, pp. 7925-7974. [ Links ]
Adu-Gyamfi, S., Ren, X.D., Larson, E.A., Ren, Y., Z. Tong, Z. 2018. Optics and Laser Technology, vol. 108, pp. 177-185. [ Links ]
ASM International. 2008. Elements of Metallurgy and Engineering Alloys, Becker , A. 2016. MSc Thesis , UCT. [ Links ]
ASTM Standard E1290-02 (2002). [ Links ]
ASTM Standard E399-90 (1990). [ Links ]
Bikdeloo, R., Farrahi, G.H., Mehmanparast, A., Mahdavi, S.M. 2020. Theor Appl Fract Mec, vol. 105, p. 102429, [ Links ]
Clauer, A. 1997. Laser shock peening for fatigue resistance. [ Links ]
Clauer, A., D. Lahrman, D. 2001. Key Engineering Materials - Key Eng Mat 197, pp. 121-144. [ Links ]
Correa, C., Peral, D., Porro, J.A., Díaz, M., Ruiz de Lara, L., García-Beltrán, A., J.L. Ocaña, J.L. 2015. Optics & Laser Technology, vol. 73, pp. 179-187. [ Links ]
Cui, W. 2002. Journal of Marine Science and Technology. pp.43-56. [ Links ]
Deng, W., Wang, C., Lu, H., Meng, X., Wang, Z., Lv, J., Luo, K., J. Lu, J. 2023. Int. J. Mach. Tools Manuf., vol. 191, p. 104061. [ Links ]
Dyer, K., Ghadar, S., Zulic, S., Rostohar, D., Asadi, E., Molaei, R. 2024. Coatings, vol. 14. [ Links ]
Gupta, K., Jain, N.K., Laubscher, R. 2017. (Eds.), Advanced Gear Manufacturing and Finishing. Academic Press, pp. 127-165. [ Links ]
Hammond, D.W., Meguid, S.A. 1990. Engineering Fracture Mechanics, vol. 37, pp. 373-387. [ Links ]
Holmes, T. 2013. MSc Thesis, University of Cape Town, Cape Town [ Links ]
Kulekci, M.K., Esme, U. 2014. The International Journal of Advanced Manufacturing Technology vol. 74 pp. 1551-1565. [ Links ]
Liu, Z.G., Wong, T.I., W. Huang, W. 2017. Acta Metall. Sin. (Engl. Lett.), vol 30, pp. 630-640. [ Links ]
Metal Improvement Company. 2005. Shot Peening Applications Ninth Edition. Ed. by Unknown. pp. 4-6. [ Links ]
Montross, C.S., Wei, T., Ye, L., Clark, G.,Mai, Y.-W. 2002. International Journal of Fatigue vol. 24, pp.10218-1036. [ Links ]
Peyre, P., Fabbro, R., Merrien, P., Lieurade, H.P. 1996. Materials Science and Engineering: A 210 pp. 102-113. [ Links ]
Quinn, J.B., Quinn, G.D., Robert Kelly, J., Scherrer, S. 2005. Dental Materials, vol. 21, pp. 920-929. [ Links ]
Ren, X.D., Zhang, Y.K., Yongzhuo, H.F., Ruan, L., Jiang, D.W., Zhang, T., Chen, K.M. 2011. Materials Science and Engineering: A, vol. 528, no. 6, pp. 2899-2903. [ Links ]
Ren, X.D., Zhan, Q.B., Yang, H.M., Dai, F.Z., Cui, C.Y., Sun, G.F., Ruan, L. 2013. Materials and Design, vol. 44pp. 149-154. [ Links ]
Sano, Y., Obata, M., Kubo, T., Mukai, N., Yoda, M., Masaki, K., Ochi, Y. 2006. Materials Science and Engineering: A 417, pp. 334-340. [ Links ]
Schubnell, J., Carl, E.-R., Sarmast, A., Hinterstein, M., Preußner, J., Seifert, M., Kaufmann, C., Rußbüldt, P., J. Schulte, J. 2023. Materials, vol. 16, p. 6769. [ Links ]
Stamm, H., Holzwarth, U., Boerman, D.J., Marques, F.d.S., Olchini, A., Zausch, R. 1996. Fatigue and Fracture of Engineering Materials and Structures, vol. 19, pp. 985-995. [ Links ]
Wu, J., Ding, W., Zhai, Y., Qiao, H., Zhao, J., Mao, Z., X. Chen, X. 2023. Wear 522. p. 204836. [ Links ]
Zhang, X.C., Zhang, Y.K., Lu, J.Z., Xuan, F.Z., Wang, Z.D., Tu, S.T. 2010. Materials Science And Engineering A-Structural Materials Properties Microstructure And Processing vol. 527, pp. 3411-3415. [ Links ]
Zhang, X.C., Zhang, Y.K., Lu, J.Z., Xuan, F.Z., Wang,Z.D., Tu, S.T. 2010. Materials Science and Engineering: A 527. pp. 3411S.T.3415. [ Links ]
Zhao, J., Dong, Y., C. Ye, C. 2017. International Journal of Fatigue, pp. 407-417 [ Links ]
Zhou, L., Zhu, C., Yuan, H., Mei, X., Jiang, J., Lu, Z. 2023. Opt. Express vol. 31, pp. 18039-18049. [ Links ]
 Correspondence:
S.L. George
Email: sarah.george@uct.ac.za
Received: 13 May 2021
Revised: 20 Aug. 2022
Accepted: 25 Apr. 2025
Published: July 2025
