


Services on Demand
Journal

Article
 English (pdf)
 Article in xml format
 Article references
 Send this article by e-mail
Indicators
Related links
-
 Cited by Google
 -
 Similars in Google
Share

 Permalink
Journal of the Southern African Institute of Mining and Metallurgy
On-line version ISSN 2411-9717Print version ISSN 2225-6253
J. S. Afr. Inst. Min. Metall. vol.125 n.1 Johannesburg Jan. 2025
https://doi.org/10.17159/2411-9717/3460/2025
PROFESSIONAL TECHNICAL AND SCIENTIFIC PAPERS
Seismicity evolution and rockburst control in the Merensky Reef and UG2 orebody: An intermediate depth platinum mine case study
R.T. MasetheI; S. DuraprajII; U. MaqinaII; A.C. AdokoIII
ICollege of Agriculture, Engineering and Science, University of KwaZulu-Natal, Westville, Durban, South Africa. ORCiD: http://orcid.org/0000-0002-4420-7885
IIRock Engineering Department, Sibanye Stillwater PGM, Rustenburg, South Africa
IIISchool of Mining and Geoscience, Nazarbayev University, Astana, Kazakhstan. ORCiD: http://orcid.org/0000-0003-1396-7811
ABSTRACT
This study investigates seismicity and rockburst control within the Merensky Reef and UG2 orebody of an intermediate-depth platinum mine located in South Africa's Bushveld Complex. Utilising a mine-wide seismic monitoring system, over 1,900 seismic events were recorded between April 2023 and May 2024, revealing complex seismic patterns driven by mining-induced stress changes. The largest event, with a magnitude of ML 2.0, underscores the seismic risks associated with mining at increasing depths. Key findings include the spatial and temporal variability of seismic events, with high seismic activity observed near pillars and geological structures. A significant portion of events correlated with pillar and foundation failures. Moment tensor analysis identified dominant failure modes, such as stress-driven fracture closures and dynamic pillar failures. To mitigate risks, the study emphasises advanced support system redesign and rockburst risk assessment using the rockburst damage potential (RDP) method. The research highlights the importance of monitoring, geotechnical compliance, and adaptive designs in enhancing safety and reducing seismic hazards in underground mining operations. The study applied the RDP framework, classifying damage across R1 to R5 scales, where most instances fell into low-risk categories (R1 and R3), indicating minor to moderate damage. However, data limitations and the tabular stoping method's complexity led to inconclusive results, highlighting the need for more robust data and customised risk assessment tools. Despite these challenges, the RDP approach provided valuable insights into rockburst mechanisms and the effectiveness of existing support systems.
Keywords: rockburst, forecast, hazard, risk, monitoring, seismic event
Introduction
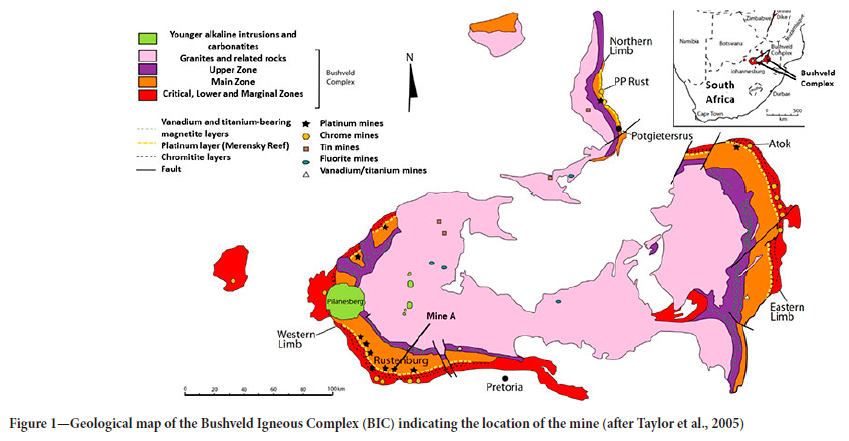
Rock mass instabilities represent the single most significant cause of injuries and fatalities suffered by the workforce in South African gold and platinum mines. The severity of rockbursts in platinum mines has increased as excavations have deepened. We present a case study of a mine located on the western limb of the Bushveld Complex in the Northwest province of South Africa, near the town of Rustenburg and about 80 km from Pretoria (Figure 1). The mine produces platinum group minerals (PGM) and covers an area of 33 km2. Two reefs are exploited, namely the Merensky Reef (pegmatoidal pyroxenite) and the UG2 (chromitite). Both reef horizons occur stratigraphically in the Upper Critical Zone of the Rustenburg Layered Suite (Kruger, 2005).
The study is motivated by the increasing seismic risks associated with mining at intermediate depths, particularly in platinum mines within the Bushveld Complex. These operations face challenges similar to those of deep-level gold mines, including seismicity and rockburst hazards. The purpose of the study is to:
> Understand the evolution of seismicity in the Merensky Reef and UG2 orebody.
> Enhance safety through improved support designs and seismic monitoring.
> Develop predictive tools for assessing and mitigating rockburst risks, ensuring operational efficiency and personnel safety.
The methodology combined seismic monitoring using a network of nine tri-axial geophones to record over 1,900 events with advanced analyses, including moment tensor inversion for failure mechanisms and the rockburst damage potential (RDP) method to assess rockburst risks. Additionally, the study evaluated and redesigned rock support systems to enhance resilience under both quasi-static and dynamic seismic conditions. A support system evaluation analysed existing and redesigned rock support systems for quasi-static and dynamic conditions to improve resilience against seismic events.
Geology and geotechnical setting
The strata and reefs strike ~east-west and generally dip between 8°N in the west, progressively increasing to 13°N in the far east. The planar continuity of the orebody is impeded by geological structures, such as faults, dykes, potholes, rolling reefs, secondary geologic structures (jointing, layer-parallel, and ramp structures), and iron-rich ultramafic pegmatites.
The UG2 chromitite reef occurs as a narrow tabular layer approximately one meter thick that dips towards the north at an average of 9° in the intermediate-depth platinum mine. The UG2 is mined between 837 m and 1287 m below the surface, displaying minor lateral thickness variation. Stress measurements on 31 level (1200 m) indicated that the horizontal stress (86.8 MPa) magnitude was more than the vertical stress (51.3 MPa), i.e., a high k-ratio = 1.7. The hangingwall pyroxenite unit contains chromitite markers, known as the UG2 markers, forming a plane of low cohesion 0.1 m to 2.4 m above the UG2 Reef (Figure 2). The base of the UG2 Reef is represented by a coarse feldspathic pegmatoidal pyroxenite, which varies in thickness from 0.1 m up to 1 m and forms cusps in contact with the overlying chromitite.
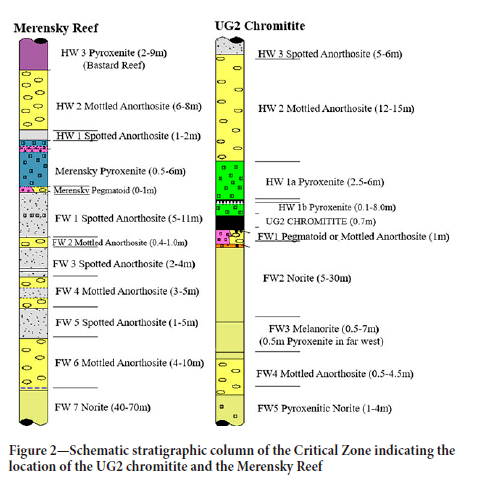
The Merensky Reef (MER) is a regular, persistent tabular orebody with various layers: pegmatoid, chromitite, and pyroxenite (Lougher and Mellowship, 1991). It is generally composed of an upper feldspathic pyroxenite assemblage near the top of the Upper Group of the Upper Critical Zone of the Bushveld Complex. It overlies a thin basal chromitite stringer, followed by an anorthosite to norite footwall and a thin anorthosite layer (0.1 m to 0.2 m thick), which is underlain by norite (Figure 2). Locally, this is termed a 'pyroxenite reef.' The Merensky pyroxenite is mined between 787 m and 1267 m below the surface.
The geological features within the mine include a significant density of minor throw faults with near vertical dip angles and a low density of large throw structures. Seismic activity is variable, but information is currently inadequate to distinguish between the influence of fault density and extraction rates. One cannot infer that the absence of major regional faults leads to lower seismic activity and associated risk.
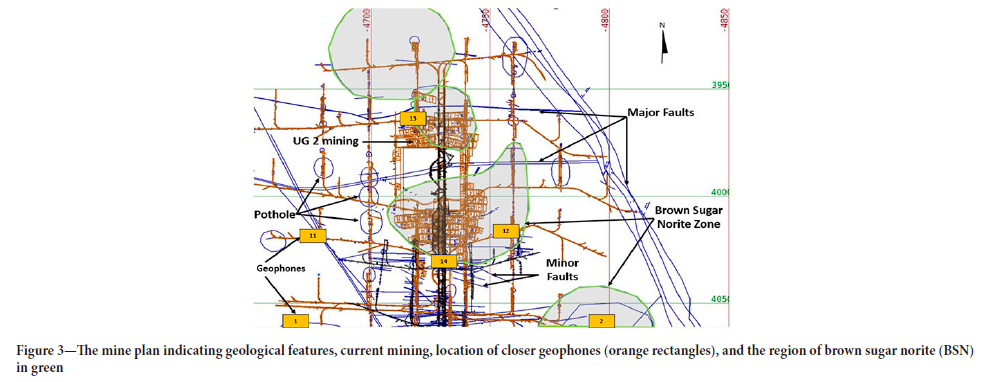
Rock mass instability is driven by extraction rate, rock mass properties, depth (stress), and geological structures. Furthermore, occasional noritic lenses within the pyroxenite of the Merensky Reef, locally termed 'brown sugar norite, (BSN) also pose a risk (Figure 3). The BSN is a fine-grained mela-gabbronorite and only occurs where the upper chromite stringer of the Merensky Reef unit is present (Beukes, 2014). The BSN is not laterally consistent and might be overlooked due to its similarities to Merensky Reef pyroxenite (Beukes, 2014). Figure 3 shows a typical section of the mine where BSN lenses, potholes, and faults pose mining challenges.
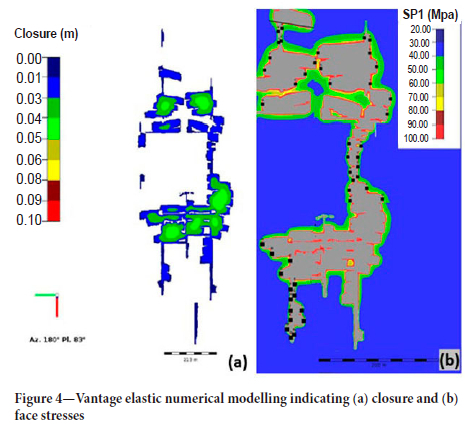
According to the classification of Jager and Ryder (1999), it is an intermediate-depth mine. It is associated with a virgin stress state of 25-60 MPa, moderate stope closure of approximately 10-30 mm/m face advance (Figure 4a), and a moderate to severe rockburst hazard. Elastic modeling indicates face stresses up to 90 MPa.
Seismicity and the analysis at the intermediate depth platinum mine
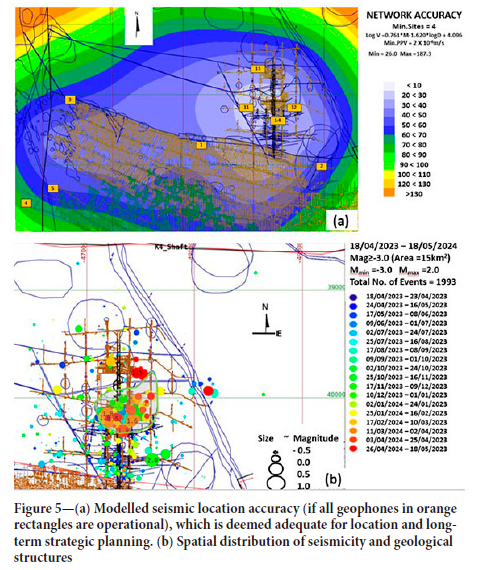
The mine-wide seismic system captured the seismic data. This system comprises 9 4.5 Hz tri-axial geophones sampling at 6 kHz installed at locations surrounding the Merensky and UG2 reef planes (Figure 3). The seismograms determine P- and S-wave arrival times and calculate the relevant source parameters: origin time, location, energy, moment, magnitude, and stress drop. From 18 April 2023 to 20 May 2024, the system recorded 1993 mining-related seismic events (-3 < ML < 2), which are located with an accuracy of 30 m at best (Figure 5a). The largest seismic event recorded is M2.0, located on a solid containing a very small fault. The depth of these seismic events ranges from 450 m to 1451 m. These seismic events occurred near the MER stopes (Figure 5b).
Since the establishment of the seismic system, the mine has been able to capture seismic data to such an extent that an increase in seismicity is noted. This presents the potential for an increased risk to the safety of mine personnel and a higher probability that mine infrastructure may be damaged. The number and magnitude of seismic events will likely increase with the extraction of the Merensky Reef at increasing mining depths (Gay et al., 1995).
Though the shaft mining MER and UG2 chromitite is relatively new, it is already experiencing challenges similar to deep-level gold mines in the Witwatersrand basin. Aref et al. (1994) concluded that the relationship between seismicity and mining activity varies from area to area. Different areas of this shaft are experiencing different levels of seismicity (Figure 5b). More large seismic events are observed in the BSN zone than in other areas within the mine, though face stresses are moderate (Figure 3).
Diurnal distributions
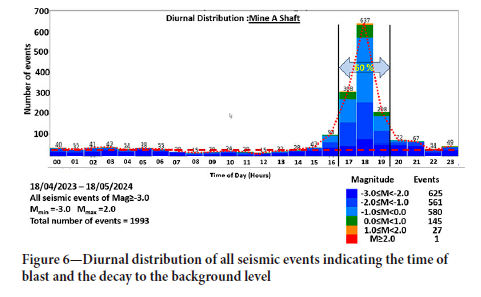
The diurnal distribution indicates the pattern of seismicity and is an additional method of assessing the workforce's exposure to seismic activity. Seismic events in the lower magnitude range (less than approximately ML1.5) are generally accepted to be associated with stress changes near an active working panel and tend to occur very soon after blasting. Exposure of the workforce to such events is limited by concentrating blasting in a short time window, i.e., by centralised blasting. As previously observed by Haile and Jager (1995), we found that most near-face events occur during blasting time and that seismic activity quickly decreases to background levels (Figure 6). However, larger events are driven by regional stress redistribution and may occur at any time of the day. Larger-magnitude events, which tend to occur outside the blasting time, were associated with observed pillar failures (due to pillar dimensions) and pillar foundation failures (due to a softer hangingwall or footwall). Durrheim et al. (1997) concluded that the level of seismic activity in the Bushveld Complex is a function of many factors, including the regional support system, size and spacing of pillars, geotechnical conditions, depth of mining, and stress regime.
Spatial distribution of seismicity
The mine seismic system recorded 1,993 Ml > -3.0 seismic events between April 18, 2023, and May 18, 2024:
> The biggest seismic event was Ml >2.0, located on or very close to the reef plane and associated geological structures.
> Ninety percent (90%) of the Ml > 0.0 seismic events are located within the brown sugar norite zone.
> Of the 27 seismic events with 1.0 < Ml < 2.0 located in, or very close to, the reef plane, 70% correlate with pillar foundation failure and bursts, and 30% are associated with other mining elements.
> Of the 431 seismic events that have 0.0 < Ml < 1.0, 75% are associated with pillar bursts and the remaining 25% are a mix of events associated with geological features, pillar failures, and/or pillar foundation failures.
> 1,535 seismic events have -3.0 < Ml< 0.0. They are primarily located within active stopes faces. These small events also pose a risk to workers, since preconditioning has not yet been implemented.
Moment tensor analysis
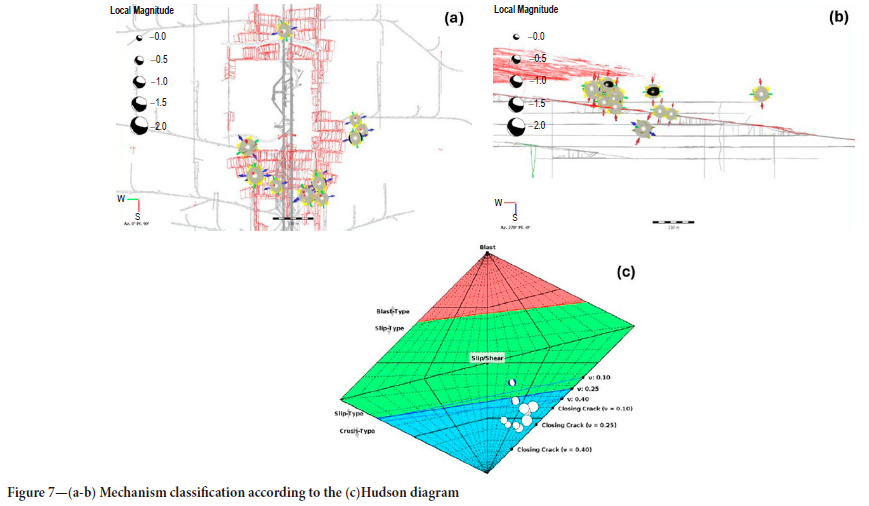
Different authors have routinely performed the moment tensor inversion, (e.g., Aki and Richards, 2002; Ben-Menahem and Singh, 1981; Jost and Herrmann, 1989; McGarr, 1992; Andersen, 2001). It is the best approach when studying mining-induced seismic event modes of failure (Gibowicz, 1993). Understanding the many failure modes in the UG2 chromitite mining environment requires exploring the source mechanism of mining-induced seismic activity (Figure 7a and b). This is to enhance the design of rock engineers to reduce or eliminate potential hazards and enable efficient mine planning.
Large seismic events of concern were reprocessed, and their waveforms inverted for moment tensors (Figure 7 a and b) and plotted on a Hudson source-type diagram (Figure 7c) that is used to identify source mechanism types such as pure implosion and explosion, crack dilation and closure, ± linear dipoles, and ± compensated linear vector dipoles (CLVD). Most mechanisms are isotropic compensated linear vector dipoles plotting in the Hudson diagram's implosive zone (Figure 7c). This indicates that the predominant failure mode in the area of interest was the closure of apertures, which includes millimeter-wide mining-induced fractures and meter-wide stopes. This suggests that while stope closure might have played a significant role, the seismic source mechanisms were more obviously of stress-driven fracture closure. A prominent isotropic component (ISO) and compensated linear vector dipole (CLVD) of more than 60% were present in more than 95% of the entire moment tensor solutions overall (Figure 7 a and b), with the double couple (DC) accounting for 5% of the selected occurrences. The moderate CLVD component indicates that uniaxial deformation formed part of the event mechanisms. These mechanisms are typically associated with dynamic pillar failure and stope closure. These are consistent with the underground observation of dynamic closure on support units.
The findings were that most source mechanisms have dominant crush-type components with smaller shear-type components plotted in the implosive region. About 93% showed negative ISO and CLVD, representing tensile crack closure ('implosions'). The interpretations of the explosive or implosive point source model (isotropic component) link to the volume change process within the rock mass affected (Figure 7c). These results correspond to previous studies showing that many large mining events have significant implosive volumetric components (McGarr, 1992). The nodal planes of some mechanisms tend to align with stope faces at the mine. The fault plane solution of the moment tensor analysis results does not show any structure related source mechanisms.
Seismic response to production analysis
The seismic response to production analysis is an assessment to distinguish between typical and more hazardous seismic behaviour.
Seismic potency (P) is a reliable and handy parameter for this purpose and was calculated and defined by Mendecki et al. (2005)

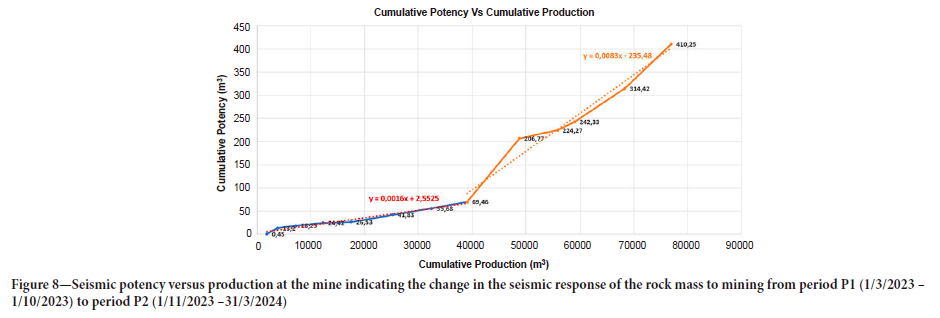
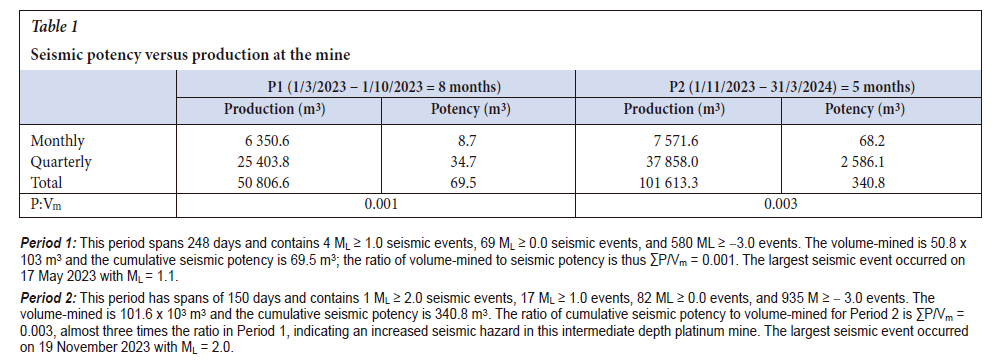
where M0= seismic moment, G = modulus of rigidity (30 GPa), A = area of slip (m2) and d = slip displacement (m). Seismic potency is measured in meters cubed (m3) and can be considered the volume of shear displacement associated with a seismic event. Period 1 (1 March 2023 to 31 October 2023) and Period 2 (1 November 2023 to 31 March 2024) were found to have different seismic responses, indicated by the slope of the best-fit lines (Figure 8); the steeper the slope, the more hazardous the seismic response was deemed to be. The slope of Period 2 (gold line in Figure 8) is steeper (0.0083) than that of Period 1 (blue line in Figure 8, i.e., 0.0016).
The production (Vm) and seismic potency (P) during Period 1 (P1) and Period 2 (P2) are summarised in Table 1. The seismic hazard is estimated by finding the ratio between Vm and P. Interestingly, the average monthly production in P2 is higher than in P1, and the ratio of potency to production is higher in P2 than in P1. However, the period in months is shorter in P2. In addition, P2 stands out as having a higher seismic hazard than P1. The high level of seismicity within the intermediate depth platinum mine in P2 is alarming; the reason for this has yet to be definitively determined but might be due to factors such oversized pillars, production rates, the mechanical properties of the rockmass in the MER mining, or a combination of these factors.
During the first period (P1), there was a large degree of scattering in the locations of the seismic events, while during the second period (P2), the seismicity was concentrated in the brown sugar norite environment in the intermediate depth platinum mine, where the mining was taking place. In both periods, the largest seismic events were located on the pillars and BSN (Figure 5).
Review and upgrade of seismic resistant support
Effectiveness of existing and redesigning of support
The support system needs to support the rockmass under normal gravity loading conditions. Secondly, the same support system must safely support the rockmass under dynamic loading conditions experienced during a seismic event. In the case of seismic loading conditions, the excavation will undergo permanent inelastic deformation, but the emphasis is on providing for the safety of personnel working in these excavations. The mechanics of rock support are complex, and no models exist that can fully explain the interaction of various support components in a rock support system. Nevertheless, Kaiser et al. (1996) summarised three key support functions as: (1) reinforce the rock mass to strengthen it and control bulking; (2) retain broken rock to prevent fractured block failure and unraveling; and (3) hold fractured blocks and securely tie back the retaining element(s) to stable ground. The demand/capacity rationale for support system design in a seismic loading environment is to achieve a support design capacity greater than the load or energy demand supplied to the rockmass by ground vibrations, e.g., a seismic event. Research into developing support units and testing such support in controlled conditions have come a long way and have been documented by many authors (Kaiser et al., 1996, 2012; Cai et al., 2004). The existing support in this area generally performed well, significantly reduced damage, and prevented loss of life and injury under quasi-static conditions. The existing support for quasi-static conditions in the areas of interest is comprised of:
> Grout Pack on 3.0 m x 3.0 m pattern.
> 1.6 m long resin bolt on a 1.5 m x 1.5 m pattern.
> 1.5 m long full column grouted tendon on a 1.5 m x 1.2 m pattern (gully support).
> Temporary mechanical prop on a 1.5 m - 2.0 m pattern.
> 2.0 m wide safety net on the hangingwall in the stope face area.
In redesigning the local support for these areas, emphasis is placed on improving the strength and yielding capability of the support system. The demand for the support system required a selection of support units that would work with the regional stability pillars and crush pillars to provide the required quasi-static and dynamic (yielding) abilities. The goal of reinforcing the rock mass using rock bolts is not only to strengthen the rock mass, thus enabling it to support itself (Hoek and Brown, 1980), but also to control the bulking process, as rock bolts prevent fractures from propagating and opening when correctly installed. The redesigned support system in this area to mitigate the risk of rockburst now comprises:
> Grout Pack on 8.0 m (strike) x 4.0 m (dip) pattern (centre to centre).
> 1.6 m long resin bolt on a 1.5 m x 1.5 m pattern (in the stope hangingwall in the face area).
> 1.5 m long full column grouted tendon on a 1.5 m x 1.2 m pattern (gully support).
> 1.5 m long yielding prestressed elongate (timber and steel elongate) on a 1.5 m (dip) x 2.0 m (strike) spacing (centre to centre).
> Temporary mechanical prop on a 1.5 m x 2.0 m pattern.
> 2.0 m wide safety net on the stope face.
Rockburst risk analysis using the rockburst damage potential (RDP) approach
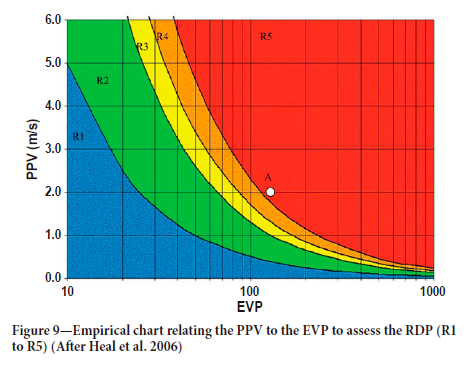
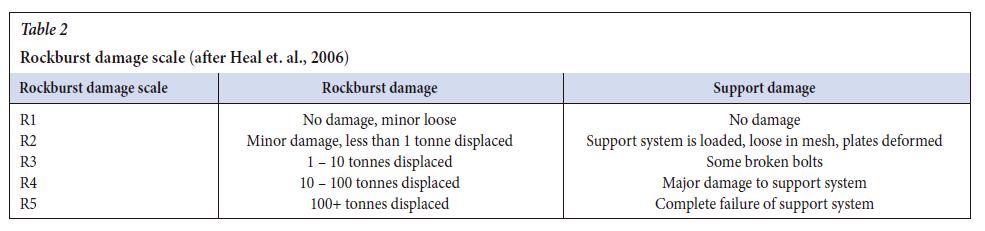
Rockburst risk analyses were carried out on stoping excavations of interest. The RDP method is first described and then applied. A system for quantifying the seismic risk is being developed that considers the seismic hazard and the excavation vulnerability (stress damage, support capacity, span, and geological disturbances). This is then used to estimate the expected frequency and extent of seismic damage. The method for assessing excavation vulnerability and rockburst damage potential, developed by Heal et al. (2006), has been adapted and applied. This method is based on 83 case histories with 254 damage locations from 13 Australian and Canadian mines. Heal et al. (2006) proposed the rock damage scale (RDS) (see Table 2). RDP is a function of the excavation vulnerability potential (EVP) and peak particle velocity (PPV) that can be represented by an empirical chart in a probabilistic sense, as shown in Figure 9.
Heal et al. (2006) suggest that the EVP can be determined as follows:
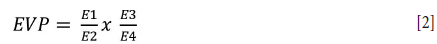
Where E1 represents a stress-to-strength ratio, E2 a support capability, E3 the excavation span and E4 the geological factor. Heal et. al. (2006) defined the E1 parameter as follows:
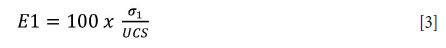
where σ1 = the major principal stress and UCS is the uniaxial compressive strength (UCS).
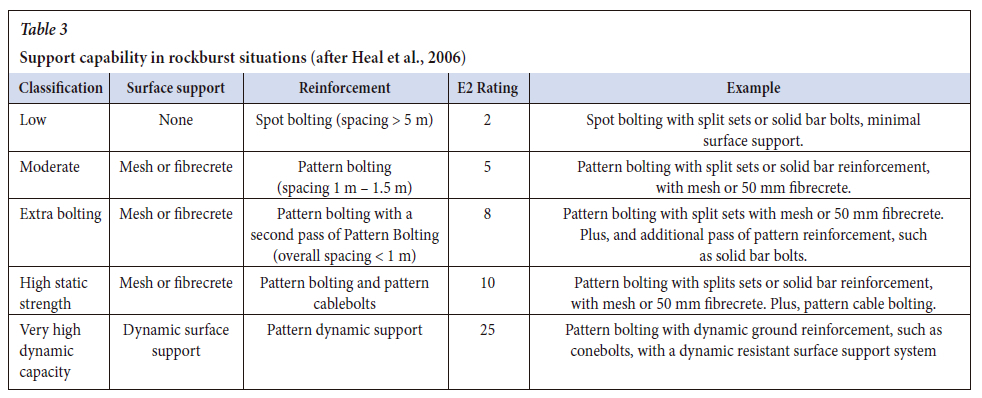
> E2 provides an empirical ranking of support capability in rockburst situations, which is described in Table 3. This is based on analyses of actual and simulated rockbursts (blasting) and installed support systems (Heal and Potvin, 2007).
> The E3 parameter represents an excavation span measured in metres (m), and
> E4 is the geological factor. Heal et al. (2006) suggest using the following geological factors: 0.5 for a seismically active major structure, 1.0 for no geological structure and or an unfavorable rock mass, and 1.5 for a massive rock mass.
> The peak particle elocity (PPV) in metres can be estimated using the following equation (Kaiser et al. 1996):
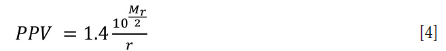
where Mr represents a seismic event magnitude and r the distance in metres between the hypocentre and the experienced damage. The equation considered the magnitude and distance of the seismic event. Heal et al. (2006) do not use PPV as an accurate measure of the PPV generated by a seismic event (particularly in the near field) but present a scaled-distance relationship that can be correlated with rockburst damage.
Results
Following here is a comprehensive evaluation of the feasibility of employing RDP method as a reliable tool for assessing rockburst damage. This involves analysing its effectiveness in predicting the risk and severity of rockbursts in various geological conditions and its applicability in guiding preventive measures and optimising safety protocols in underground mining and tunneling operations.
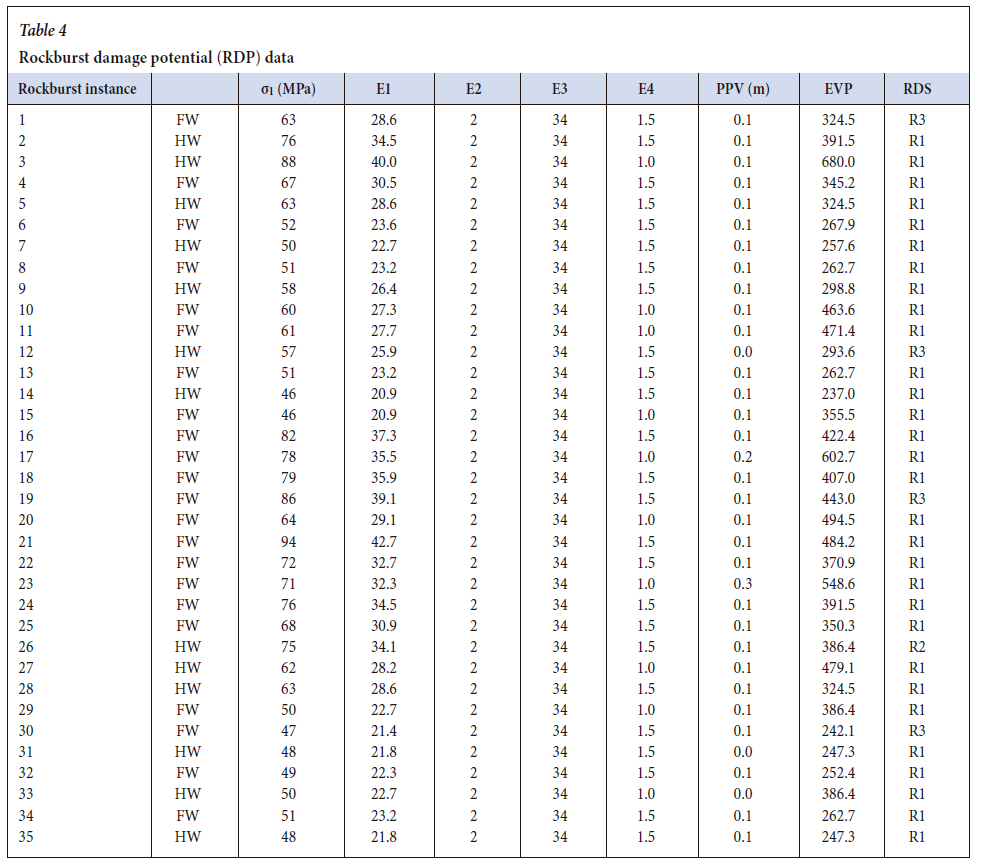
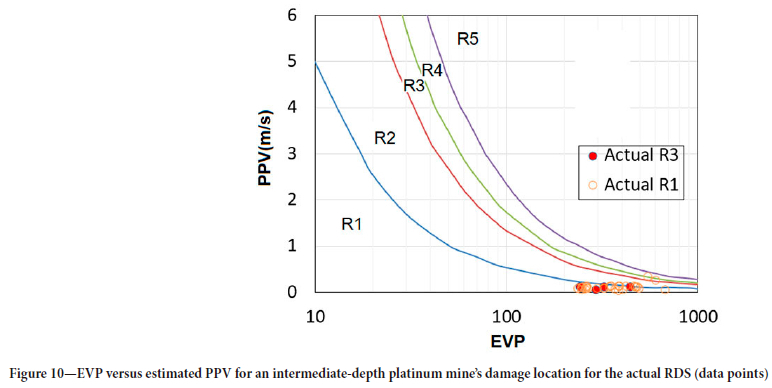
A dataset was compiled for the purpose and provided in Table 4. The parameters E1, E2, E3, E4, and PPV were determined according to the RDP method. The EVP was calculated for each rockburst instance. Then, each data point (EPV, PPV) was superimposed on Figure 9 to produce the graph in Figure 10, which shows the predicted RDS for the data. It indicates the probability of rockburst damage scale (R1 to R5) for a given EVP and PPV. It can be seen that Figure 10 does not show any clear separation of the data according to each zone (R1 to R5), and most of the data points, including those corresponding to R3, fall within the R1 rockburst damage scale. This might be due to insufficient data points or bias in the data selected. In conclusion, the RDP may not be suitable for these mine conditions. While the RDP has shown to be directly applicable to tunnels and shafts, it might not be directly applicable to intermediate or deep tabular stoping methods. However, it provides a valuable tool for comparative purposes. In the long term, a similar research programme should be implemented to develop a more rigorous risk assessment system directly applicable to deep tabular stoping. Implementing the current system is the onset of this process.
In addition to the seismic assessments, a number of learnings emanated from the seismic 'storm' of the period under review. These were that the shaft-based geotechnical department had to institute additional measures to:
> Avoid mining irregular or oversized pillars, as these pillars are a source of seismic activity.
> Ensure compliance to pillar-cutting standards, as these were perceived to be the source of a significant number of the 1,993 events; compliance is crucial for managing mine-induced seismicity.
> Include a number of yielding support elements to assist with the yield required in the system.
> Sequence the extraction in such a manner that will reduce the potential seismicity from poor configurations.
> Provide systems to adequately assess seismic incidents, generate trend analyses in real-time, and provide recommendations to underground personnel prior to them starting their shifts.
> Launch an intensive monitoring and numerical modelling programme to quantify geotechnical and geomechanics aspects of the mining.
Conclusions
The seismic database collected for 13 months has proved invaluable in understanding the seismic response to mining within this mine. The evaluation of this seismic response was carried out using seismic statistical hazard parameters and production. The shaft regularly reviews risk mitigation measures. The study indicates that the seismic hazard (slope of cumulative seismic potency versus cumulative production) has increased during period P2 (1/11/2023 - 31/3/2024). An increase in the gradient of the slope indicates an increase in hazards.
Peak particle velocity and excavation vulnerability potential index were correlated. A method to assess rockburst risk, namely rockburst damage potential (RDP) indicates that the damage falls within the R1 and R3 rockburst damage scales. The Mmax value of 2.0 is higher for Period 2 than the Mmax of 1.1 during Period 1. Regarding seismic event statistics, 100 events of M > 0.0 indicated more instability for Period 2. However, the underlying causes of these alterations during the extraction process may stem from various factors, such as the pillar size and the geomechanical properties of the rock mass, especially the unknown rock characteristics of the brown sugar norite (BSN). These factors necessitate thorough investigation and will be incorporated into future research endeavours.
It is important to note that, at this point in the investigation, the increase in stress generation and strain build-up has been primarily attributed to the poor execution of the geotechnical design, with reference, particularly to the local "crush" stability pillars. Therefore, the shaft-based geotechnical discipline must establish and maintain systems and processes to reduce noncompliance, reducing the likelihood of damaging seismicity. This investigation will allow the rock engineering practitioner to have sight of the influence of production data and production rate increases on seismic potency and, in addition to that, infer the potential for rockburst hazards, develop a rockburst hazard forecast, and use rockburst control techniques to reduce the risk.
References
Aki, K.U., Richards, P.G. 2002. Quantitative Seismology 2nd.edn. Sansalito, CA: University Science Books, pp.218-235. [ Links ]
Andersen, L.M. 2001. A relative moment tensor inversion technique applied to seismicity induced by mining. PhD Thesis. University of the Witwatersrand, Johannesburg. [ Links ]
Aref, K., Jager, A.J., Spottiswoode, S.M. 1994. 'A comparison of seismicity from two mines in the Bushveld Igneous Complex using different pillar systems'. The 1994 ISRM International Symposium and Vlth South American Congress on Rock Mechanics, Santiago, Chile. [ Links ]
Ben-Menahem, A., Singh, S.J. 1981. Seismic waves and sources. Springer Science and Business Media. [ Links ]
Beukes, J.J. 2014. Geochemical and mineralogical investigation of the Merensky Reef and its noritic hangingwall at Two Rivers Platinum Mine and Eerste Geluk, Eastern Bushveld, with special reference to the PGE distribution and cryptic variation of the mineral chemistry. MSc Thesis, University of the Free State, South Africa. [ Links ]
Cai, M.K., Kaiser, P.K., Tasaka, Y., Maejima, T., Morioka, H., Minami, M. 2004. 'Generalized crack initiation and crack damage stress thresholds of brittle rock masses near underground excavations. International Journal of Rock Mechanics and Mining Sciences, vol. 41, no. 5, pp.833-847. [ Links ]
Durrheim, R.J., Spottiswoode, S.M., Roberts, M.K.C., Brink, A.V.Z. 2005. 'Comparative seismology of the Witwatersrand Basin and Bushveld Complex and emerging technologies to manage the risk of rockbursting. Journal of the Southern African Institute of Mining and Metallurgy, vol. 105, no. 6, pp.409-416. [ Links ]
Gay, N.C, Durrheim, R.J., Spottiswoode, S.M., Van der Merwe, A.J. 1995. 'Effect of geology, in-situ stress, and mining methods on seismicity in Southern African gold and platinum mines' in Fuji T. (ed.). Proceeding of the 8th International Congress on Rock Mechanics, ISRM, vol. 8, pp.1321-1325. [ Links ]
Gibowicz, S.J. 1993. 'Keynote address: Seismic moment tensor and the mechanism of seismic events in mines'. Proceedings of Rockbursts and Seismicity in Mines, Kingston, August, pp.149-155. [ Links ]
Haile, A.T., Jager, A.J. 1995. Rock mass condition, behaviour and seismicity in mines of the Bushveld igneous complex. Safety in Mines Research Advisory Committee, GAP 027, pp.1-207. [ Links ]
Heal, D., Potvin, Y., Hudyma, M. 2006. 'Evaluating rockburst damage potential in underground mining' Golden Rocks: The 41st US Symposium on Rock Mechanics (USRMS). Colorado. [ Links ]
Heal, D., Potvin, Y. 2007. 'In-situ dynamic testing of ground support using simulated rockbursts, Deep Mining 2007 Y. Potvin ed. Australian Centre for Geomechanics, Australia. [ Links ]
Hoek, E., Brown, E.T. 1980. 'Empirical strength criterion for rock masses'. Journal of the geotechnical engineering division, vol. 106, no. 9, pp.1013-1035. [ Links ]
Jager, A.J., Ryder J.A. 1999. A Handbook on Rock Engineering Practice for Tabular Hard Rock Mines, SIMRAC. [ Links ]
Jost, M.U., Herrmann, R.B. 1989. 'A student's guide to and review of moment tensors'. Seismological Research Letters, vol. 60, no. 2, pp.37-57. [ Links ]
Kaiser, P.K., Cai, M. 2012. 'Design of rock support system under rockburst condition'. Journal of Rock Mechanics and Geotechnical Engineering, vol. 4, no. 3, pp. 215-227. [ Links ]
Kaiser, P.K., McCreath, D.R., Tannant, D.D. 1995. Rockburst Support Handbook, Geomechanics Research Centre, Laurentian University, Canada. [ Links ]
Kruger, F.J. 2005. 'Filling the Bushveld Complex magma chamber: lateral expansion, roof and floor interaction, magmatic unconformities, and the formation of giant chromitite, PGE and Ti-V magnetite deposits. Mineralium Deposita, vol. 40, pp. 451-472. [ Links ]
Lougher, D.R., Mellowship, P. 1991. Strata control problems associated with geological structures on Impala platinum Mines. Internal Report. [ Links ]
McGarr, A. 1992. 'Moment tensors of ten Witwatersrand mine tremors. Pure and Applied Geophysics, vol. 139, nos. 3-4, pp. 781-800. [ Links ]
Mendecki, A.J. 2005. 'Persistence of seismic rock mass response to mining, in Y Potvin and M Hudyma (eds). RaSiM6: Proceedings of the sixth International Symposium on Rockburst and Seismicity in Mines, Australian Centre for Geomechanics, Perth, 97, pp. 97-105. [ Links ]
Taylor, C.D., Schulz, K.J., Doebrich, J.L., Orris, G.J., Denning, P.D., Kirschbaum, M.J. 2005. Geology and nonfuel mineral deposits of Africa and the Middle East. US Geological Survey. [ Links ]
 Correspondence:
R. Masethe
Email: masetheR@ukzn.ac.za
Received: 14 Jun. 2024
Revised: 2 Dec. 2024
Accepted: 22 Jan. 2025
Published: January 2025
