



Services on Demand
Journal

Article
 English (pdf)
 Article in xml format
 Article references
 Automatic translation
 Send this article by e-mail
Indicators
Related links
-
 Cited by Google
 -
 Similars in Google
Share

 Permalink
Journal of the Southern African Institute of Mining and Metallurgy
On-line version ISSN 2411-9717Print version ISSN 2225-6253
J. S. Afr. Inst. Min. Metall. vol.124 n.11 Johannesburg Nov. 2024
https://doi.org/10.17159/2411-9717/2486/2024
PROFESSIONAL TECHNICAL AND SCIENTIFIC PAPERS
Tracking the degradation of carbon steel mechanical properties due to high-temperature hydrogen attack through strain gauge monitoring
A. van ZylI; C.C.E. PretoriusI; V.M. MathohoI, II; R.J. MostertI
IDepartment of Materials Science and Metallurgical Engineering, University of Pretoria, South Africa. ORCiD:R.J. Mostert: http://orcid.org/0000-0002-8592-1313
IISasol Synfuels (Pty) Ltd, Secunda
ABSTRACT
The in-service degradation of the mechanical properties of steel components through the damage mechanism of high temperature hydrogen attack (HTHA), is a topic of concern in the refining and green hydrogen industry. This damage mechanism occurs in susceptible steels operating in environments at high temperatures and hydrogen pressures. The current investigation deals with the indirect monitoring of mechanical degradation via tracking of the swelling strain in affected structures. An autoclave with an AISI 316 shell was utilized to simulate accelerated HTHA damage at 550 °C and 46 bar for exposure times ranging from zero to 700 hours. The progress of the HTHA damage was tracked using encapsulated high-temperature strain gauges. The correlation between the swelling strain and mechanical property degradation was studied to develop a methodology for the continuous monitoring of embrittlement. The tensile sample orientation of the carbon steel plate was included as a variable, i.e., samples parallel, transverse, or perpendicular to the plate rolling direction were included, since it has been shown that the sample orientation influences the HTHA damage features.
For the through-thickness orientation, and upon exceeding a threshold value of exposure time, all tensile properties were severely degraded, with values in the order of a 90 per cent reduction being observed.
It was found that the degradation of carbon steel mechanical properties can be correlated to the swelling strain measured during exposure. The critical point for mechanical property degradation in the plate through-thickness orientation, whereafter a severe decrease in the ductility of the material occurs, was found to be in the order of 1% of the total swelling strain measured during exposure, equivalent to 65 microstrain. This threshold was found to be significantly lower than that expected from the literature, where limits of 400 to 1000 microstrain were postulated.
Keywords: high temperature hydrogen attack, mechanical properties, strain gauge monitoring, degradation
Introduction
High-temperature hydrogen attack, or HTHA, is a damage mechanism whereby susceptible steel alloys that are exposed to hydrogen-containing environments at elevated temperatures can see a marked degradation in their mechanical properties (Poorhaydari, 2021). The mechanism involves the diffusion of elemental hydrogen from the environment into the steel, where it reacts with carbon to form methane gas (CH4) according to Equation [1]:

Benac and McAndrew stated that the buildup of methane gas at locations such as grain boundaries, is due to the inability of the methane to diffuse out of the steel and may lead to an increase in the pressure exerted by the gas on the surrounding material (Benac and McAndrew, 2012). This results in microvoids that, over time, link up to form microcracks and lead to assuring of the steel and subsequent failure at low applied loads. The fact that the reaction of Equation [1] will progress towards the right with increasing time, temperature, and hydrogen pressure, makes HTHA strongly dependent on process and plant variables.
With the sharpened global focus on the development of the hydrogen economy, the HTHA damage mechanism is currently very topical. In South Africa, with ageing process plants still being used to produce fuels, HTHA is also a concerning phenomenon. Due to the severe consequence of failure associated with this damage mechanism, the timely identification of damage, along with knowledge regarding the associated
mechanical property degradation, are of crucial importance. Globally, procedures for the monitoring of structural health and the fitness for service of such affected components are currently in development (Welding Research Council, Inc., 2022). Previous work by Mostert et al. (2022), has also shown that the progression of HTHA can be monitored using strain-life curves, which expresses the amount of accumulated strain experienced by a sample due to swelling during its exposure to hydrogen environments at elevated temperatures and pressures as a function of time. Uncertainty however exists regarding the progression of swelling strain and its relationship to the decrease in a material's mechanical properties. The influence of material orientation, relative to the plate rolling direction, on the severity of mechanical degradation has also not been fully researched to date. The current article therefore deals with research aimed at the degradation of components' mechanical properties as swelling strain due to HTHA damage progresses. The influence of sample orientations on the mechanical property degradation is also investigated.
Theory
A useful tool for the determination of a specific steel's susceptibility to HTHA is the so-called Nelson curves (API, 2016). According to these curves, which were first published in 1949, the susceptibility of a steel to HTHA is a function of hydrogen partial pressure (in MPa) and exposure temperature (in "C). Exposure combinations in which both the temperature and hydrogen partial pressure fall above the plotted curve of a specific material, indicate operating conditions that could result in HTHA of the material. These curves have been constructed and updated using plant exposure data to establish safe operating conditions, while taking the safety factor into account (API 941, 2016). Due to the new cases of damage being reported with the progression of time, some of these curves have recently been adjusted downwards to reflect the cumulative experience over the years. Some older process units may therefore currently operate under conditions that originally had been deemed safe, but are currently regarded as being at risk of attack. An example of these changes is that some units that were constructed using C-0.5 Mo and operated in 'safe regions' according to older Nelson curves, have subsequently been identified as suffering from HTHA degradation and, as a result, this alloy is not currently placed on the Nelson curves found in the current versions of API 941 (Mostert et al, 2022).
HTHA is associated with decarburization, which may manifest itself in one of two ways, surface decarburization or internal decarburization. In both cases, carbon in the material reacts with atomic hydrogen to form methane gas. The main difference between these two mechanisms is the location at which the methane reaction occurs. Regarding the former mechanism, the methane reaction occurs at the steel surface, resulting in a softened surface layer due to the depletion of carbon within the metal matrix. Internal decarburization, however, involves atomic hydrogen diffusing into the steel matrix, where it reacts with carbon to form methane gas bubbles at grain boundaries. As the methane reaction continues, the methane voids may grow and coalesce to form extended fissures and cracks, resulting in mechanical property degradation. Internal decarburization occurs in environments with larger hydrogen partial pressures.
Baker (1999) postulated that the degradation in the mechanical properties of a steel as a function of HTHA exposure time would take place in stages and represented this degradation by schematic diagrams, such as that shown in Figure 1
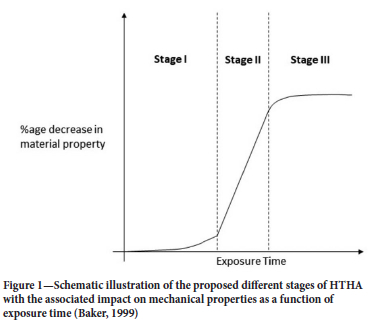
According to this hypothesis, the percentage decrease in the mechanical properties would follow sigmoidal type behavior over time, from which three stages of damage could be distinguished. During the first stage of damage, an incubation period was postulated, in which the voids formed through methane gas production is small and have yet to coalesce and grow into microcracks. Stage 2 was postulated as the region in which the mechanical properties deteriorate at a high rate. This was ascribed to the continued growth of voids resulting from internal methane gas formation, until they coalesce to create the large cavities that may lead to fissuring and cracking, thereby resulting in a decrease in mechanical properties. Stage 3 is indicative of a damage plateau, where the rate of material property degradation decreases due to the depletion of carbon available for methane gas formation (Baker, 1999). The hypothesized relationships between microstructural and mechanical property degradation, and the corresponding microstructural transitions, were however not proven experimentally.
Liu investigated the impact of HTHA on the mechanical properties of C-0.5Mo steel as a function of time (Liu, 2001). For their study, Liu conducted tensile tests at ambient temperatures after high temperature hydrogen exposure. The operating conditions were defined using a Pw factor, which was defined using exposure time, temperature, and hydrogen partial pressure (Liu, 2001). Ductility degradation was then assessed by considering the reduction of area measured upon failure of the tensile samples. A threshold Pw factor was identified and, when exceeded, severe ductility degradation was expected to commence. Liu's work proved useful, since the expected progression from Stage 1 to Stage 2 HTHA damage can be calculated for given process conditions. However, a shortcoming in this study was that the threshold Pw-value will vary, depending on a number of process and metallurgical variables, including the specification of steel used.
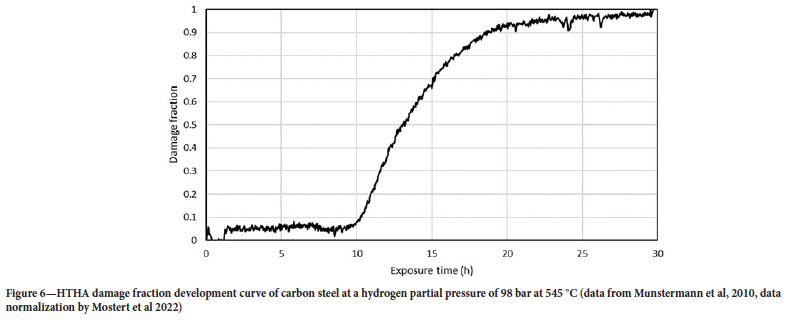
The formation of HTHA voids and fissures is known to cause swelling-induced strain in steel and offers a possible way in which the progress of damage and, theoretically, embrittlement can therefore be continuously tracked in service. A threshold strain value could then be identified, corresponding to the critical Pw-value, to identify the start of severe mechanical property degradation. The formation and growth of methane-containing cavities exert a force on the steel matrix, causing it to expand. In laboratory work, it has been shown that the progression of HTHA damage can be tracked over time by measuring the accumulated strain experienced by the steel, using high-temperature, encapsulated strain gauges (Mostert et al, 2022). A time-damage fraction plot for carbon steel at a temperature of 545 °C and an H2 partial pressure of 98 bar was produced by the authors and had a similar sigmoidal shape to that of the mechanical property degradation curves postulated by Baker. The measured strain values initially increased at a slow rate. Thereafter, the strain values progressed rapidly, before eventually reaching a maximum value when the carbon became depleted, preventing further straining of the material by new methane gas formation.
The directionality of the degradation is an important factor to consider due to the hot-rolled microstructure of carbon steel plate. Earlier work showed that significant segregation bands form due to hot rolling operations in C-0.5Mo steels, with HTHA fissuring and decarburization taking place in planes parallel to these segregation bands (Pretorius et al, 2021), leading to directional variability of the HTHA strain that developed. It can be expected that forces applied at different angles to these degraded planes - either parallel to the fissure orientation or perpendicular to the fissure orientation - will result in different degrees of ductility degradation. There is, however, little published work that investigated the influence of this variable on ductility degradation.
The aim of this study is, therefore, to investigate the magnitude of HTHA swelling strain that corresponds to significant mechanical property degradation in carbon steel plate material. Early research proposed that the strain that corresponds with the point of incubation for HTHA damage in carbon steels ranges from 400 and 1000 microstrain (Panda and Shewmon, 1984). At this point, it was believed that the individual methane bubbles on a particular grain boundary join to form a continuous grain boundary bubble, which then constitutes a microcrack. The proposed hypothesis for this work is, therefore, that the threshold of HTHA strain that will correspond to a significant ductility degradation can be measured using an encapsulated strain gauge and ranges from 400 to 1000 microstrain.
The influence of transverse (T), through-thickness (Z), and longitudinal (L) sample orientations on the degree of HTHA ductility degradation was also investigated, due to the presence of segregation bands and the directionality of fissuring identified by other authors (Pretorius et al, 2021), with the expectation that the degradation of tensile properties can vary with sample orientation and will be most severe in the through-thickness direction.
Methodology
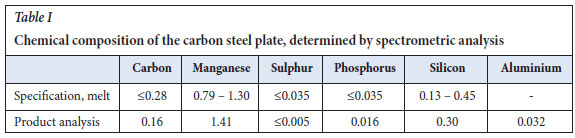
Tensile samples used in the present study were machined from a 40 mm thick, hot-rolled carbon steel plate, which corresponded to the requirements of the ASTM A 516 Gr 70 specification. Table Isummarizes the chemical composition of the plate material as determined by an independent accredited laboratory via spectrometric analysis.
Tensile samples were machined in three directions relative to the rolling direction of the plate. A total of 19 samples were used, with 4 machined in the longitudinal and transverse directions, respectively, and 15 machined in the through-thickness (normal) direction. A larger number of through-thickness samples were used during this study to investigate the impact of perpendicular forces applied to the HTHA degraded planes, expected to be parallel to the rolling direction. Figure 2shows the relevant orientations:
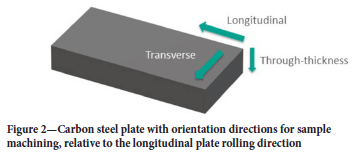
Rolling of the plate was in the longitudinal direction. Table IIand Table IIIshow the dimensions of the samples used.
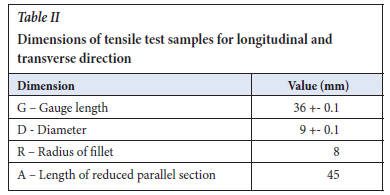
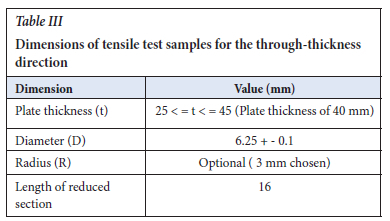
The longitudinal and transverse samples were machined according to ASTM E8 specimen 2, while the through-thickness samples were machined according to ASTM A770 specimen type D with M12 thread. The thickness of the plate limited the size of the through-thickness samples and, therefore, an appropriate standard was selected for the machining of these specimens.
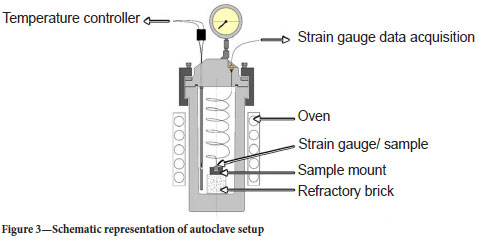
Samples were then exposed to accelerated HTHA conditions in an autoclave at conditions of 550°C and 46 bar H2. A schematic representation of the autoclave setup containing the strain-gauged sample is shown in Figure 3
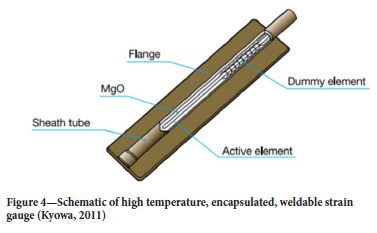
During exposure, the swelling strain was monitored using a KHCM-10-120-G15-11 C2MV high-temperature, encapsulated strain gauge supplied by Kyowa Electronic Instruments. The sensing part of the strain gauge is depicted schematically in Figure 4 which is comprised of an active element (for strain measurement) and dummy element (for temperature correction). These elements are housed, along with refractory material, inside a sheath-tube made from highly heat-resistant Inconel 600. The sensing part is also mounted to a flange with dimensions of 3 mm x 20 mm x 0.1 mm, which provides the means for mounting the specimen to metallic components via precision capacitance discharge spot welding. Regarding the monitoring of swelling-strain during the current investigation, the strain gauge was mounted to a 34 mm x 4 mm x 10 mm carbon steel plate sample machined along the through-thickness direction, by capacitance discharge welding of the flanges to the sample. The sample/strain-gauge assembly was then fixed to a specialized mount to minimize the strain fluctuations during the exposure.
Samples in all three orientations were tested in the as-received (or unexposed) condition, providing baseline values with which to compare the mechanical property degradation of exposed samples. Due to the expectation that degradation of mechanical properties would be most severe in the through-thickness direction, specific focus was placed on these samples, which were exposed for intermittent time periods. This would allow a more accurate insight into the progression of HTHA through the steel. The longitudinal and transverse samples were only tested in the as received and maximum exposure stages. Cooling of all samples retrieved after the times indicated in Table IV was done in the autoclave and at slow cooling rates, by switching off the autoclave heaters to avoid distortion and thermal shock effects. Table IVsummarizes the exposure time for the tensile test samples.
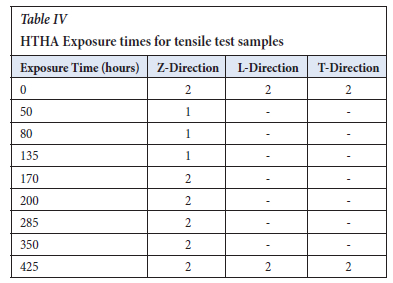
Upon completion of the specific HTHA exposure times, tensile testing was implemented at a rate of 2 mm / min to determine the mechanical properties of each sample. Conventional tensile testing of the through-thickness samples was found to be unpractical, due to the small head size caused by the 40 mm thick plate. The thread machined in the sample head was thus used to screw the samples into grips, which were placed in the tensile testing machine.
Results and discussion
Progress of HTHA damage against time
The progress of the HTHA damage mechanism, as measured by the swelling strain of the through-thickness sample during HTHA exposure, is shown in Figure 5
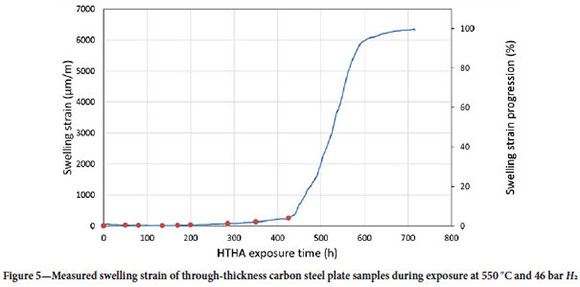
The graph shows the swelling strain experienced by the instrumented sample, both in microstrain and as a percentage progression. The strain experienced a small increase during the initial stages of the test, followed by accelerated swelling before reaching a maximum strain value, and has the same sigmoidal shape as that proposed by Baker for degradation percentage versus time (see Figure 1. The red dots indicate instances in time where tensile samples were removed from the autoclave and tested for ductility degradation, with the sample that received the longest exposure to HTHA removed after 425 hours. The curve depicting the damage fraction versus time in this figure shows a similar progression to that obtained by Munstermann (et al, 2010), who used a laboratory LVDT setup (see Figure 6. In both curves, measured swelling strain initially increased at a slow rate, before progressing rapidly and eventually reaching a maximum value.
Tensile test results
Tensile testing of samples exposed at different times to the HTHA conditions produced the UTS and yield strength results for the three sample orientations as shown in Figures 7and 8.
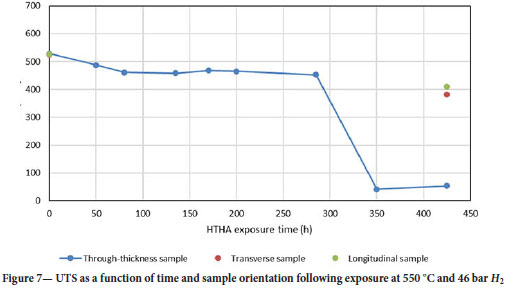
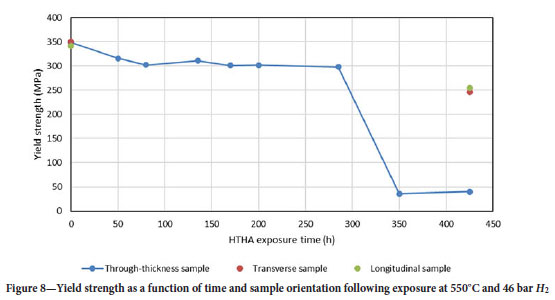
The figures show that, in the as-received state, all three sample orientations had similar yield strengths and UTS values. However, for the exposure times of 350 hours and 425 hours, the through-thickness samples exhibited a severe degradation of strength. For the long exposure times, the z-samples also showed significantly larger reduction in the yield strength and UTS, compared to the longitudinal and transverse samples. Due to the limited number of samples tested from the longitudinal and transverse orientations, a comparison cannot be made regarding the relative degradation at shorter exposure times. The yield strength and UTS of the z-samples did not decrease at a constant rate, but rather reduced by a small degree during initial exposure times, before the severe degradation observed after exposure times of 285 and 350 hours. For both the unexposed and 425-hour exposed data sets, a minimal difference between both the yield and UT strength values measured for the longitudinal and transverse samples was observed. At long exposure periods, the severe through-thickness direction degradation, as opposed to the longitudinal and transverse directions, was very prominent. It is probable that longer exposure periods for longitudinal and transverse samples will result in similar degradation, but more effort is needed to confirm this.
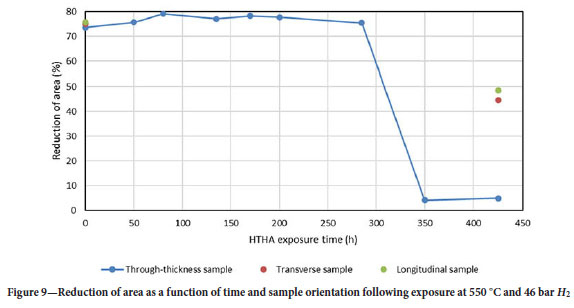
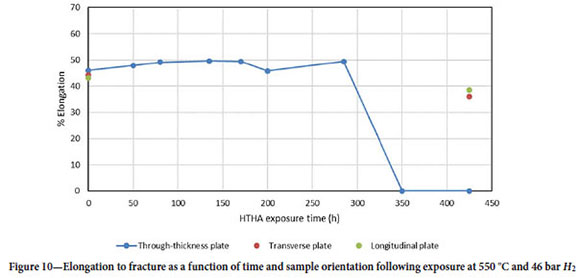
Following testing of the samples to failure, the reduction in area and elongation to failure of the samples were determined, as illustrated in Figure 9and Figure 10 respectively.
Figure 9shows that the reduction in area was between approximately 73% and 75% for all three orientations in the as-received state. The reduction in area of the through-thickness samples varied between 75% and 80% as the HTHA exposure time increased to 285 hours, then decreased to approximately zero percent at 350 hours and 425 hours HTHA exposure. The transverse and longitudinal samples, however, saw a decrease in the reduction in area to between 36% and 38%. Figure 10indicates that the elongation of the three orientations in the as-received state was similar, at approximately 45%. The elongation of the through-thickness samples varied between 45% and 50% as the HTHA exposure time increased to 285 hours, when it also decreased to approximately zero percent at 350 hours and 425 hours. The elongation of longitudinal and transverse samples at 425 hours only saw a decrease to approximately 38%.
Similar trends were observed in the impact that HTHA exposure had on the elongation to fracture, reduction in area of the samples, yield strength, and UTS. The through-thickness samples showed larger decreases in yield strength and UTS values at the maximum exposure times. Similarly, significantly smaller elongation and reduction in areas values were observed in the through-thickness samples at maximum exposure as compared to the longitudinal and transverse samples, also indicating a larger decrease in ductility and extensive HTHA degradation. These results confirm that the HTHA-induced degradation of all tensile properties is most severe in the through-thickness direction. HTHA microstructural degradation has earlier been observed to dominate in planes that are parallel to the plate rolling direction (Pretorius et al, 2021), and it is therefore probable that the observed severe z-direction ductility degradation is due to the HTHA defects in the plane, normal to the applied tensile force joining up and resulting in fracture without the matrix playing a significant role. At these combinations of high levels of internal microstructural defects and loading normal to the degraded planes, fracture cannot be explained through ductile bulk overload and microvoid coalescence, but rather through brittle fracture at low loads from sharp internal crack tips, employing fracture mechanics principles.
Degradation as a function of HTHA strain
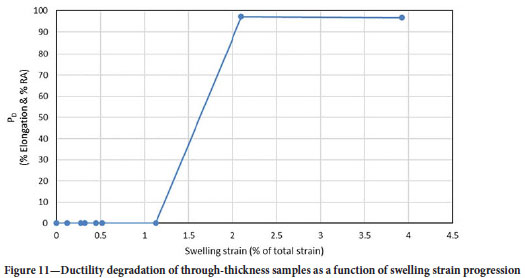
A plot of ductility degradation as a function of HTHA swelling strain was produced for the z-direction samples and is shown in Figure 11 The exclusive focus on z-direction degradation in this plot is due to the dominance of the degradation in this orientation.
The total ductility degradation parameter plotted on the y-axis, Pd, follows the principle of the Φr -parameter used by Liu (2001), but was calculated as an average of Dra and Del:

The Dra and Del parameters are given for each exposure time as
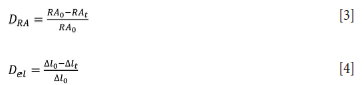
Where
RAo = Reduction in area of the as-received sample
RAt = Reduction in area of the sample after exposure for t hours
Δl0 = Elongation of the as-received sample
Δlt = Elongation of the sample after exposure for t hours
The percentage swelling strain progression, as used by Mostert et al (2022), which is defined as
where

et = Strain measured at a specific time instant
et = Total swelling strain measured.
wherein maximum ductility degradation was observed at approximately 2% of the total swelling strain, while the point of initiation for severe ductility degradation fell between swelling strains of 1 and 2 per cent of the total strain. The corresponding microstrain range is between 70 and 130 με. This result shows that a severe decrease in the ductility of the material takes place at very small values of experienced strain, which is lower than that proposed to be the point of incubation for HTHA damage by the earlier mentioned authors (compared to the 400 - 1000 με of Panda and Shewmon, 1984).
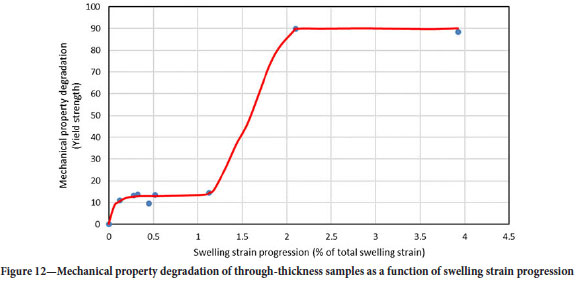
The degradation plot was recreated using the yield strength values to investigate the correlation between swelling strain and the degradation of the materials strength, again for the z-direction samples only. This relationship is shown in Figure 12:
The mechanical property degradation was defined as:

where
(σy)0 = Yield strength of the as-received sample
(σy)t = Yield strength of samples after exposure for t hours
and t indicates a certain exposure time, while 0 indicates the as received properties.
The sigmoidal shape of the degradation-strain graphs in Figure 11and Figure 12shows trends similar to that postulated by (Baker, 1999) in Figure 1for the decrease of material mechanical properties due to HTHA damage. However, the extent of ductility degradation was found to be much more severe than what one would describe as 'incubation of HTHA damage'. Maximum ductility degradation was observed at approximately 2% of the total swelling strain, while the critical point is between 1% and 2% of total swelling strain. This indicates that the mechanism of HTHA will cause severe enough damage for the component to fail significantly before the carbon in the material is depleted through methane gas formation, provided that the loading direction is appropriate.
Microstructures
Optical micrographs were taken of samples at different exposure stages to investigate the progression of HTHA damage through decarburization and fissuring, and the impact this will have on the sample microstructure. For these evaluations, the following microscope was utilized: an Olympus BX51M optical microscope (OM) connected to calibrated Olympus Stream Essentials software via an Olympus U-TV0.63XC camera. The microstructural investigation was performed to investigate microstructural linkages to the observed changes in the HTHA strain and mechanical properties of the samples. Figure 13shows the through-thickness sample in the as-received state.
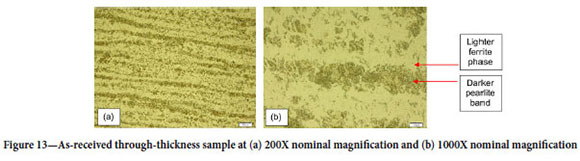
Figure 13also illustrates the banded structure consisting of alternating layers of darker pearlite phase and lighter ferrite phase present within the sample. The microstructures after 285 hours HTHA exposure are shown in Figure 14
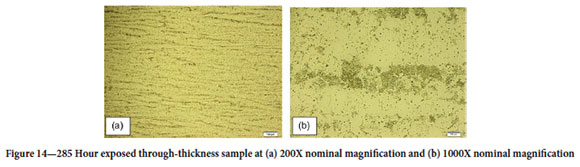
Figure 14(a) and Figure 14(b) illustrate that the banded pearlite and ferrite structure is still present within the sample. However, Figure 14(b) appears to show that some of the darker pearlite phase was broken up. This is possibly due to the decarburization mechanism through which HTHA damage occurs, as the atomic hydrogen from the environment diffuses into the sample and reacts with the carbon to form methane gas. The carbon will then be supplied from the pearlite, (which is a combination of ferrite and cementite or Fe3C), thus reducing the size of the pearlite phase. This phenomenon was also observed in previous work (Pretorius et al, 2021). However, there were no signs of any microvoids, fissuring or cracking, which were observed at these magnifications. This indicates that, after this extent of exposure, HTHA tensile degradation is not yet at an advanced stage, as is evident from Figures 7 to 11, due to insufficient methane gas developing in accordance with Equation [1], and collecting on the grain boundaries to result in voids and fissures.
Figure 15(a) and Figure 15(b) show the microstructures after 350 hours of exposure:
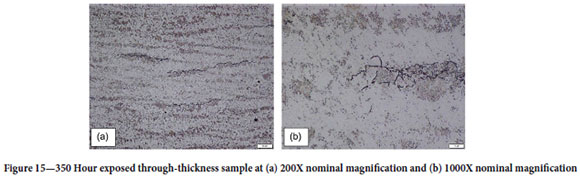
Figure 15(a) illustrates evidence of micro-cracking at a magnification of 200X. The cracking occurs parallel to the banded microstructure on the grain boundaries between the darker pearlite and lighter ferrite phase. Figure 15(b) shows the progression of the crack tip and evidence of more severe decarburization, as the darker pearlite phase has become more depleted. At 350 hours, a significant decrease in the yield strength, tensile strength, elongation to fracture, and reduction in area parameters were observed and thus probably corresponds to the presence of the cracks observed in the micrographs in the aforementioned illustrations. The application of load in the through-thickness direction (normal to the cracks noted above) may lead to premature fracture from crack tips and thus, the rapid degradation of the through-thickness mechanical properties observed.
The microstructure demonstrates the outcome of the HTHA mechanism discussed earlier. The effect of the reaction of Equation [1] is shown, where the carbon contained in the carbon-rich cementite has been locally consumed due to the reaction with the dissociated hydrogen gas. The methane molecules that formed could not escape, due to its size, and the localized pressure that resulted caused the microcracking of the ferritic matrix that was observed. The concentration of the microcracks in planes parallel to the plate rolling direction is apparent. A comparison of this microstructure to that of the unexposed material, shown in Figure 13 explains the near complete loss of tensile ductility, as measured by reduction of area, compared to the excellent ductility (77.5%) of the unexposed ferrite and pearlite microstructure.
The microstructures after 425 hours are shown in Figure 16
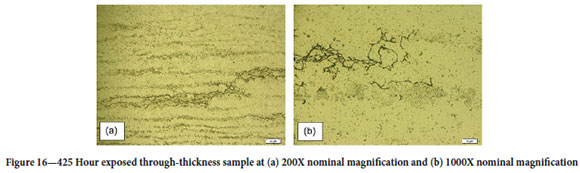
Similar to the 350-hour exposed sample, there is significant evidence of damage even at lower magnification. The cracking occurs parallel to the pearlite phases on the grain boundaries. However, in this case, an even larger degree of decarburization has taken place. The fraction of dark pearlite phase in Figure 16(b) is observed to be severely reduced, compared to that in Figure 15(b). These findings support the tensile test results and indicate that severe degradation of the material occurred between 285 and 350 hours of exposure.
Monitoring of damage using encapsulated high-temperature strain gauges
Figures 11 and 12 demonstrate that the critical threshold of exposure time that corresponds to tensile property degradation can be identified by monitoring the HTHA swelling strain. Once the HTHA strain detected by the encapsulated high-temperature strain gauges exceeded a value of 65 με after an exposure time of 285 hours, corresponding to 1.1% of the maximum strain measured after 700 hours exposure, both the tensile strength and ductility of z-direction samples were irrevocably degraded. For these samples, the degradation process was completed after an HTHA strain of 124 με, corresponding to 2.1% of the total value measured after 350 hours of exposure. The investigation therefore showed that the encapsulated high-temperature strain gauging technique was sufficiently sensitive to identify the threshold time for HTHA damage, which was found to be in the region of 65 με. This value is significantly smaller than the 400 to 1000 microstrain value postulated by previous authors. Due to the variability of strain measurements during the early stages of the strain-time curve, the use of a threshold strain rate, rather than an absolute strain value or a percentage of maximum strain, can be effective. Even though the microcracks present at this stage of the HTHA process showed few signs of opening up, i.e., small levels of crack face separation were present, the presence of the cracks was sufficient to result in large levels of ductility and strength degradation. Contrary to the previous thought, the point of incubation of HTHA damage results in very significant levels of embrittlement in the through-thickness direction.
Conclusions
> The degradation of carbon steel mechanical properties due to HTHA can be correlated to swelling-induced strain using high-temperature strain gauges.
> For the carbon steel studied and in the through-thickness direction, the threshold strain for HTHA tensile property degradation is in the order of 1 per cent of the total measured swelling strain, or 65 microstrain, significantly lower than the 400 to 1000 microstrain postulated by previous authors.
> Significant degradation of through-thickness tensile properties occurs at low amounts of measured swelling strain and is associated with a small degree of HTHA microstructural damage.
> For the plate material investigated, the HTHA degradation of carbon steel tensile properties is more severe and develops more rapidly in the through-thickness direction compared to that in the transverse and longitudinal directions.
This difference is due to the preferential development of microstructural damage on planes parallel to the plate rolling direction.
> In order to prevent premature failures, the progress of HTHA of at-risk structures can be monitored using encapsulated high-temperature strain gauges. Using this technique, exceeding the threshold exposure conditions for HTHA mechanical property degradation and premature failure can be avoided.
Acknowledgements
Arno van Zyl carried out the study and wrote the manuscript. Christiaan Pretorius co-supervised the study and performed the HTHA exposure, strain gauging and mechanical testing. Moses Mathoho was the industrial collaborator, proofread the manuscript and co-conceived the project. Roelf Mostert co-conceived the project, assisted with the writing of the manuscript, and supervised the project. Sasol Synfuels (Pty) Ltd. supported the execution of the project.
References
API Recommended Practice 941. 2016. Steels for Hydrogen Service at Elevated Temperatures and Pressures in Petroleum Refineries and Petrochemical Plants. API Technical Report 941. (2008). The Technical Basis Document for API RP 941. [ Links ]
Baker, A. J. 1999. Combined creep and hydrogen attack of petro refinery steel. www.bl.uk [ Links ]
Benac, D. J., Paul, M. 2012. Reducing the risk of high temperature hydrogen attack (HTHA) failures. Journal of Failure Analysis and Prevention, vol. 12, no. 6, pp. 624-627. https://doi.org/10.1007/s11668-012-9605-x [ Links ]
Kyowa. 2011. Encapsulated Weldable Strain Gages, pp. 1-16. [ Links ]
Liu, P. 2001. Fundamental Studies of Hydrogen Attack in C-0.5Mo Steel and Weldments Applied in Petroleum and Petrochemical Industries. ui.adsabs.harvard.edu [ Links ]
Mostert, R.J., Mukarati, T.W., Pretorius, C.C.E., Mathoho, V.M. 2022. A constitutive equation for the kinetics of high temperature hydrogen attack and its use for structural life prediction. Procedia Structural Integrity, vol. 37(C), pp. 763-770. https://doi.org/10.1016/j.prostr.2022.02.007 [ Links ]
Munsterman, Tim, Antonio, S., Dana, G.W. 2010. High Temperature Hydrogen Attack Resistance Using Autoclave Testing of Scoop Samples. IPEIA 14th Annual Conference in Banff. Alberta [ Links ]
Panda, B., Shewmon, P. 1984. Kinetics of Methane Bubble Growth in a 1020 Steel. Metallurgical Transactions, vol. 15A, pp. 487-494. [ Links ]
Poorhaydari, K. 2021. A Comprehensive Examination of High-Temperature Hydrogen Attack-A Review of over a Century of Investigations. Journal of Materials Engineering and Performance, vol. 30, no. 11, pp. 7875-7908. Springer. https://doi.org/10.1007/s11665-021-06045-z [ Links ]
Pretorius, C., Mostert, R., Mukarati, T., Mathoho, V. 2021. Microstructural influences on the damage evolution and kinetics of high temperature hydrogen attack in a C-0.5 Mo welded joint. Suid-Afrikaanse Tydskrif Vir Natuurwetenskap En Tegnologie, vol. 40, no. 1, pp. 212-223. https://doi.org/10.36303/satnt.2021cosaami.40 [ Links ]
Welding Research Council. 2021a. WRC Bulletin 585: The α-Ω HTHA Model and the Time Dependent Prager Curves, ISSN 2372-1057. 2021b. WRC Bulletin 586: The α-Ω Loss of Containment Model for HTHA with Guidelines for FFS, ISSN 2372-1057. [ Links ]
 Correspondence:
R. Mostert
Email: roelf.mostert@up.ac.za
Received: 30 Nov. 2022
Revised: 20 Sept. 2023
Accepted: 29 Oct. 2024
Published: November 2024