


Services on Demand
Journal

Article
 English (pdf)
 Article in xml format
 Article references
 Send this article by e-mail
Indicators
Related links
-
 Cited by Google
 -
 Similars in Google
Share

 Permalink
South African Journal of Industrial Engineering
On-line version ISSN 2224-7890
S. Afr. J. Ind. Eng. vol.36 n.3 Pretoria Dec. 2025
https://doi.org/10.7166/36-3-3344
GENERAL ARTICLES
Improving Inventory Management at an Automotive Company by Applying the ABC-XYZ-FSN Classification Method
M. van As; J.H. Bührmann
School of Industrial Engineering, North-West University, South Africa
ABSTRACT
Automotive dealerships often face inefficiencies in spare parts inventory management owing to demand fluctuations, long backorder lead times, and inconsistent categorisation practices. At Dealership X, these issues have resulted in 37% overstock and 24% dead stock, leading to financial losses and reduced service efficiency. The aim of this study was to improve inventory control by analysing the dealership's stock data, evaluating current classification practices, and developing a more accurate reclassification approach. The research combined detailed data analysis with a review of established inventory management studies to identify proven methods for handling intermittent demand and obsolete stock. Based on these insights, the ABC-XYZ-FSN classification system was selected and applied to the dealership's dataset to provide a more reliable categorisation of parts. A user-friendly dashboard was also designed to display reclassified results, showing the category of each part, whether there is excess stock, and whether ordering is necessary. While implementation of the system fell outside the project scope, the results demonstrate that the ABC-XYZ-FSN classification method, supported by the dashboard, could improve stakeholder decisions, and is recommended for future adoption to reduce overstocking and to improve the management of critical parts.
OPSOMMING
Motorhandelaars staar dikwels ondoeltreffendheid in die bestuur van onderdele in die gesig as gevolg van vraagskommelings, lang leitye vir agterstandbestellings en inkonsekwente kategoriseringspraktyke. By Handelaar X het hierdie probleme gelei tot 37% oortollige voorraad en 24% dooie voorraad, wat lei tot finansiële verliese en verminderde diensdoeltreffendheid. Die doel van hierdie studie was om voorraadbeheer te verbeter deur die handelaar se voorraaddata te ontleed, huidige klassifikasiepraktyke te evalueer en 'n meer akkurate herklassifikasiebenadering te ontwikkel. Die navorsing het gedetailleerde data-analise gekombineer met 'n oorsig van gevestigde voorraadbestuurstudies om bewese metodes te identifiseer vir die hantering van onderbroke vraag en verouderde voorraad. Gebaseer op hierdie insigte, is die ABC-XYZ-FSN-klassifikasiestelsel gekies en toegepas op die handelaar se datastel om 'n meer betroubare kategorisering van onderdele te bied. 'n Gebruikersvriendelike paneelbord is ook ontwerp om herklassifiseerde resultate te vertoon, wat die kategorie van elke onderdeel toon, of daar oortollige voorraad is en of bestelling nodig is. Alhoewel die implementering van die stelsel buite die projekbestek geval het, toon die resultate dat die ABC-XYZ-FSN-klassifikasiemetode, ondersteun deur die paneelbord, belanghebberbesluite kan verbeter, en word aanbeveel vir toekomstige aanvaarding om oorvoorraad te verminder en die bestuur van kritieke onderdele te verbeter.
1. INTRODUCTION
The automotive industry in South Africa is one of the country's most dynamic sectors, contributing about 4.3% to gross domestic product and accounting for nearly 17% of manufacturing output [1]. Around 70% of locally manufactured vehicles are exported, positioning exports as the primary market for South African original equipment manufacturers (OEMs) and component suppliers [1] [2]. Seven major assemblers - BMW, Ford, Isuzu, Mercedes-Benz, Nissan, Toyota, and Volkswagen - dominate the sector, supported by about 500 component suppliers, of which 180 are first-tier suppliers. In this value chain, dealerships form a critical link between manufacturers and customers, competing both within and across networks.
Company X is one of such automotive dealership groups in South Africa, specialising in vehicle sales, servicing, and parts distribution. This study focuses on Dealership X, part of the wider Company X network, with a specific focus on its parts department. Although often overlooked, the parts department is an essential link between the sales, service, and maintenance departments. Effective inventory management is essential to its success, as it ensures parts availability, minimises downtime, and enhances customer satisfaction [3] [4]. Beyond supporting repairs, the department also generates revenue opportunities by promoting OEM accessories and upgrades, underscoring its role in dealership competitiveness.
Dealership X operates under Company X's selective inventory management policy, which categorises parts into movement classes that range from "very fast-moving" to "dead stock". This system requires dealerships to balance their stock lists against fluctuating demand and supply chain uncertainties. Ineffective stock management has significant implications, such as excess capital being tied up in slow-moving items, storage costs, lost sales, and delays in service delivery. Currently, Dealership X faces inefficiencies arising from the accumulation of dead stock, with 37% of parts overstocked and 24% classified as dead stock, resulting in higher holding costs, stock imbalances, and service delays. "Dead stock" refers to obsolete, phasing-out, or slow-moving items (known as categories E, F, Y, Z) that increase holding costs and reduce inventory turnover.
Long and unpredictable backorder lead times influence inventory control further. While overordering can temporarily alleviate stockouts, it often leads to excess inventory if demand shifts. Conversely, understocking delays service, disrupts cash flow, and reduces gross profit margins. These imbalances, where certain parts are overstocked while others are frequently unavailable, threaten the dealership's performance, tying up working capital while simultaneously failing to meet customers' needs. These holding costs increase financial pressures even more.
This project aimed to assess and improve inventory management at Dealership X. Specifically, it sought to analyse historical inventory trends, evaluate the categorisation system, and identify contributors to excess and dead stock. By focusing on EFYZ parts, the project aimed to quantify the financial impact of dead stock, investigate procurement patterns, and propose improvement strategies such as stricter stock control or refined reorder triggers. The goal was to reduce excess inventory, enhance order accuracy, and optimise stock levels, ultimately supporting operational efficiency and better decision-making in the dealership.
Section 2 reviews the relevant literature that informs the requirements for the proposed model. Section 3 outlines the methodology used to develop the system, while Section 4 presents a brief demonstration of the system and discusses its validation. Section 5 provides the conclusion and offers recommendations for further development of and research on the decision support system.
2. LITERATURE OVERVIEW
An organisation's success largely depends on how effectively it manages its inventory. Inventory management focuses on determining the appropriate amount of stock required to absorb irregularities in forecasts, customer demand, and supplier deliveries. The primary goal of inventory management is to achieve the target level of customer service, ensure cost-effective operations, and minimise the amount of capital tied up in inventory. Spare parts inventory management is particularly crucial in dealership environments, where vehicle servicing relies heavily on the timely availability of parts. Designing and managing spare parts systems is complex, as it requires considering multiple factors simultaneously, such as demand volume and frequency, part criticality, cost or value, and lead times for procurement or production. Spare parts management involves tasks such as classification, forecasting, and inventory control [6], with inventory control being the primary focus, while classification and forecasting serve as supporting functions.
In addition to traditional classification and forecasting methods, the literature emphasises several specialised inventory management models that have been developed specifically for spare parts environments. [7] introduced an integrated categorisation model that considers both supply-side characteristics (such as lead time and procurement uncertainty) and demand-side patterns (such as frequency and variability), combining these factors into a coordinated matrix to support more accurate stocking priorities. Similarly, a two-dimensional classification approach aligns supply and demand perspectives to reduce misclassification and improve decision-making for slow-moving or irregular-demand items [3]. To address the differing operational consequences of stockouts, [8] incorporated part criticality into classification decisions by integrating the "vital, essential, desirable" framework with the analytic hierarchy process, enabling a more structured evaluation of parts based on service impact. More recently, [17] advanced classification through a machine-learning-enhanced model combining ABC analysis with support vector machines, improving the identification of parts at risk of overstocking or obsolescence by learning from historical movement and profitability patterns. These models illustrate the wide range of analytical approaches that are available to manage spare parts effectively, each offering different strengths depending on data availability, demand volatility, and operational priorities.
The difficulties of managing spare parts systems are also highlighted, noting that the high number of stock keeping units (SKUs), OEM-imposed categorisation, and limited control over replenishment logic in dealerships can lead to overstocking of low-demand parts and understocking of critical components [11].
For forecasting and classification, a simple moving average method is suggested for handling intermittent demand when target fill rates (TFRs) are low, and bootstrapping techniques are recommended for situations requiring a high TFR [10]. A fuzzy rule-based multi-criteria model for classifying spare parts in inventory control is proposed, considering factors such as consumption value, unit cost, lead time, criticality, and similarity [11]. Their approach was specifically applied to a maintenance, repair, and operations inventory in an open-pit mining company.
It is emphasised that spare parts inventories differ from general inventory because of lumpy, highly variable demand patterns, which make traditional forecasting and inventory control methods less effective. [12]. Parts may remain inactive for long periods and suddenly experience urgent demand, which cannot be easily addressed by static reorder policies or simple ABC classification.
It is further noted that the lack of real-time inventory control and refined forecasting often leads to poor ordering decisions, creating a mismatch between supply and actual part needs [13]. Distribution management plays a crucial role in enhancing inventory performance throughout the supply chain. It is highlighted that leading companies manage variability rather than entirely adapting to it [14]. Failure to address variability proactively forces inventory systems to react, often resulting in poor decisions and higher costs throughout the network.
Focusing only on optimising local inventory could negatively affect the broader supply chain. For example, changes in warehouse replenishment behaviour can destabilise demand at distribution centres. Therefore, a proactive approach that integrates supplier and demand management with internal processes is essential. While this broader approach increases complexity, it allows points where variability intersects and where performance improvements are most needed to be identified. Conflicts between functions such as sourcing, inventory control, and demand planning must also be addressed. Variability in demand, often overlooked in relation to responsibility, contributes to inefficiencies [15], [16]. Adopting an integrated approach to distribution chain management enables better coordination, reduced variability, and improved overall performance.
Accurate classification forms the foundation of effective spare parts inventory management. Traditional methods, such as ABC analysis, which is based on annual consumption value, are widely used. ABC analysis groups inventory items into three categories: A (high-value, critical items), B (moderately important items), and C (low-value or non-essential stock). This method, often referred to as Pareto analysis or the 80/20 rule, reflects Vilfredo Pareto's principle that a small portion of inputs typically accounts for a large portion of outcomes. ABC analysis helps to prioritise control efforts, and is often enhanced when combined with other classification or decision-making methods [17]. However, it often overlooks variables such as demand unpredictability, part movement, and profitability [17] [5], prompting the development of advanced multi-criteria frameworks and hybrid classification tools.
A lean-centric approach is proposed [5] by integrating ABC-XYZ (value and demand fluctuation) with FSN analysis (fast, slow, non-moving) to target parts at risk of obsolescence. Their framework significantly reduces dead stock by identifying low-value, erratic-demand items (CZ-N class) that require minimal holding. Traditional classification schemes based solely on demand frequency often fail to align stocking decisions with actual business priorities, especially in environments with intermittent demand and significant cost variation.
The limitations of frequency-based methods are illustrated by a case study at a multinational electronics firm [12]. By introducing a demand value-based ABC classification, they reduced stock by over 50% and improved the service hit ratio by 17%, demonstrating the efficiency gains from more intelligent categorisation. They also emphasise tailoring forecasting methods to SKU behaviour: high-value parts received manual judgemental forecasting, while low-value, frequent C-class items were forecast using simplified six-month moving averages. This approach balances service levels against cost constraints, and is particularly useful in automotive dealerships with erratic demand for spare parts and diverse part criticality.
A key contributor to inefficiencies in spare parts management is the tendency for branches or facilities to make isolated inventory decisions that overlook network-wide availability. [18] emphasises that coordinating inventory and capacity planning across the supply value chain significantly improves overall performance. Their simulation-based study demonstrates how performance losses occur when capacity and inventory decisions are separated, especially in environments with demand variability or distributed stockholding.
This insight is particularly relevant to automotive dealership networks, where parts classified as obsolete may still have demand or availability at sister branches. However, without shared inventory visibility or redistribution policies, these parts are often left to age out while being reordered elsewhere, creating avoidable waste. Their findings suggest that integrated planning models, where inventory strategies are developed based on system-wide capacity and demand patterns, could significantly reduce this form of inefficiency [18]. Their work provides a theoretical foundation for implementing inter-branch inventory transfers or shared dashboards.
Forecasting intermittent demand is a key problem in spare parts management. A large comparative study [19] was conducted in the aviation sector, testing thirteen forecasting methods in varying demand profiles. The techniques included simple moving average (SMA), exponential smoothing, weighted moving average, Croston's method, and Holt's exponential smoothing. They developed a predictive error model to match forecasting methods to specific demand characteristics, using the average inter-demand interval (ADI) for demand frequency and the coefficient of variation for variability. For example, Holt's exponential smoothing works best with frequent, stable demand, while Croston's method suits irregular patterns. This approach enhances forecasting accuracy and minimises replenishment errors, but it requires detailed historical demand data, which is not always readily available.
The literature highlights that effective spare parts inventory management is critical to organisational success, particularly in automotive dealership environments where service delivery depends on the timely availability of parts. The management of such inventories is quite complex, requiring careful consideration of demand patterns, part criticality, cost, and lead times, alongside classification, forecasting, and inventory control functions. Traditional methods, such as ABC analysis, provide a foundational approach for prioritising inventory control, but are limited in their ability to account for demand variability, irregular movement, and profitability, requiring that more advanced multi-criteria and hybrid classification frameworks be adopted. Lean-centric approaches, such as integrating ABC-XYZ with FSN analysis, have shown their effectiveness in identifying obsolete or slow-moving items, reducing dead stock, and supporting informed stocking decisions. Furthermore, forecasting methods tailored to SKU behaviour, such as the application of SMA, exponential smoothing, or Croston's method for intermittent demand, enhance replenishment accuracy and help to minimise stock imbalances. The literature also emphasises the importance of integrating inventory management throughout the broader supply chain, highlighting that isolated decisions at individual branches could worsen inefficiencies. In contrast, coordinated planning and inter-branch visibility could reduce waste, backorder lead times, and financial losses. Together, these insights suggest that a structured, multi-dimensional, and network-aware approach to spare parts management, combining advanced classification, tailored forecasting, and proactive distribution strategies, would provide a strong foundation for improving inventory performance, reducing dead stock, and enabling more cost-effective, service-oriented operations in dealership networks.
3. METHODOLOGY
The development of the decision support system was completed in three phases: analysing the current state, identifying the system requirements, and designing the system. The steps, along with the findings of each step, are described in the sections below. This was done because the steps were executed in sequential order, and the results of the previous steps were needed to determine the course of action for the next step.
3.1. Phase 1: Current state data analysis
The first phase of the study aimed to establish a clear understanding of the current state of Dealership X's inventory performance and the operational difficulties its parts department faced. Two datasets were analysed to form this baseline. The first was a detailed part-level screenshot of stock on hand in March 2025, which included information such as part number, movement category, on-hand quantity, maximum potential quantity, on-hand value, unit cost, and the dates of last purchase and last sale. The second dataset was a monthly summary covering the period from March 2024 to March 2025, which differentiated between current and dead stock, gross profit performance, sales, cost of sales, and the proportion of purchases classified as dead stock. Together, these sources provided a current state view and a historical perspective on the trends in inventory behaviour.
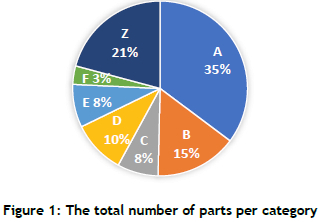
The analysis of KPIs in Figure 1 highlights the scale of inefficiencies in the current system. According to the system classifications, the largest category was A parts, representing 35% of the total, followed by Z parts at 21%, with the combined EFYZ categories accounting for 32% of all items. (Please note that the Y category accounted for only 0.007% of all parts, and so was excluded from the remainder of the study.)
Dead stock levels remained consistently high, averaging 24% of total inventory for the thirteen months. When dead stock is measured as a proportion of current stock only, the figures appear lower, fluctuating between 13% and 23%. However, when measured against the total stock, the range extends from 17% to 27%. This indicates that the practice of reporting only against current stock underestimates the scale of the problem. Further analysis of excess versus shortage confirmed that the dealership faced a significant imbalance, with excess stock value accounting for roughly 88% of the total variance, while shortages accounted for only 12%. Shortages were most evident in the A and B category parts, whereas excess inventory was consistently observed in the other categories.
The analysis also highlighted purchasing practices that negatively affected profitability. Even though large volumes of dead stock were already on hand, additional EFYZ parts continued to be ordered monthly. This is illustrated in Figure 2, where a ratio index was calculated to represent the dead stock on hand. A ratio index compares the value of a variable in each period to a reference (base) period, expressed as a percentage. It is calculated by dividing the current period value by the base period value and then multiplying the result by 100. Values above 100 indicate an increase relative to the base period, while values below 100 indicate a decrease.
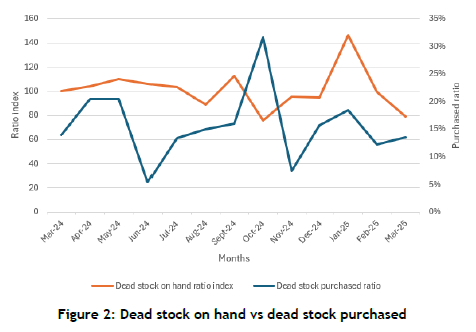
This behaviour not only increased the dead stock problem but also had a significant financial impact. Periods with reduced dead stock purchases generally aligned with higher gross profit index values, indicating a direct negative relationship between the over-purchasing of obsolete or phasing-out items and overall dealership profitability.
A closer examination of operational practices and irregularities revealed additional inefficiencies. One of them that had a critical impact was the mismatch between system-assigned categories and the way in which parts were actually handled. While 32% of the parts were classified as EFYZ by the system, analysis of operational practices suggested that as many as 85% were treated as if they were in dying categories, leaving only 15% managed under normal part management. This inconsistency emphasised weaknesses in how categorisation rules were applied in practice. Analysis of part age and movement emphasised this issue even more, revealing that numerous items classified as fast-moving A or B parts experienced extended periods of no movement. In contrast, almost half of the Z-category parts did not follow the anticipated ageing trends. These irregularities emphasised inefficiencies in both the classification method logic and the ordering practices that depended on it.
The stock health assessment reinforced these observations by showing that categories C, D, E, F, and Z consistently carried excess value, making further replenishment unnecessary until stock was reduced. Category A, which is supposed to represent the most critical and fastest-moving items, showed not only the biggest number of shortages but also significant excess. This suggested inefficiencies in replenishment decision-making and a misalignment between actual demand and ordering behaviour.
The trends observed in the datasets could be transformed into a set of root causes. The first and most evident cause was the continued purchasing of EFYZ parts, which increased the accumulation of dead stock despite already high parts-on-hand levels. A second cause was the misalignment between the system's assigned categories and the actual behaviour of parts, leading to inappropriate part management and ordering. This misalignment was intensified by the fact that the classification method was based solely on demand, which might not have been sufficiently accurate to reflect the true behaviour of the part. A third issue lay in the lack of coordination between branches, which prevented the redistribution of parts that might have been obsolete in one location but still in demand elsewhere. Finally, the lack of refined forecasting and performance monitoring left the dealership reliant on reactive ordering. This problem led to long and unpredictable backorder lead times, resulting in both overstocking of some items and shortages of others.
In summary, these observations offer a clear and evidence-based perspective on the current situation. Dealership X faced ongoing challenges with persistent dead stock, extensive overstock, and shortages in its most critical categories. Existing purchasing practices often worsened these issues, while inconsistencies in classification and insufficient forecasting contributed further to inventory imbalances. This baseline analysis underscored the need for a more systematic and accurate approach to inventory management, laying the groundwork for the subsequent development of system requirements and design.
3.2. Phase 2: System requirements
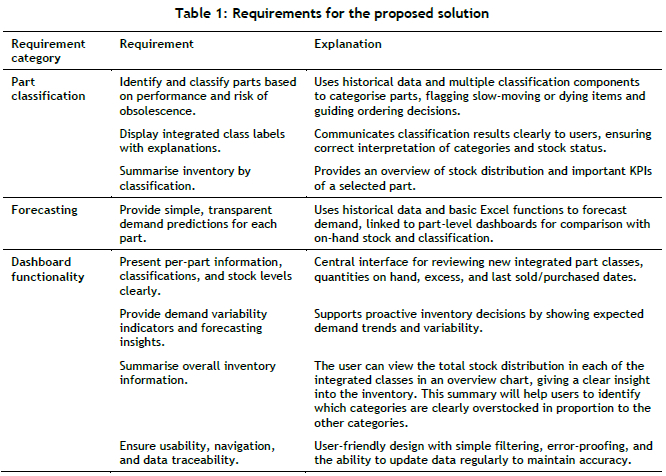
The analysis presented in Section 3.1, combined with the literature reviewed in Section 2, provided the foundation for defining the requirements of the proposed solution. The requirements were subdivided into three subsections of the proposed solution: part classification, forecasting, and dashboard functionality.
3.3. Phase 3: System design
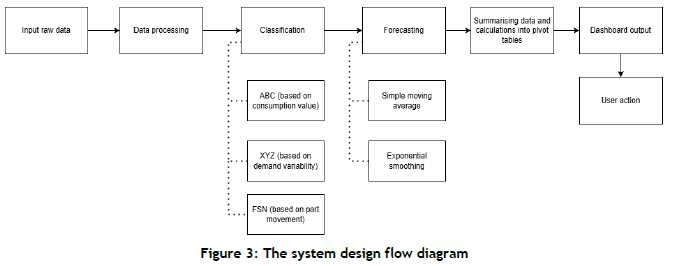
A lean-based, multi-criteria classification system combining ABC, XYZ, and FSN analysis is proposed as an inventory classification model. When adapted from the developed approach, this model provides a structured, behaviour-driven method for identifying parts that are no longer economically or operationally justifiable to stock [5]. Figure 3 illustrates the workflow of the proposed solution.
The ABC-XYZ-FSN framework introduces a layered classification approach, segmenting parts along three behavioural dimensions: value consumption, demand variability, and movement frequency. In the first phase, the ABC classification is applied, based on the annual consumption value of each part, using the Pareto principle to highlight items that contribute most significantly to the dealership's inventory investment. The second layer, XYZ analysis, evaluates the coefficient of variation (CV) in monthly demand, categorising parts as having constant demand (X), moderate demand (Y), or highly irregular demand (Z). The CV for each part is calculated by first determining the population standard deviation of its monthly sales quantities over the most recent 12-month period. This value is then divided by the corresponding average monthly sales for the same period. The ratio is converted to a percentage to allow for easier interpretation and comparison of variability among different parts. Parts with CV < 50% are classified as X, those with 50-100% as Y, and those exceeding 100% as Z. Finally, FSN classification assesses movement behaviour by measuring the average stay of a part in storage, distinguishing fast-, slow-, and non-moving items. Parts sold in the previous 20 days are categorised as F (fast-moving), those sold in 21-90 days as S (slow-moving), and those unsold for more than 90 days as N (non-moving)
By integrating these three dimensions, each part is assigned an integrated classification label, such as A-X-F or C-Z-N. Particular attention should be given to parts that fall in the C-Z-N category, as they are low in consumption value, have highly irregular demand patterns, and show no recent movement. [5] identify these items as carrying the highest risk of obsolescence and waste. The results can then support inventory control decisions, such as blocking automatic reorders for C-Z-N parts, prioritising A-X-F parts for active replenishment, and reviewing intermediate categories such as B-Y-S, based on performance trends.
This solution offers a data-driven, objective approach to identifying obsolete stock, and aligns with lean principles by promoting waste elimination, enhancing visual control over inventory health, and facilitating continuous improvement. This lean-based classification and filtering method provides a structured approach to enhancing inventory control, reducing dead stock, and improving procurement decision-making.
To contribute to the classification system, part-specific and class-level demand forecasting was incorporated to provide additional insights to inventory control. Two forecasting methods were used in Excel: a three-month SMA and exponential smoothing. These basic forecasting methods were used because an accurate ADI could not be calculated for the study because of the lack of that type of data, and as the main focus of the solution was not forecasting. The SMA was applied at the individual part level, calculating each part's forecast as the average demand over the previous three months. This approach smoothed shortterm irregularities while reflecting recent demand trends, providing a clear numerical forecast to be used as a KPI.
Exponential smoothing was applied at the integrated class level, giving more weight to recent data while still considering historical observations. This method allows forecasts to adapt quickly to recent changes while maintaining awareness of longer-term patterns. For intermittent demand, as in Croston's method, exponential smoothing separately models both the demand size and the intervals between demands, resulting in more accurate projections for parts with irregular demand patterns. Class-level forecasts are particularly effective for visual presentation on the dashboard, as they show aggregated demand patterns for each category.
In this study, the forecasts were also used to enhance the XYZ classification by providing demand insights for each part. Monthly sales were smoothed using SMA and exponential smoothing to show true demand patterns, which were then used to calculate the CV. This allowed parts to be assigned to the appropriate XYZ category, based on demand variability. By combining these demand-based insights with ABC (value) and FSN (movement) categories, the classification system more accurately represented actual part importance and usage. This approach helped users to understand how the XYZ classification was determined, linking the forecasting results directly to part behaviour and inventory performance.
Following the classification and forecasting processes, the results were incorporated into an interactive dashboard to make the information practical and usable. While the classification process segmented parts into ABC, XYZ, and FSN categories and combined them into integrated class codes, these insights alone would be limited if maintained only in raw data or calculation sheets.
The dashboard offered a user-friendly, integrated platform that provided direct access to part-level details, classification results, and summary insights. Users could determine whether a part should be reordered or held without having to navigate through multiple datasets. By integrating both the classification outputs and forecasting calculations, the dashboard transformed the underlying data into a decision-support tool. This design directly addressed the project's root causes by enabling proactive stock management, highlighting high-risk or low-demand parts, and supporting informed procurement decisions throughout the dealership by improving part performance and the alignment of parts behaviour.
4. SYSTEM DEMONSTRATION AND VALIDATION
This section provides a step-by-step guide on how to use the dashboard, along with a validation summary.
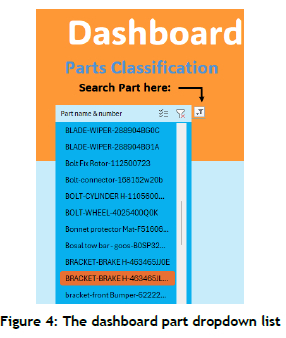
The first step in using the dashboard involves selecting a part to review. Users in the parts department at Dealership X can choose a part by name or number from a dropdown list on the left side of the dashboard, as shown in Figure 4. Only one part can be selected at a time. To simplify the process, a search function is provided, allowing users to locate a part quickly by typing either its name or part number. Each part is listed with both identifiers on a single line, ensuring that parts with the same name but different numbers can be accurately distinguished. This feature streamlines part selection and reduces the time spent navigating lengthy lists.
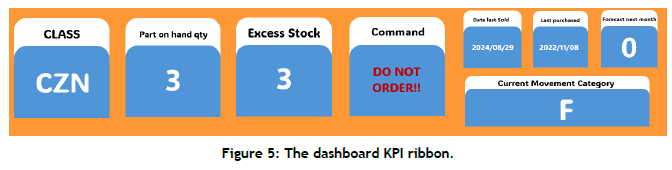
After selecting a part, its integrated classification and KPIs are displayed in the top ribbon of the dashboard, as shown in Figure 5. Critical KPIs, such as "Part on hand qty" and "Excess stock", help users to determine whether to place an order. The excess stock is calculated by comparing the parts' on-hand quantity with the dealership-defined "max potential", highlighting parts that may be overstocked. For parts classified as CZN or CZS, a command such as "Do not order" or "Review excess for ordering" guides the user, directly addressing the root cause of misalignment between part behaviour and ordering practices.
Additional KPIs were "Date last sold" and "Date last purchased", supporting monitoring of part activity and alignment with category expectations, as well as "Current movement category", which can be compared with the integrated class to emphasise that the new classification method is more accurate. The "Forecast next month", calculated using a three-month simple moving average, provides numerical demand guidance. Overall, the ribbon integrates critical information of a selected part into a clear overview, ensuring that users can make informed decisions and manage stock effectively.
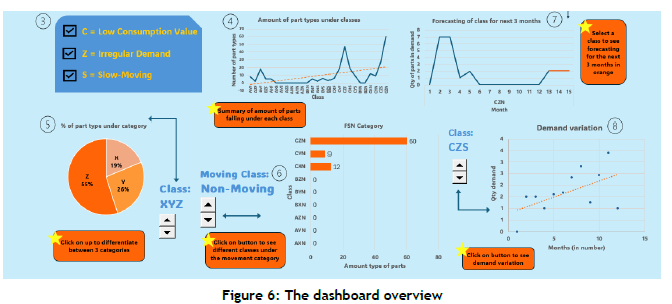
The rest of the dashboard provides a comprehensive and interactive view of inventory and part performance, as shown in Figure 6. Status labels for each letter of a part's integrated class are displayed in step 3 to ensure user-friendliness and help to interpret the classification results. This also supports performance monitoring, as the system can be updated regularly to keep classifications updated. An overview chart (step 4) summarises the number of parts in each integrated class, giving the user a snapshot of the overall inventory distribution. Users can also explore separate category views using navigation buttons to shift between ABC, XYZ, or FSN graphs, allowing focused analysis of demand variability or movement patterns (step 5).
FSN-focused charts highlight part movement for each class, showing that CZ-class parts dominate in the fast-, slow-, and non-moving categories. This identifies CZN, CZS, and CZF as the largest integrated classes in the total inventory (step 6). Forecasting for a selected class is presented using an exponential smoothing method, showing projected demand over the next three months, even though the forecast is calculated for only the next month. This provides a visual and interpretable trend to support ordering decisions (step 7).
Demand variation graphs illustrate inconsistencies or trends in each integrated class. Classes with scattered, negative correlations indicate highly irregular demand (Z-class), while those with linear correlations reflect stable demand patterns (X-class), helping users to differentiate between demand behaviours (step 8). Finally, the pop-up instructions in Figure 6, as well as the numbered steps in circles, guide users through dashboard navigation and functions, ensuring user-friendliness, and can be hidden once the user is familiar with the system. Overall, the dashboard consolidates classification, forecasting, and demand insights into a single, interactive platform, enabling informed and efficient decision-making for inventory management.
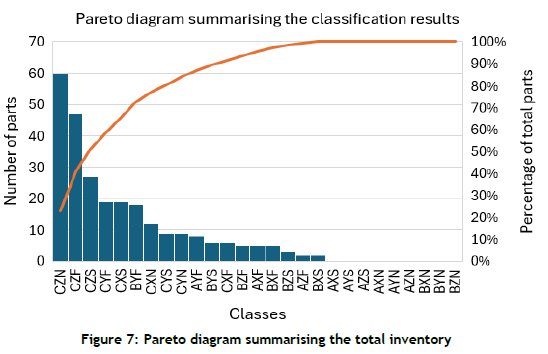
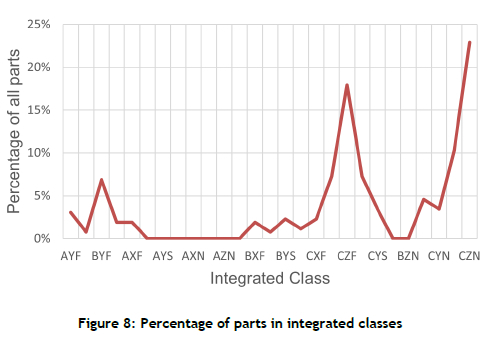
To confirm that the integrated classification method was applied correctly, a Pareto chart was generated showing the total inventory classified under each class (Figure 7). The chart clearly illustrates that the CZN and CZF categories contain the largest number of parts but contribute the least to overall consumption value, consistent with the expected characteristics of these classes. This visual representation provides evidence that the classification framework accurately reflects both part quantity and usage patterns, supporting the validity of the implemented classification method.
The classification of current parts using the ABC, XYZ, and FSN classification method based on historical data revealed key insights into inventory distribution and risk. Using the Pareto principle for ABC classification, Class A parts, which constitute only 6% of all items, account for the largest portion of consumption value. In comparison, Class C parts make up 79% of items but only 20% of total consumption. This highlights that C-class parts, although numerous, are rarely used, and an excessive stock of these items contributes significantly to dead stock.
The XYZ analysis, based on demand variability measured by the CV of monthly sales, shows that 55% of the parts fall into the Z category, indicating highly irregular demand. This is a concern, as it is the majority of the inventory and makes reliable ordering and stock management problematic.
The FSN classification, determined by the average stay in storage since the last sale or purchase, reveals that 44% of the parts are fast-moving (F), 31% are non-moving (N), and the remaining 25% are slow-moving (S). Slow-moving items are at risk of becoming non-moving if not carefully monitored, emphasising the need for controlled ordering and stock review.
Combining the three dimensions into an integrated classification code (e.g., AXF, BYS, CZN) provides a multi-dimensional view of each part. The proportion of parts in each integrated class is shown in Figures 7 and 8. The largest group is CZN, comprising 23% of parts (60 items), followed by CZF at 18% (47 items). CZN parts are low in consumption value, highly irregular in demand, and largely non-moving, making them high-priority candidates for procurement restrictions. Addressing these parts would be critical to reducing excess stock and optimising inventory management at Dealership X.
As part of the developed solution, it is also recommended that Company X integrate this dashboard and classification method into a coordinated interbranch system. In addition, it is recommended that they revise their policy to require the dealership to check the availability of parts at other dealerships before placing an order for a part that is not in stock. This would enable the dealerships to work together by helping one another out, essentially by clearing their own excess stock while assisting another dealership. This would also reduce backorder lead times, as the customer would likely not have a long wait for a part that should be ordered locally rather than internationally. This would then decrease the chance of the customer cancelling their order after the dealership had already placed the part order from the warehouse. This is only a recommendation, as it was outside the scope of the project's development owing to the unavailability of data from other dealerships.
The validation of the interactive dashboard, which integrates the new classification system and basic forecasting, confirmed its effectiveness in addressing the key inventory problems at Dealership X. These included dying parts still being ordered despite low or no demand, misalignment between system-assigned categories and actual part behaviour, lack of part performance monitoring, and reliance on a demand-only classification method.
The first critical issue, which was the ordering of dying parts, was addressed by the dashboard, which highlights non-moving or near-obsolescence items, displays on-hand quantities and excess stock, and issues clear commands such as "Do not order". This ensures that purchasing is focused only on parts with ongoing demand, reducing financial waste and preventing further accumulation of obsolete stock.
The second root cause, which was misalignment between system-assigned categories and actual part behaviour, was improved by the integrated ABC-XYZ-FSN classification. By considering consumption value, demand variability, and part movement together, the dashboard provides a much more accurate reflection of part behaviour. Users can easily interpret part-level details and overall inventory summaries, ensuring that decisions are informed by real trends rather than by outdated or incomplete categorisations.
The third root cause, which was a lack of continuous monitoring, was resolved through real-time updates of KPIs, including on-hand stock, excess value, last-purchased/sold dates, and demand variability. This allows users to track trends continuously, detect risks early, and act proactively, rather than waiting for monthly reviews. The classification can be updated as frequently as new data is entered, providing users with flexibility and promoting timely, accurate decision-making.
Finally, the fourth root cause, which was reliance on demand-only classification, was addressed by combining ABC, XYZ, and FSN into a single integrated method. This approach provides a more detailed view of part behaviour, combining KPIs, forecasting, and overall inventory summaries into a clear visual interface. The dashboard reduces human error, enhances understanding of the method, and improves practical usability compared with the previous system.
In summary, the validation demonstrates that the new dashboard delivers a more accurate, practical, and user-friendly approach to inventory management. It improves classification accuracy, supports informed ordering decisions through forecasting and KPIs, enables proactive control of dead stock, and replaces monthly reclassification with continuous monitoring, ensuring that Dealership X can manage its inventory efficiently and effectively.
5. CONCLUSION
The study demonstrates that integrating a multi-dimensional ABC-XYZ-FSN classification method into an interactive, user-friendly dashboard provides a significant improvement over traditional inventory management practices at Dealership X. Analysis of historical stock data and operational practices highlighted persistent problems, such as high dead stock levels, overstocking of low-demand items, misalignment between system-assigned categories and actual part behaviour, and dependence on demand-only classification methods. These inefficiencies have historically contributed to financial losses, extended backorder lead times, and led to poor service levels. By applying a structured framework that considers consumption value, demand variability, and movement frequency, the proposed approach provides a more accurate reflection of part behaviour, identifies high-risk items subject to obsolescence, and prioritises stock management efforts based on actual inventory patterns rather than on static categorisation.
The dashboard functions as a practical decision-support tool, integrating part-level classifications, KPIs, and basic forecasting in a single interactive interface. Critical insights such as excess stock, last purchase and sale dates, and demand variability allow users to make informed, data-driven decisions. The system does not prevent users from ordering parts, but it serves as a guide, improving awareness of stock status, reducing the risk of human error, and supporting alignment with best practices. For example, items classified as low-value, highly irregular in demand, and non-moving (C-Z-N) are clearly flagged, enabling users to consider these factors before ordering without imposing hard restrictions. This system serves as guidance that maintains operational flexibility while encouraging more precise and consistent inventory decision-making.
Continuous monitoring of inventory health is another key advantage. Rather than relying on monthly reclassifications, the system allows real-time updates of KPIs, supporting proactive management and early identification of risks. Part- and class-level forecasting enhances decision-making further by showing expected demand patterns and variability, providing actionable guidance for planning replenishment. Overall, the dashboard translates complex inventory data into a visually accessible and practical tool that enhances stakeholder understanding of part behaviour, supports lean principles, and encourages the systematic management of dead stock and overstock situations.
As part of the solution, it is also recommended that Company X consider expanding this dashboard and classification method into an inter-branch coordinated system. If implemented, dealership staff could check the availability of parts in other branches before placing external orders, enabling redistribution of excess stock within the network. This coordination could reduce backorder lead times, minimise international procurement, and enhance customer satisfaction by decreasing the likelihood of cancellations caused by long wait times. Although this recommendation was not implemented in the current project because of data unavailability and scope limitations, it offers a logical extension to enhance inventory efficiency, minimise financial waste, and foster collaboration across the dealership network.
Future work should focus on implementing the integrated classification system and dashboard in Dealership X's operational environment to assess real-world performance, measure financial and operational improvements, and quantify reductions in dead stock. Further development could incorporate advanced forecasting techniques, predictive analytics, or machine-learning models to enhance accuracy for intermittent demand. Integrating the dashboard into procurement systems and branch networks would enable automated alerts and inter-branch stock redistribution, further improving coordination and reducing backorder lead times. Bigger studies could also examine the impact of continuous monitoring and decision-support dashboards on overall service levels and inventory performance over time. Finally, training and change management strategies should be considered to ensure that dealership staff fully adopt and use the dashboard effectively, maximising its potential to reduce human error and support data-driven decision-making.
In conclusion, this study validates that a multi-dimensional classification framework integrated into an interactive dashboard offers a practical, user-friendly, and data-driven approach to inventory management. While advisory in nature and not restricting operational flexibility, the system enhances visibility, supports informed decisions, reduces human error, and promotes lean inventory practices. Recommendations for future adoption, including inter-branch coordination, provide a path to further operational improvements, demonstrating that structured, behaviour-informed inventory management can deliver substantial benefits and strengthen overall dealership performance.
REFERENCES
[1] J. Lorentzen, "The absorptive capacities of South African automotive component suppliers," World Development, vol. 33, no. 7, pp. 1153-1182, 2005. https://doi.org/10.1016/j.worlddev.2005.04.006 [ Links ]
[2] L. Edwards and S.S. Golub, "South Africa's international cost competitiveness and exports in manufacturing," World Development, vol. 32, no. 8, pp. 1323-1339, 2004. https://doi.org/10.1016/j.worlddev.2004.03.005 [ Links ]
[3] A. A. Syntetos, M. Keyes, and M.Z. Babai, "Demand categorisation in a European spare parts logistics network," International Journal of Operations & Production Management, vol. 29, no. 3, pp. 292-316, 2009. https://doi.org/10.1108/01443570910939005 [ Links ]
[4] S. Mohebbi and X. Li, "Coalitional game theory approach to modeling suppliers' collaboration in supply networks," International Journal of Production Economics, vol. 169, pp. 333-342, 2015. https://doi.org/10.1016/j.ijpe.2015.08.022 [ Links ]
[5] R. Mor, A. Bhardwaj, V. Kharka, and M. Kharub, "Spare parts inventory management in warehouse: A lean approach," International Journal of Industrial Engineering & Production Research, vol. 32, no. 2. 2021. https://doi.org/10.22068/ijiepr.1110 [ Links ]
[6] A. Bacchetti and N. Saccani, "Spare parts classification and demand forecasting for stock control: Investigating the gap between research and practice," Omega, vol. 40, pp. 722-737, 2012. https://doi.org/10.1016/j.omega.2011.06.008 [ Links ]
[7] P. Jouni, J. Huiskonen, and T. Pirttila, "Improving global spare parts distribution chain performance through part categorisation: A case study," International Journal of Production Economics, vol. 133. no. 1, pp. 164-171, 2011. https://doi.org/10.1016/j.ijpe.2010.12.025 [ Links ]
[8] L.R. Muniz, S.V. Conceição, L.F. Rodrigues, J.F. de Freitas Almeida, and T.B. Affonso, "Spare parts inventory management: A new hybrid approach," The International Journal of Logistics Management, vol. 32, no. 1, pp. 40-67, 2021. https://doi.org/10.1108/ijlm-06-2020-0253 [ Links ]
[9] S. Bhalla, E Alfnes, H.H. Hvolby, and F. Sgarbossa, "Advances in spare parts classification and forecasting for inventory control: A literature review," IFAC-PapersOnLine, vol. 54, no. 1, pp. 982987, 2021. https://doi.org/10.1016/j.ifacol.2021.08.118 [ Links ]
[10] J.R. do Rego and M.A. de Mesquita, "Demand forecasting and inventory control: A simulation study on automotive spare parts," International Journal of Production Economics, vol. 161, pp. 1 -16, 2015. https://doi.org/10.1016/j.ijpe.2014.11.009 [ Links ]
[11] S. Sarmah, and U. Moharana, "Multi-criteria classification of spare parts inventories: A web based approach," Journal of Quality in Maintenance Engineering, vol. 21, no. 4, pp. 456-477, 2015. https://doi.org/10.1108/jqme-04-2012-0017 [ Links ]
[12] R. Fildes, K. Nikolopoulos, S.F. Crone, and A.A. Syntetos, "Forecasting and operational research: A review," Journal of the Operational Research Society, vol. 59, no. 9, pp. 1150-1172, 2008. https://doi.org/10.1057/palgrave.jors.2602597 [ Links ]
[13] R.H.Teunter, A.A.Syntetos and M.Z. Babai, "Intermittent demand: linking forecasting to inventory obsolescence," European Journal of Operational Research, vol. 214, no. 3, pp. 606-615, 2011. https://doi.org/10.1016/j.ejor.2011.05.018 [ Links ]
[14] H.L. Lee, "The triple-A supply chain," Harvard Business Review, vol. 82, no. 10, pp. 102-113, 2004. [ Links ]
[15] J.E.V. Aken, "Management research based on the paradigm of the design sciences: The quest for field-tested and grounded technological rules," Journal of Management Studies, vol. 41, no. 2, pp. 219-246, 2004. https://doi.org/10.1111/j.1467-6486.2004.00430.x [ Links ]
[16] O. Bounou, A. El Barkany, and A. El Biyaali, "Inventory models for spare parts management: A review," International Journal of Engineering Research in Africa, vol. 28, pp. 182-198, 2017. https://doi.org/10.4028/www.scientific.net/JERA.28.182 [ Links ]
[17] S. Baik, L. Alasmari, M. Alamoudi, D. Akmal, L. Alobaidi, and W. Mirdad, W., "Enhancing spare parts inventory management through machine learning based classification," in 14th Annual International Conference on Industrial Engineering and Operations Management (IEOM), Dubai, UAE, 2024. https://doi.org/10.46254/AN14.20240502 [ Links ]
[18] W. Jammernegg, and G. Reiner, "Performance improvement of supply chain processes by coordinated inventory and capacity management," International Journal of Production Economics, vol. 108, no. 1-2, pp. 183-190, 2007. https://doi.org/10.1016/j.ijpe.2006.12.047 [ Links ]
[19] A.A. Ghobbar and C.H. Friend, "Evaluation of forecasting methods for intermittent parts demand in the field of aviation: A predictive model," Computers & Operations Research, vol. 30, no. 14, pp. 2097-2114, 2003. https://doi.org/10.1016/S0305-0548(02)00125-9 [ Links ]
* Corresponding author: joke.buhrmann@nwu.ac.za
ORCID® identifiers
M. van As
https://orcid.org/0009-0003-3574-7366
J.H. Bührmann
https://orcid.org/0000-0003-0657-9933
