




Services on Demand
Journal

Article
 English (pdf)
 Article in xml format
 Article references
 Automatic translation
 Send this article by e-mail
Indicators
Related links
-
 Cited by Google
 -
 Similars in Google
Share

 Permalink
South African Journal of Industrial Engineering
On-line version ISSN 2224-7890
S. Afr. J. Ind. Eng. vol.36 n.4 Pretoria Dec. 2025
https://doi.org/10.7166/36-4-3230
GENERAL ARTICLES
Simulation Modelling as a Tool for Automotive Wiring Assembly Optimisation: Application in Real Case Studies
M. AdelI; R.M. El-ZahryI; M. HeshmatI, II, *
IDepartment of Mechanical Design and Production Engineering, Assiut University, Assiut, Egypt
IINingbo China Institute for Supply Chain Innovation, MIT Global SCALE Network, Ningbo, China
ABSTRACT
Discrete-event simulation is a valuable tool for optimising production plants. The present study explores an automotive power cable wiring assembly line's process through four real case studies, modelled using actual production data and simulated in ARENA software. Statistical analysis using PRISM identified bottlenecks, waiting times, and work-in-progress, offering key insights for improvement. The models are adaptable to other assembly lines, with potential advancements in scheduling and machine learning. By combining simulation modelling and statistical validation, the study provides practical recommendations to enhance efficiency, reduce waste, and improve performance in automotive manufacturing.
OPSOMMING
Diskrete-gebeurtenissimulasie is 'n waardevolle hulpmiddel via die optimering van produksie-aanlegte. Die huidige studie ondersoek die proses van 'n voertuig kragkabelmonteringlyn deur vier werklike gevallestudies, gemodelleer met werklike produksiedata en gesimuleer in ARENA-sagteware. Statistiese analise met PRISM het bottelnekke, wagtye en werk-in-voortgang geïdentifiseer, wat sleutelinsigte vir verbetering bied. Die modelle is aanpasbaar vir ander monteerlyne, met potensiële vooruitgang in skedulering en masjienleer. Deur simulasie-modellering en statistiese validasie te kombineer, verskaf die studie praktiese aanbevelings om doeltreffendheid te verhoog, afval te verminder en prestasie in voertuig vervaardiging te verbeter.
1. INTRODUCTION
The automotive industry faces increasing demand for production efficiency, especially in complex systems such as automotive wiring assembly lines. The wiring assembly process in the automotive industry is complex and has a significant impact on product quality and cost. Despite extensive studies applying simulation to optimise production lines, many overlook multi-case validation using actual production data paired with statistical benchmarking. This creates a gap in understanding how simulations can be both realistic and practically impactful in real-world environments.
This paper presents a simulation-based study aimed at optimising these processes, guided by real-world case studies and statistical validation. The study investigates performance enhancement in an actual automotive wiring harness assembly line through discrete-event simulation (DES), focusing on four progressively complex scenarios from a real production environment. By integrating simulation modelling with statistical validation, the study not only identifies operational bottlenecks and resource inefficiencies but also evaluates targeted improvements. The contribution extends beyond empirical analysis by positioning simulation-driven decisions within a broader framework to optimise a production system. This research aims to bridge the gap between diagnostic modelling and prescriptive improvement, addressing a common limitation in the applied simulation literature.
The objective of the present research is to develop and validate a simulation-based methodology for automotive power cable harness lines. The proposed methodology uses DES using ARENA software, complemented by statistical verification using GraphPad Prism. The objectives of the present study are to model existing assembly lines ("as-is") based on real production data, to identify inefficiencies and bottlenecks, to validate simulation reliability through statistical analysis, and to propose a replicable framework for production line optimisation. For confidentiality, the company providing data is referred to as "Cables LE" as depicted in Figure 1.
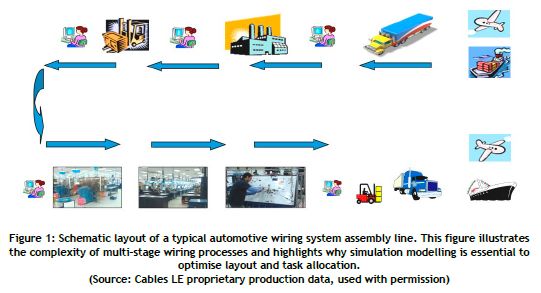
Simulation has been widely applied to optimise production lines, addressing problems such as unreliable machines and stochastic intermediate buffers. Studies have modelled real-world cases to analyse line performance, bottlenecks, and inefficiencies [17], [18]. For instance, DES was used to model production lines using historical data, revealing key probability distributions for machine downtime and uptime [18]. In [1], DES analysed the waiting times in a university printing shop, providing valuable operational insights.
Balancing and scheduling assembly lines have been pivotal research areas. Assigning tasks to workstations along assembly lines using simulation models and genetic algorithms enhanced efficiency in automotive wiring systems [8]. In addition, methods to reduce cycle time and time losses in vehicle assembly lines were explored [10]. Some studies focused on scheduling automated guided vehicles alongside machines in flexible manufacturing systems, incorporating simulation techniques [20]. Simulation-based optimisation has also enhanced garment assembly line scheduling [3].
Researchers have integrated advanced techniques such as fuzzy logic and machine learning with simulation models. For example, combining DES with adaptive neuro-fuzzy inference systems mapped production rates against dominant factors, boosting accuracy [19]. Other innovations include modelling mixed assembly lines in Industry 4.0 [4] and virtual environment simulation for cable layout design [12].
Recent studies have continued to evolve simulation applications. Assembly line balancing, sensitivity analysis, and process optimisation using simulation software such as ARENA have been prominent [6], [9]. Specific applications include developing simulation training guidelines [9] and optimising wiring harness logistics flows [15]. In addition, methodologies integrating lean approaches with simulation have improved productivity in multi-model assembly lines [5]. Simulation models for wire harness design and car production lines have also been refined using the SimPy library [14]. Function-integrated harness design was explored using additive manufacturing, underscoring the evolving complexity of assembly lines and the need for adaptable modelling tools [23]. Meanwhile a hybrid optimisation framework was introduced combining Harris Hawks metaheuristics with cellular automata, illustrating how algorithmic intelligence can enhance system-level simulation performance - a concept that informs future integration with tools such as KNIME [22]. The proceedings from CoMSO 2021 [24] further emphasised the rising role of simulation-led optimisation in industrial engineering, reinforcing the methodological foundation for extending the current study with machine-learning-based analytics and dynamic scheduling.
To address the problems outlined above, a simulation-based methodology was developed, as detailed in the next section.
2. THE PROPOSED METHODOLOGY
This section details the simulation framework, statistical methods, and data analytics tools used in our study. Emphasis is placed on model construction, validation techniques, and workflow design using ARENA and GraphPad Prism.
ARENA simulation software models production lines as event-driven systems involving entities, processes, resources, and queues. The simulation inputs include process flow, timing data, resource availability, arrival rates, and capacity limits [2,11].
2.1. Model assumptions
The simulation models are built on the following assumptions:
• Timing and flow data are derived from operational records but streamlined for simulation accuracy.
• Machine and operator behaviour is modelled using average performance over several production weeks.
• Rework stations reflect the real layout but are abstracted for simplicity.
• Variability is constrained within documented historical performance parameters.
These assumptions ensure that models reflect real-world conditions sufficiently to enable decision-making, while acknowledging that simulations are simplifications.
2.2. Hypothesis test setup
For each case study, the simulated weekly output was compared with the corresponding actual recorded values using one-sample statistical hypothesis testing in GraphPad Prism. The null hypothesis (H0) is that the simulated and actual outputs are not significantly different, which would indicate strong model alignment. The alternative hypothesis (H1) is that the simulated and actual outputs are significantly different. A smaller p-value (< 0.05) would suggest that results are unlikely under the null hypothesis, indicating a weak model alignment. A larger p-value (> 0.05) would mean that the data does not offer strong enough evidence to reject the null hypothesis, so it is typically retained, indicating a strong model alignment. (This point related to the significance of the p-value was addressed in [21].)
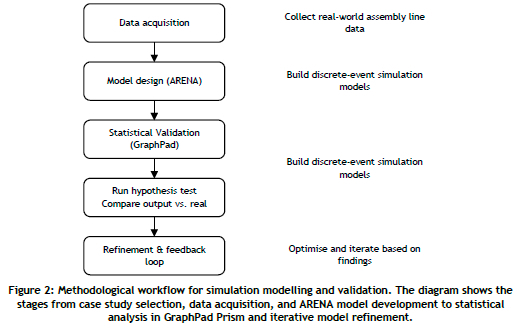
In the present study (as shown in Figure 2), four case studies were considered. The first three represent actual assembly line cases. The fourth shows the process related to implementing product design changes. The targeted case studies were:
• Case Study 1: Direct cable assembly
• Case Study 2: Triple cable with T terminal
• Case Study 3: Sample cable
• Case Study 4: Change management processing
Each one was modelled using actual battery power cable production line data from Cables LE for every station. Modelling and simulation for each production line in the four case studies were performed in the ARENA software base environment. The simulation was based on weekly output for each line, the production week being six days with eight working hours in total. Each line was simulated, with 45 replications representing working calendar production weeks (except for the fourth case, replicated 20 times) to validate that the average simulated weekly output matched the actual. For each case study line, the simulated results for every replication versus the actual output per week were exported into PRISM software, where a test hypothesis was performed to identify the p-value. Then normality and scattered plots were sketched in the software.
This section applies the proposed methodology to four real-world case studies.
3. RESULTS OF THE PROPOSED SIMULATION MODELS
This section applies the proposed methodology to four distinct wiring assembly case studies. Each case reflects varied production settings, allowing for comparative analysis and demonstration of our model's flexibility.
3.1. Case Study 1: Direct cable assembly (as-is model)
Case 1 (Figure 3) models a mid-complexity cable harness assembly process involving two separate terminal crimps, followed by sequential downstream operations. The line features eight entities, eight processes, five quality checkpoints, four rework stations, and eight operators. Production begins with separate terminal crimping for each end of the cable, each handled by a different operator using dedicated bench crimpers. These are followed by tape wrapping, heat shrink application, intermediate testing, and final labelling before packing. Operators rotate between stations, based on cable type and daily output demands, which introduces variability in processing times. The direct cable assembly line is considered.
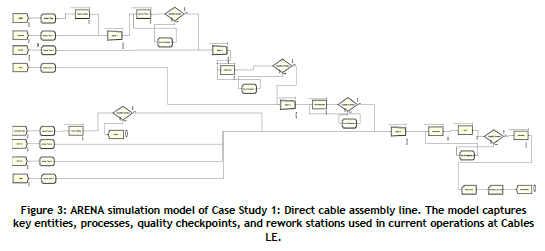
Figure 4 shows that the assembler and packing operator demonstrate a 100% utilisation rate, indicating they are always busy during the simulation period. Moderately used resources are bench press: -66.5%, heat shrink machine: -35.2%, test station: -24.8%, solder machine: -12.4%, and tube cutting machine: -10.9%. As for underused resources: resource 1, resource 2, and resource 3 have use rates below 50%, suggesting that they are not fully leveraged.
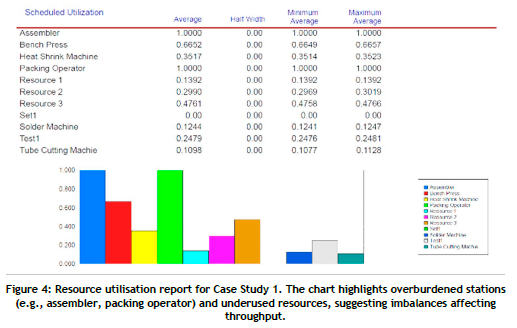
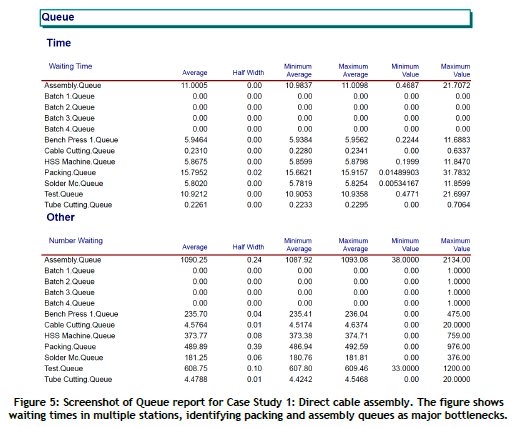
Figure 5 shows that the assembly queue and packing queue have high average waiting times (10.98 and 15.66 minutes respectively). Other queues such as the bench press, the solder machine, and the heat shrink sleeve (HSS) machine have average wait times of around six minutes. Clearly the assembler and packing operator are overworked, operating at 100% capacity, which creates delays in downstream processes. The packing queue has a high number of entities waiting. Prolonged queue times in the assembly (10.98 hours) and test (10.90 hours) stages indicate potential bottlenecks in these production stages.
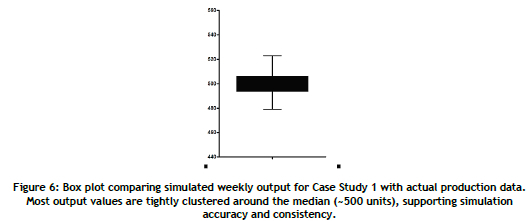
The simulated model passed the test hypothesis with a p-value of 0.259 (> 0.05), which indicates that the simulated weekly output does not differ significantly from the actual recorded values, suggesting a strong model alignment. The median value of the number of pieces per week appears close to 500 (Figure 6) with a range from 480 to 510. There are two outliers out of 45 readings. The data seems consistent, with most values tightly clustered around the median. The presence of outliers shows extreme values that might indicate potential assembly line malfunction.
3.2. Case Study 2: Triple cable with T terminal (as-is model)
Case 2 (Figure 7) models a high-complexity cable harness assembly involving three separate wires joined at a T-terminal station before progressing through shared downstream processes. The line has 18 entities, 18 processes, 12 quality check points, eight rework stations, and 18 operators. The process begins with individual cable preparation; each is routed through dedicated bench press stations, and then they converge at a T-terminal station designed for multi-cable integration. This joining process is labour-intensive and prone to queuing because of its shared resource structure. The operators manage both pre-assembly and post-assembly tasks, with the transitions between taping, heat shrink application, and testing requiring tight coordination.
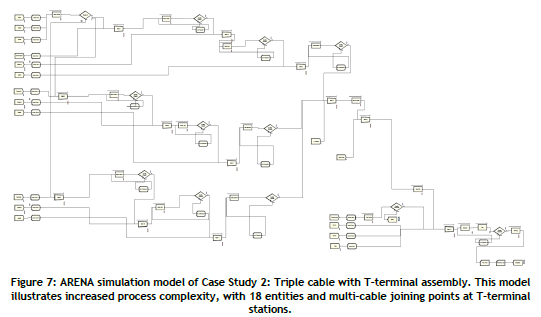
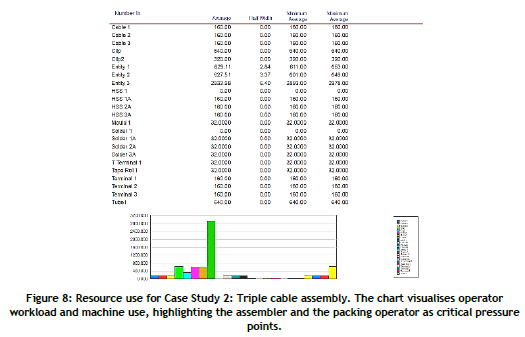
Figure 8 shows the simulated output of the second case study line. The highest work-in-progress (WIP) value is at entity 3 at the start of the assembly process (the cable store area, where semi-finished goods are stored). The maximum waiting time and the greatest number of pending pieces are at the packing area (the end of the assembly process), followed by the bench press processes (the T-terminal station being the highest, as it represents the pre-assembly of three separate cables at a single station). The system processed 332 entities per week during the replication period. The average total flow time was 13.38 minutes, with a reported maximum of 25.99 minutes per product. Entity 3 experienced the longest average wait time, highlighting a significant delay.
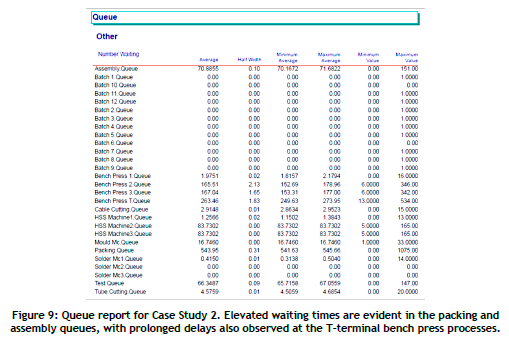
The packing queue has the highest waiting time of all the queues (Figure 9). The assembler and packing operator are the primary bottlenecks. The packing queue has many entities waiting, indicating that packing operations are overloaded. The assembly queue and the test queue also show considerable waiting times (1.39 hours and 1.37 hours respectively). Resources such as bench presses, the heat shrink machine, and the solder machine have long waiting times relative to their capacity.
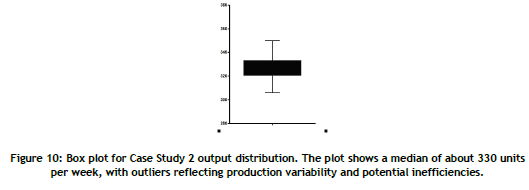
The simulated model passed the test hypothesis with a p-value of 0.1884 (> 0.05) which indicates that the simulated weekly output does not differ significantly from the actual recorded values, indicating a strong model alignment. The median value of the number of products per week is around 330, with a range from 320 to 335 (Figure 10). This shows that the middle 50% of the data lies in this range. The whiskers extend from around 300 to 350. These are two extreme values that deviate significantly from the rest of the data, which concurs with the reported bottlenecks in this production line.
In this model (Figure 11), a sample phase cable assembly line is considered. This model reflects a simplified assembly line, used primarily for low-volume or prototype cable production. The system has four entities, four core processing stations, three rework stations, and four operators. The workflow begins with terminal crimping and soldering, followed by heat shrink sleeve application and final quality inspection. Given the simplicity of the process, most stations operate independently with minimal interaction or sequencing constraints. However, initial observations revealed a mismatch between resource availability and actual workload, with the operators often idle and the equipment underused.
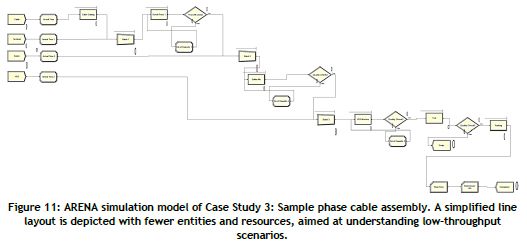
Figure 12 shows the simulated output of the sample phase cable line. It is noticed that the highest WIP value is at entity 3 at the HSS process. The maximum waiting times are at the terminal bench press and the solder machine station respectively. The maximum number of waiting pieces is before the packing process. The packing operator has the highest use (46.1%), followed by the bench press (6.9%) and resource 3 (5.1%). Most resources, including the assembler, heat shrink machine, solder machine, and test station, have use rates each below 4%. All other resources are significantly underused, implying an oversupply of resources and/or an inefficient workflow.
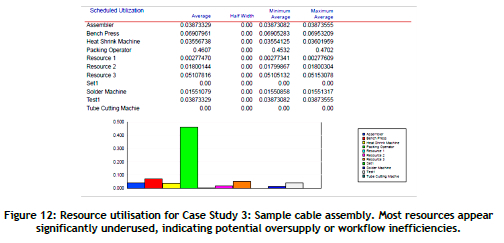
Figure 13 shows that the queue times for all resources and processes of the sample phase cable assembly line are minimal, indicating that bottlenecks are not severe at individual stages.
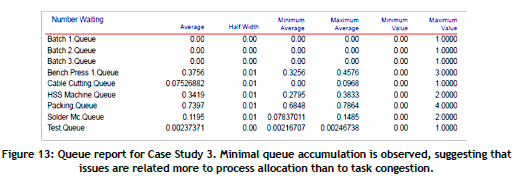
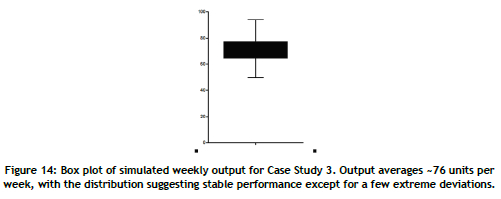
Figure 14 is box plot for the sample phase cable assembly line shows an average output of about 76 pieces per week. The simulated model passed the test hypothesis with a p-value of 0.2408 (> 0.05). The median is around 70, representing the central value of the data set. The interquartile range (IQR) spans from about 65 to 78. The whiskers extend from 50 to 90. These outliers show extreme deviations in the data. The data distribution is balanced with no significant skewness, showing moderate variability, with the IQR relatively compact but not overly narrow. The outliers could represent a fundamental nonconformity in the production line.
3.4. Case Study 4: Change management processing (as-is model)
Case Study 4 (Figure 15) departs from physical cable production and instead simulates the processing of engineering change requests (ECRs) in departmental workflows. The simulation includes a single ECR entity flowing through nine organisational units, including production engineering, design review, logistics, and quality assurance. This administrative process is time-sensitive, with each department responsible for analysing, approving, or implementing aspects of the proposed change. The production engineer serves as the initial gatekeeper, being responsible for feasibility studies and task delegation - a role found to be severely overburdened in practice.
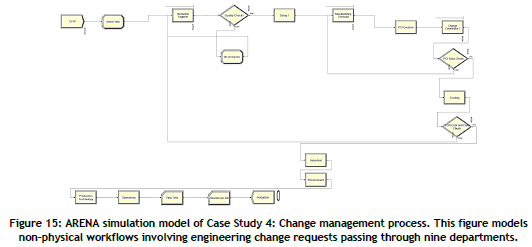
Figure 16 shows the simulated output of the fourth case study line. WIP is not considered, as no physical components are involved. The maximum queue was recorded at the production engineering department, as it is the main area leading to the change and the first to study the related documents and their applicability, followed by the technical departments. The production engineer is fully used (100% use). Manufacturing technicians are highly used (78.64%). The change coordinator shows moderate use (62.62%).
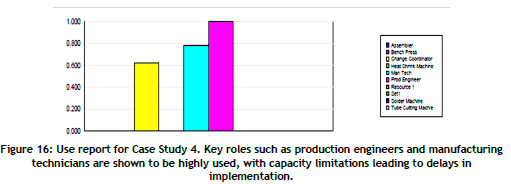
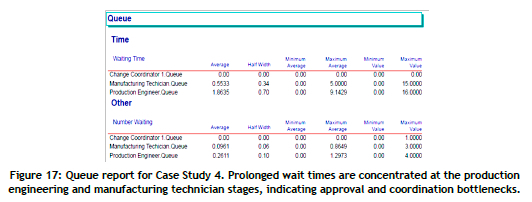
Figure 17 shows that wait time is minimal in most queues, except for the manufacturing technician, with a wait time of five hours; the production engineer shows the maximum waiting time of 9.14 hours. At 100% use, the role of the production engineer is a clear bottleneck, delaying downstream processes, followed by the manufacturing technician with significant queue times.
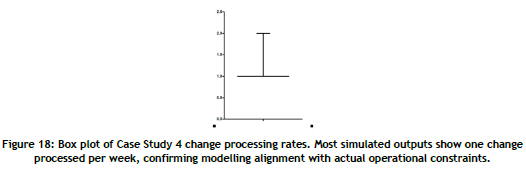
It appears that, in most of the studied weeks, only a single change is processed each week (Figure 18). The simulated model passed the test hypothesis with a p-value of 0.0828 (> 0.05).
While this study does not directly implement operational improvements, the validated simulation models offer insight into the structure and dynamics of automotive wiring assembly lines. Bottlenecks, underused resources, and congestion points have been identified through a quantitative analysis of queuing behaviour, resource use, and output distribution. These findings lay the foundation for a second phase of research, in which KNIME analytics and machine learning techniques will be integrated to explore predictive modelling, workflow reallocation, and dynamic scheduling. The current results serve as a diagnostic baseline, against which the impact of future interventions will be assessed.
The discussion that follows synthesises insights from the simulations and statistical validation.
4. DISCUSSION
This analysis summarises the outcomes from the simulations and the statistical testing, and offers insights into throughput, resource efficiency, and model robustness. The implications for production planning and future model extensions are discussed.
Optimisation strategies in manufacturing - such as lean scheduling heuristics and rule-based resource planning - often rely on static assumptions and limited real-time feedback. In contrast, the validated discrete-event simulation framework presented here enables a more flexible and data-rich representation of assembly processes. Although this paper does not execute improvements or benchmark alternative methods, the framework lays the groundwork for comparative evaluation in upcoming research. By coupling the present simulation logic with machine-learning tools such as KNIME, future studies will target intelligent automation, adaptive scheduling, and process improvement in diverse wiring harness configurations. These directions align with emerging theoretical models in smart manufacturing and simulation-based analytics, suggesting a broader role for hybrid digital tools in industrial engineering practice.
In the first case study, direct cable assembly, the simulated model highlighted potential malfunctions in the assembly and packing stations. In Case Study 2, triple cable with T terminal, the simulation modelling identified a prominent delay (1.39 hours per week) in the cable store area where semi-finished goods are stored at the start of the assembly process. As for Case Study 3, the sample cable, the simulated model showed an oversupply of resources and/or an inefficient workflow. Most resources, including the assembler, the heat shrink machine, the solder machine, and the test station, have use rates below 4%. In Case Study 4, change management processing, the simulation declared that in most of the considered weeks, the capacity was sufficient to process only a single change per week. Nevertheless, in some weeks, two changes could be implemented. This was a result of delaying downstream processes following the production engineering role.
The simulation results have wider implications for production line management and continuous improvement in manufacturing. Identifying bottlenecks through modelling enables targeted interventions - such as reallocating labour, rescheduling stations, and redesigning layout configurations. Moreover, the statistical validation of simulated outputs establishes confidence in predictive modelling as a reliable support tool. By confirming consistency in four distinct case studies, this methodology demonstrates scalability to other wiring systems or even to parallel assembly processes in different industries. Simulation modelling, when validated with robust statistical tools, bridges the gap between theory and practice, offering operational transparency that can inform strategic decisions.
5. CONCLUSION
This paper demonstrates how simulation modelling, paired with data analytics, could enhance the study of wiring assembly line performance. The findings support data-driven decision-making and provide a foundation for further industrial research and development that will follow in the near future with the next research work.
A comprehensive simulation analysis of power cable harness line was conducted, focusing on different processes, material flow, and component assembly. Bottleneck stations and inefficiencies were identified. Therefore, the prospects for manufacturing optimisation ought to be addressed. This work could be the basis for applying several improvements related to manufacturing process adjustments, using tools such as computational programming, data-driven learning, and artificial intelligence algorithms.
This study developed and validated a simulation methodology for automotive wiring assembly lines using discrete-event modelling and statistical testing. Key inefficiencies were identified, providing a pathway for improved productivity. Future work will explore the integration of machine learning into simulation environments to support predictive maintenance, dynamic workforce scheduling, and adaptive process control. The approach may also be extended to multi-product or hybrid manufacturing lines, using real-time data feedback via digital twin architectures. These directions underscore the potential of simulation modelling not only as an analytical tool, but also as a strategic platform for the evolution of smart manufacturing.
DECLARATION
All the authors declare that there is no conflict of interest.
REFERENCES
[1] Ahmad, N., Mey, T.W., & Nee, T.K. (2019). Analysing customers' waiting time using discrete-event simulation: A case study in a university printing shop. Journal of Science and Mathematics Letters, 7, 34-43. [ Links ]
[2] Altiok, T., & Melamed, B. (2010). Simulation modeling and analysis with Arena. Amsterdam: Elsevier. [ Links ]
[3] Bongomin, O. (2020). Design and scheduling of garment assembly line using simulation-based optimization: A case study at NYTIL, Jinja, Uganda. Master's thesis, Moi University, Eldoret, Kenya. [ Links ]
[4] Gong, L., Zou, B., & Kan, Z. (2019). Modeling and optimization for automobile mixed assembly line in Industry 4.0. Journal of Control Science and Engineering, 2019(1), 3105267. [ Links ]
[5] Harish, D., Gowtham, T., Arunachalam, A., Narassima, M., Lamy, D., & Thenarasu, M. (2024). Productivity improvement by application of simulation and lean approaches in a multimodel assembly line. Proceedings of the Institution of Mechanical Engineers, Part B: Journal of Engineering Manufacture, 238(6-7), 1084-1094. [ Links ]
[6] Hossain, A., & Muneer, K.I. (2022). Assembly line balancing and sensitivity analysis of a single-model stochastic sewing line using Arena simulation modelling. Journal of Engineering Sciences, 41(3), 1045-1053. [ Links ]
[7] Ivatury, V.M.K., & Bonsa, K.B. (2022). Productivity improvement of a garment assembly line using simulation and model-driven decision support system. ARPN Journal of Engineering and Applied Sciences, 17(4), 407-415. [ Links ]
[8] Jamil, M., & Razali, N.M. (2016). Simulation of assembly line balancing in automotive component manufacturing. IOP Conference Series: Materials Science and Engineering, 114, 012049. [ Links ]
[9] Maslazim, N., & Ahmad, S.S.S. (2022). Arena simulation training guideline for assembly line. Research Progress in Mechanical and Manufacturing Engineering, 3(1), 68-73. [ Links ]
[10] Rane, A.B., & Sunnapwar, V.K. (2017). Assembly line performance and modeling. Journal of Industrial Engineering International, 13(3), 347-355. [ Links ]
[11] Rossetti, M.D. (2015). Simulation modeling and Arena. John Wiley & Sons. [ Links ]
[12] Yang, X., Liu, J., Lv, N., & Xia, H. (2019). A review of cable layout design and assembly simulation in virtual environments. Virtual Reality & Intelligent Hardware, 1(6), 543-557. [ Links ]
[13] Cazacu, C.-C., lorga, I., Párpala, R.C., Popa, C.L., & Cotet, C.E. (2024). Optimizing assembly in wiring boxes using API technology for digital twins. Applied Sciences, 14(20), 9483. [ Links ]
[14] Guerrero, R., Serrano-Hernandez, A., Pascual, J., & Faulin, J. (2022). Simulation model for wire harness design in the car production line optimization using the SimPy library. Sustainability, 14(12), 7212. [ Links ]
[15] Popa, C.L., Iorga, I., Cotet, C.E., Ifrim, A.M., Popescu, C.-A., & Dobrescu, T.G. (2024). Optimization of wiring harness logistics flow in the automotive industry. Applied Sciences, 14(22), 10636. [ Links ]
[16] Schindlerová, V., Sajdlerova, I., Bucko, M., & Klepkova, L. (2023). Simulation and optimization of the assembly line production process. MM Science Journal. [ Links ]
[17] Heshmat, M., El-Sharief, M.A., & El-Sebaie, M.G. (2013). Simulation modeling of production lines: A case study of cement production line. Journal of Engineering Sciences, 41(3), 1045-1053. [ Links ]
[18] Heshmat, M., El-Sharief, M., & El-Sebaie, M.(2017). Simulation modelling and analysis of a production line. International Journal of Simulation and Process Modelling, 12(3-4), 369-376. [ Links ]
[19] Ghaleb, A., Heshmat, M.A., El-Sharief, M., & El-Sebaie, M.G. (2019). Using fuzzy logic and discrete event simulation to enhance production lines performance: Case study. 2019 IEEE 6th International Conference on Industrial Engineering and Applications (ICIEA). [ Links ]
[20] Kaoud, E., Heshmat, M.A., El-Sharief, M., & El-Sebaie, M.G. (2020). Scheduling of automated guided vehicles and machines in flexible manufacturing systems: A simulation study. International Journal of Industrial and Systems Engineering, 35(3), 372-387. [ Links ]
[21] Bottani, E., Montanari, R., Volpi, A., & Tebaldi, L. (2023). Statistical process control of assembly lines in manufacturing. Journal of Industrial Information Integration, 32, 100435. [ Links ]
[22] Ding, Y., Zheng, H., Jin, F., Chen, D., & Huang, X. (2024). A Harris Hawks optimization-based cellular automata model for urban growth simulation. Earth Science Informatics, 17(5), 4377-4389. [ Links ]
[23] Nair, N. et al. (2022). Modeling, Simulation and Optimization: Proceedings of CoMSO 2021. Springer Nature Singapore. [ Links ]
[24] Lorenz, N. & Mayer, R. (2023). Approaches for automated wiring harness manufacturing: Function integration with additive manufacturing. Automotive and Engine Technology, 8(4), 227-237. [ Links ]
Submitted by authors 3 Apr 2025
Accepted for publication 6 Oct 2025
Available online 12 Dec 2025
* Corresponding author mheshmat@aun.edu.eg
ORCID® identifiers
M. Adel
https://orcid.org/0009-0004-0636-6414
R.M. El-Zahry
https://orcid.org/0009-0001-0405-2903
M. Heshmat
https://orcid.org/0000-0003-1492-4223
