


Services on Demand
Journal

Article
 English (pdf)
 Article in xml format
 Article references
 Send this article by e-mail
Indicators
Related links
-
 Cited by Google
 -
 Similars in Google
Share

 Permalink
South African Journal of Industrial Engineering
On-line version ISSN 2224-7890
S. Afr. J. Ind. Eng. vol.36 n.2 Pretoria Aug. 2025
https://doi.org/10.7166/36-2-3173
GENERAL ARTICLES
Route Optimisation and Expansion of BisKita Depok Service Corridor using Set Covering Problem Approach
A.B. PrasetyaI; ZulkarnainI,*; E. LaohII
IIndustrial Engineering Department, Faculty of Engineering, Universitas Indonesia, Depok, Indonesia
IISchool of Industrial Engineering and Management, Oklahoma State University, United States
ABSTRACT
Sustainable transportation is crucial for Indonesia to support urban development and to reduce carbon emissions. Depok, a satellite city of Jakarta, faces problems such as traffic congestion and reliance on private vehicles. In July 2024, the government launched the BisKita Depok service to improve public transport accessibility and to reduce emissions, aligning with Sustainable Development Goals 11 and 13. Using the set cover problem model, this study optimises bus routes to expand their coverage and operational efficiency. The findings recommend strategies to establish BisKita Depok as a sustainable transportation model for other cities and provide actionable insights for reducing national carbon emissions.
OPSOMMING
Volhoubare vervoer is noodsaaklik vir Indonesië om stedelike ontwikkeling te ondersteun en koolstofvrystellings te verminder. Depok, 'n satellietstad van Jakarta, staar uitdagings in die gesig soos verkeersopeenhoping en afhanklikheid van privaat voertuie. In Julie 2024 het die plaaslike regering die BisKita Depok-diens bekendgestel om toegang tot openbare vervoer te verbeter en koolstofvrystelling te verminder, in lyn met Volhoubare Qntwikkelingsdoelwitte 11 en 13. Hierdie studie gebruik die versamelingsbedekkingsprobleem model om busroetes te optimeer en dekking uit te brei. Die bevindings stel strategieë voor om BisKita Depok as 'n volhoubare vervoermodel te vestig en koolstofvrystellings te verminder.
1. INTRODUCTION
The Indonesian government has been actively promoting sustainable transportation development as part of its urban development strategy and climate change mitigation efforts. In Jakarta, a single private vehicle produces an average of 968 kg of CO2 annually, with 270 kg attributed to traffic congestion [1]. As a satellite city of Jakarta facing similar problems, such as congestion and dependency on private vehicles, Depok launched the BisKita Depok service in July 2024. This initiative aims to improve public transportation accessibility, reduce air pollution, and align with the United Nations' Sustainable Development Goals (SDGs), particularly SDG 11 and SDG 13 [2]. The programme also supports Indonesia's commitment to reducing carbon emissions by 29% unconditionally by 2030, as stated in its Nationally Determined Contribution (NDC) [3].
Depok is a key satellite city in the Greater Jakarta (Jabodetabek) region, playing a significant role in daily commuter mobility between surrounding areas and Jakarta's urban centre. High commuter activity and dependency on private vehicles [4],[5] underscore the increasing need for an efficient and targeted public transportation system. As a rapidly developing city with the highest commuter-to-population ratio [4], Depok requires a public transit system that is both effective and inclusive [6]. Studies have shown that accessibility, corridor expansion, and user-friendly transportation systems are critical in reducing reliance on private vehicles [7],[8].
The public transportation system in Jabodetabek is highly complex because of the presence of multiple modes such as Transjakarta, Kereta Rel Listrik (KRL) Commuter Line, Mass Rapid Transit (MRT), and Light Rail Transit (LRT) [9]. Transportation planning in this region encompasses several key dimensions: accessibility, ensuring efficient connections between origins and destinations [10],[11]; connectivity, which integrates multiple transportation modes; operational efficiency, focusing on travel duration, frequency, and service coverage [12]; and environmental sustainability, particularly in reducing carbon emissions and air pollution [13]. The integration of these transportation modes, coordinated by the Greater Jakarta Transportation Authority (BPTJ), aims to create a system that is efficient, affordable, and environmentally friendly [9],[14].
The BisKita Depok service is a feeder bus under the management of the Greater Jakarta Transportation Authority (BPTJ). From December 2024 the service operated a single corridor, which remained in its trial phase until early 2025. Optimising and expanding this corridor would be crucial to increasing service reach and efficiency. According to the Ministry of Transportation's research and development, suboptimal transit routes often result in high operational costs and underused services [15]. In this context, the SCP model serves as a valuable tool to identify the minimum required number of stops to maximise service coverage and passenger demand efficiently [16],[17],[18],[19].
This research contributes both practically and theoretically to public transportation optimisation in satellite cities. Practically, it provides recommendations to the Depok City Government for determining optimal and efficient corridor expansion strategies, enabling BisKita Depok to become a vital backbone of urban transit; and theoretically, it enriches the literature on SCP application in urban contexts, particularly in the Jabodetabek area. With this approach, BisKita Depok is expected to serve not only as a viable transportation solution for Depok residents but also as a model for other satellite cities in Indonesia. This study also offers valuable insights for local governments and policymakers in developing environmentally friendly and sustainable public transport systems.
2. LITERATURE REVIEW
2.1. The set cover problem
The set cover problem (SCP) is an optimisation method that is used to determine the smallest combination of facility locations to meet demand efficiently [20]. In public transportation, SCP is applied to identify bus stop locations by considering cost efficiency by minimising the number of stops [21] while keeping service adequacy by ensuring that all demand points are covered [22], and maintaining user accessibility by keeping the distance to bus stops within acceptable limits [23]. SCP is represented as a binary matrix, in which rows indicate demand points and columns represent candidate locations. Exact methods such as linear programming and branch-and-bound are often employed to find optimal solutions. However, heuristic algorithms, including genetic algorithms and simulated annealing, are also commonly used to solve large-scale problems [22],[23]. SCP has been widely applied in facility location and transportation planning, but its classification as an NP-hard problem presents difficulties when needing to solve large datasets efficiently [24].
2.2. Geospatial information system
The geospatial information system (GIS) is a computer-based system used for analysing and visualising spatial data [25]. GIS plays a critical role in transportation planning by integrating geographic data to optimise bus stop locations. Its key capabilities include interactive map visualisation to display demand and facility distribution, distance analysis to calculate the distance between demand points and candidate locations, and overlay analysis that combines spatial data such as population density and road networks [26]. GIS offers significant advantages in the analysis of transportation accessibility, and supports data-driven decision-making to improve system efficiency [27].
3. METHODOLOGY
This research used a structured methodological framework to analyse and optimise public transportation networks with a combination of spatial and computational tools. The study leveraged quantum GIS (QGIS) software for geospatial data processing and visualisation, and the the COIN-OR branch-and-cut (CBC) engine via the OpenSolver interface in Microsoft Excel for optimisation modelling. The subsections that follow outline the tools, data acquisition, and model development used in this study.
3.1. Tools and software
The primary tools used in this study were:
1. Quantum GIS: QGIS, an open-source geospatial information system, was used for spatial data processing, visualisation, and analysis. Its QuickOSM plugin enabled direct interaction with OpenStreetMap (OSM) data, streamlining geoinformation preprocessing relevant to the study.
2. OpenSolver with CBC engine: OpenSolver, a linear programming solver integrated into Microsoft Excel, was used to solve the optimisation problems associated with the SCP. The CBC engine provided the computational power needed to determine optimal bus stop locations and to ensure compliance with defined constraints.
These tools were instrumental in managing the spatial data and implementing the optimisation model, ensuring a robust and efficient analysis framework.
3.2. Data acquisition
The data required for this study was obtained from OSM using the Overpass API, with the QuickOSM plugin in QGIS facilitating the query, extraction, and preprocessing of spatial data. To complement this, additional data was collected through field surveys to map accurately the locations of existing BisKita Depok bus stops. The collected data covered the following categories:
1. Geographical boundaries: This data included polygonal shapes, boundary lines, and centroid points representing Depok's administrative region, providing the spatial context for analysis.
2. Road networks: Roads were classified according to their hierarchy, comprising toll roads, national highways, primary roads, secondary roads, and residential streets. This classification enabled feasible routes and areas for bus stop placement to be identified.
3. Points of interest (POIs): Key facilities such as educational institutions, healthcare centres, public transportation hubs, commercial areas, and other significant locations were mapped to assess demand and coverage requirements.
4. Existing bus stops: The current BisKita Depok bus stops were georeferenced through field surveys, providing a baseline for evaluating the network's existing coverage and for incorporating them into the optimisation model.
This comprehensive dataset served as the foundation for analysing and optimising bus stop locations and corridor designs, ensuring data-driven and practical outcomes.
3.3. Data preparation and preprocessing
The collected data underwent a series of preprocessing steps to ensure consistency and usability in the optimisation model:
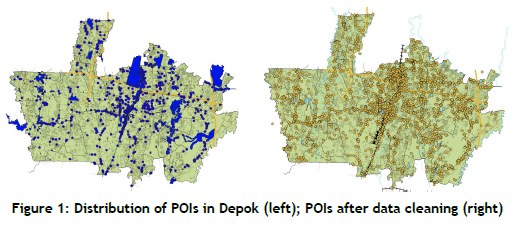
1. Geospatial data cleaning: Removal of irrelevant or duplicate data and centroid extraction of polygon data type (Figure 1) to streamline analysis. The cleaned data appeared to have more points because of the centroid extraction of polygons that were too small to be visible on the left-hand map.
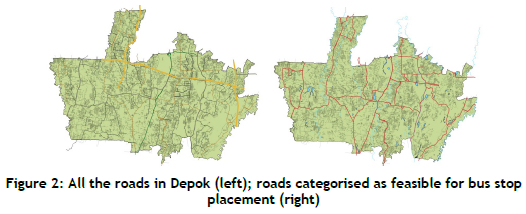
2. Classification of road hierarchies: Roads were categorised to identify those where bus stop placement was feasible were feasible (Figure 2).
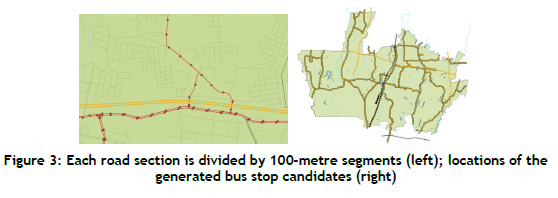
3. Generation of bus stop candidates: To generate candidate bus stops, road sections across Depok City were divided into 100-metre segments. This process was performed using geospatial tools to ensure systematic placement along all feasible road networks, such as primary and secondary roads, as defined by the road hierarchy classifications. The segmentation ensured adequate coverage of urban areas while remaining aligned with existing transportation infrastructure.
Each road section was analysed and divided, producing evenly spaced candidate locations for potential bus stops. This method provided a comprehensive pool of candidate stops, which was later refined through spatial filtering and optimisation.
Figure 3 illustrates this process. Qn the left, a detailed view of the 100-metre segmentation on a specific road section is shown, while on the right, a city-wide map displays the resulting locations of generated bus stop candidates across Depok. These candidate locations formed the basis of subsequent steps in the optimisation process, ensuring coverage of PQIs in the city.
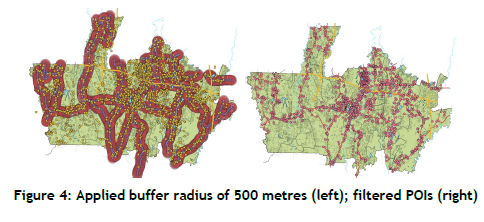
4. Buffering and spatial filtering: A 500-metre buffer was applied around candidate bus stops to identify and filter only accessible PQIs (Figure 4), following national transport policies.
3.4. Model development
The optimisation model was based on the SCP model, which sought to minimise the number of facilities (in this case, bus stops) required to cover all demand points (POIs). Table 1 illustrates the representation of the SCP using an adjacency matrix (Cij), where each row corresponds to candidate bus stops and each column represents POIs, with entries indicating whether a particular bus stop serves a specific POI (1 for covered, 0 otherwise). The model was formulated as an integer linear programming (ILP) problem:
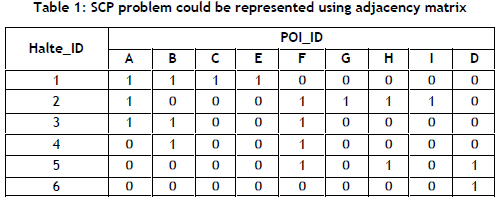
Representation
i = bus stop index
j = POI index
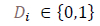
Di = Binary decision variable indicating whether a candidate bus stop i is selected
Cij = Binary value indicating whether candidate stop i covers POI j
Xij = Binary result of the multiplication of Cij and Di, representing whether POI j is effectively covered by stop i
1. Decision variables: Binary variables (Di) representing whether a candidate bus stop i is selected.
2. Objective function: Minimise the total number of selected stops:
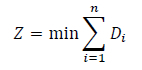
where n is the total number of candidate bus stops.
3. Constraints: Each POI (j) must be covered by at least one stop within a 500-metre radius:
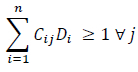
The inclusion of Xij simplifies the interpretation of coverage, where:
ensures that a POI is covered only when a bus stop is both available (Cij = 1) and selected (Di = 1).
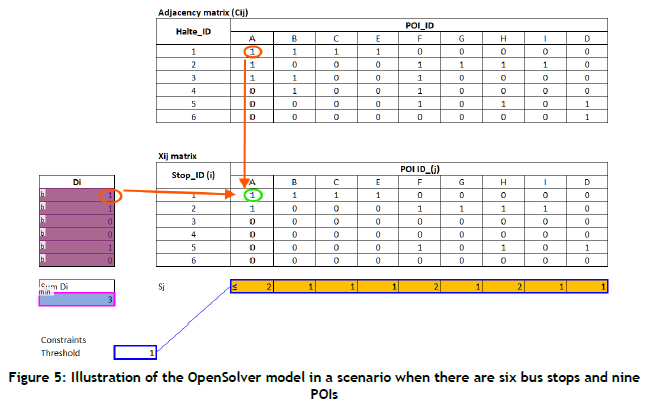
3.5. Model implementation
The model was implemented using OpenSolver in Excel, with the COIN-OR CBC (branch-and-cut) linear solver engine. The adjacency matrix (Cij) and decision variables (Di) were shown as matrices in Excel (Figure 5). Since CBC is an exact optimisation solver based on branch-and-cut algorithms, OpenSolver in this implementation used an exact method to identify the optimal combination of stops that satisfied the coverage constraints.
3.6. Verification and validation
Verification and validation processes were performed to ensure the robustness and accuracy of the optimisation model. Verification focused on confirming that the model formulation and the outputs generated by the solver were consistent with the theoretical framework of the SCP. This included verifying that the mathematical structure and solver implementation accurately represented the problem's requirements and objectives.
Validation, on the other hand, aimed to confirm the practical reliability of the model's results. Specifically, the decision variables and adjacency parameters were checked to ensure that they were binary, as required by the SCP framework. In addition, the coverage constraints were evaluated to confirm that all POIs were adequately served by at least one selected bus stop within the defined radius. Last, the outputs were assessed to verify their compliance with the mathematical requirements of ILP, including adherence to all constraints and the use of positive integer values where applicable.
These processes collectively established the credibility of the model, affirming its suitability to generate actionable recommendations in the context of optimising bus stop locations and coverage.
3.7. Heuristic corridor generation
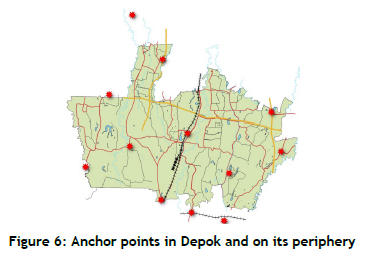
The bus corridors were heuristically designed to balance coverage, efficiency, and accessibility by using spatial data, road hierarchies, and field observations. The process began with the identification of anchor points (Figure 6), where major transit hubs along with high-density POI clusters were designated as endpoints or key nodes for corridor development.
The corridors were categorised into three types to address varied transportation needs. Line corridors were established to connect major urban and regional nodes; circuit corridors were designed as circular routes to enhance local connectivity; and support corridors were introduced to fill service gaps in underserved areas. Using OSM data, route alignments were carefully selected to prioritise primary and secondary roads that would ensure accessibility and effective connectivity.
Stop locations along these corridors were optimised by segmenting feasible roads at 100-metre intervals and applying a 500-metre buffer to maximise POI coverage while avoiding redundancy. This process was followed by iterative refinement, incorporating field data to enhance safety, accessibility, and operational efficiency.
Finally, the generated corridors were validated by evaluating their coverage, connectivity, and operational feasibility. This structured heuristic approach provided a robust framework for analysing and optimising the BisKita Depok bus network, ensuring that the recommendations were both practical and grounded in scientific rigour.
4. RESULTS AND DISCUSSIONS
The optimisation of bus stop locations in Depok City using the SCP model produced significant insights. The results, detailed below, reflect the effectiveness of the proposed methodology and provide a foundation for future urban transportation planning.
4.1. Results of optimisation
Bus stop locations
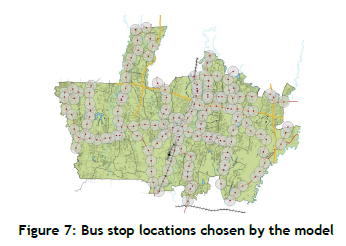
The application of the SCP model led to the identification of 147 optimal bus stop locations from a total of 2242 candidates. These stops were strategically selected to maximise the coverage of POIs while minimising the total number of required stops. The optimised network demonstrated a substantial improvement in service coverage, expanding from 5% to 46.3% of Depok City's area.
The number of POIs being served also increased significantly, from 303 in the existing network to 2864 in the optimised configuration. This enhancement underscored the effectiveness of the SCP model in addressing the spatial distribution of demand throughout the city. The serviceable area also experienced a remarkable expansion, growing from 10 km2 to 92.4 km2. This extended coverage ensured that a larger portion of the urban population had access to public transportation within an acceptable walking distance, thus promoting greater accessibility and inclusivity in the transportation network.
These results highlighted the SCP model's capability to deliver a more efficient and equitable public transit system by addressing the critical gaps in the existing network while accommodating the city's growing transportation needs.
Figure 7 illustrates the spatial distribution of the selected bus stops, showing their alignment with key urban centres and accessible road hierarchies.
4.2. Current and proposed stop analysis
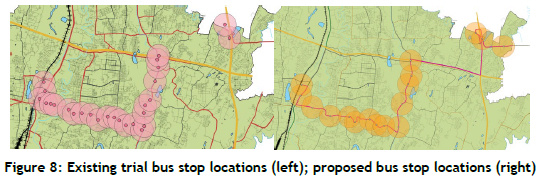
The existing trial BisKita Depok network comprises 26 bus stops, which Is way too many, as It restricts the effectiveness of the public transit system. In contrast, the optimised network reduces the number of stops to 17, strategically redistributing them across the city to improve coverage and operational efficiency. This strategic placement ensures better alignment with POIs and urban demand patterns, providing enhanced access to a larger proportion of the population while maintaining efficiency. Figure 8 compares the existing and the optimised bus stops in the trial corridors, highlighting the improvements achieved through the optimisation process.
4.3. Route recommendations
The optimisation framework also evaluated transit corridors to ensure comprehensive coverage and connectivity. Three types of corridor were proposed:
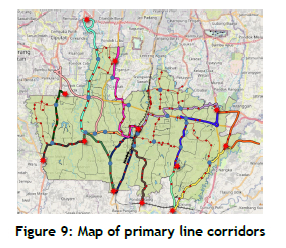
• Line corridor (Figure 9): 13 primary routes connecting strategic nodes.
• Circuit corridor (Figure 10): Five local loop routes designed to enhance coverage without requiring significant route adjustments.
• Support corridor (Figure 11):Three supplementary routes to fill coverage gaps in areas underserved by the primary corridors.
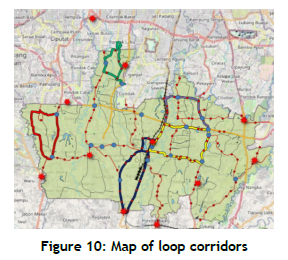
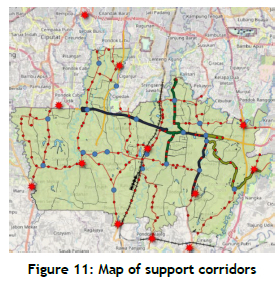
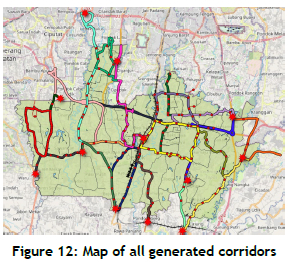
Figure 12 shows the spatial alignment of these proposed corridors, emphasising their connectivity with the selected bus stops.
4.4. Analysis of coverage
POI accessibility. The optimisation process effectively expanded the accessibility of key POIs, including educational institutions, healthcare facilities, commercial areas, and public transit hubs. A 500-metre buffer was applied around the candidate bus stops, in line with Indonesia's public transportation policy (Presidential Regulation No. 55/2018). This buffer ensured that more POIs were within walking distance of bus stops, significantly enhancing the overall accessibility of the public transportation network. The optimisation also maximised the coverage of high-priority zones, such as densely populated residential areas and major commercial hubs, ensuring that these critical areas received the service they required.
Despite these improvements, some coverage gaps remained in certain regions. In the Eastern Region, particularly in Tapos, limited coverage was observed owing to the sparsely distributed road networks, which made it difficult to place bus stops efficiently. Similarly, in the Southwestern Region (Sawangan), the coverage was restricted by land-use patterns, with certain areas being inaccessible because of the lack of suitable roads for bus transit. These gaps highlighted the need for further refinement in route planning and stop placement to ensure comprehensive service in all the areas of Depok.
Corridor efficiency. A central recommendation emerging from the study was to reduce the number of stops on specific trial corridors to enhance overall efficiency. By strategically placing bus stops, the optimised network significantly reduced transit times for users, improving travel time efficiency. Fewer but strategically located stops allowed buses to maintain a smoother flow, avoiding frequent deceleration and acceleration, which would not only shorten travel times but also enhance passenger comfort.
In addition, the optimisation contributed to reduced fuel consumption and improved traffic flow. Minimising unnecessary stops reduces energy usage and lowers operational costs, while also alleviating congestion along busy routes. These improvements highlighted the importance of balancing accessibility and operational efficiency in order to create a more effective and user-friendly public transportation system.
4.5. Problems and limitations
Despite the overall success of the optimisation process, several problems were encountered that affected the implementation and the outcomes:
1. Road network constraints: The feasibility of placing bus stops was significantly influenced by the road hierarchy and accessibility. Certain areas lacked appropriate road infrastructure, such as primary or secondary roads, limiting the number of potential locations for stops.
2. Land-use restrictions: Some regions were excluded from the serviceable area owing to land-use patterns that were unsuitable for transit infrastructure development. For example, large tracts of land used for golf courses or low-density residential areas posed significant barriers to integrating bus stops effectively.
3. Uneven POI distribution: The uneven spatial distribution of POIs throughout Depok City reduced the overall service coverage potential in some regions such as the south-east and the south-west. Areas with no POIs would result in no justification to the placement of bus stops, leaving these zones underserved despite the model's efforts to maximise coverage.
These difficulties underscored the need for further refinements in route planning and stop placement, potentially involving more nuanced methodologies or supplementary data sources to overcome these limitations and to ensure a more comprehensive and equitable transit network.
4.6. Implications for urban transportation planning
The results of this study offer significant insights into and practical implications for improving public transit networks, particularly in urban areas such as Depok City. The application of the SCP model provides a robust, evidence-based framework for optimising bus stop locations. This strategic approach ensures effective coverage of key POIs while maintaining operational efficiency. The enhanced network significantly expands accessibility, especially in high-demand areas such as densely populated residential zones and commercial hubs. Moreover, the reduction in the number of stops along key corridors improves overall transit speed, increases passenger satisfaction, and minimises environmental impacts by lowering fuel consumption and reducing unnecessary delays.
However, further adjustments are necessary to refine the network and to address existing problems. Areas such as Tapos and Sawangan, which remain underserved because of road network limitations and uneven POI distribution, require targeted interventions. Incorporating additional support corridors or adjusting stop placements in these regions could improve accessibility and coverage. To address specific challenges in route design, integrating heuristic methods could provide greater flexibility in optimising routes and accommodating unique regional constraints.
In addition, expanding the scope of field surveys would be essential to validating the feasibility of proposed stops and understanding user needs. This approach would ensure that the optimised network aligned with real-world conditions and passenger expectations, further enhancing the usability and effectiveness of the system.
Overall, these implications and recommendations demonstrate the potential of a data-driven optimisation model to transform urban transit networks, creating a more sustainable, accessible, and user-centric public transportation system in Depok City and beyond.
5. CONCLUSION
This study has successfully provided an optimal solution for determining bus stop locations and improving the existing BisKita corridors in Depok City. By applying the SCP model, 147 optimal bus stops were identified from 2242 candidates, achieving a service coverage of 46.3% of Depok City's area within a 500-metre radius - a significant improvement over the existing coverage of 5%. The optimised network also increased the number of served POIs from 303 to 2864, demonstrating the effectiveness of the proposed methodology.
Despite the significant improvements, some areas, such as Tapos and Sawangan, remain underserved owing to road accessibility constraints and land-use hurdles, such as residential enclaves and golf courses. Nevertheless, the reduction in the number of bus stops along existing corridors has improved operational efficiency, reducing travel times and energy consumption and enhancing passenger comfort.
The study also proposed 21 new routes, consisting of 13 line corridors for connecting key strategic points, five circuit corridors for local loops, and three support corridors for bridging coverage gaps. Field validation complemented the optimisation model, ensuring safer and more accessible networks, such as adding stops while removing unsafe stops. The results of this research are expected to enhance the quality of BisKita services, reduce travel times, and encourage greater adoption of public transportation in Depok City.
FUNDING
This research was funded by the Faculty of Engineering, Univversitas Indonesia, Seed Funding Hibah Professor, Lektor Kepala, dan Lektor Fakultas Teknik 2024/2025, grant number NKB-3442/UN2.F4.D/PPM.00.00/2024.
REFERENCES
[1] TomTom. 2024. Jakarta traffic report: Live congestion and traffic statistics. Retrieved from https://www.tomtom.com/traffic-index [ Links ]
[2] Bappenas. 2021. Transformasi perkotaan dan pembangunan berkelanjutan di Indonesia. Jakarta: Bappenas. [ Links ]
[3] UNFCCC. 2021. Updated nationally determined contribution: Republic of Indonesia 2021. Retrieved from https://unfccc.int/ [ Links ]
[4] Badan Pusat Statistik. 2024. Statistik Komuter Jabodetabek: Hasil Survei Komuter Jabodetabek 2023 (Vol. 3). Badan Pusat Statistik. [ Links ]
[5] Deloitte. 2024. Deloitte city mobility index: Jakarta. Retrieved from https://web.archive.org/web/20241231062754/https://www2.deloitte.com/content/dam/insights/us/articles/4331_Deloitte-City-Mobility-Index/Jakarta_GlobalCityMobility_WEB.pdf [ Links ]
[6] Resdiyansyah, I. 2021. Sustainability assessment of urban transport system in Greater Jakarta. United Nations ESCAP. [ Links ]
[7] Black, J., & Nakanishi, H. 2024. Towards net-zero emissions from urban transport: Ex post policy evaluation in Canberra, the Australian Capital Territory. Sustainability, 16(19), 8656. [ Links ]
[8] Tirachini, A., Hensher, D. A., & Rose, J. M. 2013. Crowding in public transport systems: Effects on users, operation and implications for the estimation of demand. Transportation Research Part A: Policy and Practice, 53, 36-52. [ Links ]
[9] ITDP. 2019. Menata ulang transportasi di Jabodetabek. ITDP Indonesia. [ Links ]
[10] Del Castillo, J., & Benitez, F. G. 2012. A methodology for modeling and identifying user satisfaction in public transport systems. Procedia - Social and Behavioral Sciences, 54, pp. 1104-1114. [ Links ]
[11] Hensher, D. A., Stopher, P., & Bullock, P. 2005. Service quality - Developing a service quality index in the provision of commercial bus contracts. Transportation Research Part A: Policy and Practice, 39(2), pp. 103-122. [ Links ]
[12] Ababio-Donkor, A., Saleh, W., & Fonzone, A. 2020. Understanding transport mode choice for commuting: The role of affect. Transportation Planning and Technology, 43(4), pp. 385-403. [ Links ]
[13] Schofer, R. E., & Levin, B. M. 1967. The urban transportation planning process. Socio-Economic Planning Sciences, 1(2), pp. 185-197. [ Links ]
[14] Murray, A. T., Davis, R., Stimson, R. J., & Ferreira, L. 1998. Public transportation access. Transportation Research Part D: Transport and Environment, 3(5), pp. 319-328. [ Links ]
[15] Kementerian Perhubungan. 2022. Laporan tahunan transportasi perkotaan. Jakarta: Litbang Kemenhub. [ Links ]
[16] Huang, Z., & Liu, X. 2014. A hierarchical approach to optimizing bus stop distribution in large and fast developing cities. ISPRS International Journal of Geo-Information, 3(2), pp. 554-564. [ Links ]
[17] Akgöl, K., Demir, E., & Aydoğdu, I. 2024. Path inference implementing the cluster path covering method. Pamukkale University Journal of Engineering Sciences, 30(1), pp. 53-62. [ Links ]
[18] Puspitasari, A. Y., Budiarto, E. A., & Mudiyono, R. 2021. Location analysis of city public transport shelters in commercial corridors: Case study of Dr. Wahidin Street, Pekalongan City. Journal of Advanced Civil and Environmental Engineering, 4(1), pp. 20-34. [ Links ]
[19] Rafshanjani, A. P. 2021. Optimasi persebaran lokasi halte bus non-BRT di wilayah DKI Jakarta. (Undergraduate thesis). Depok, Jawa Barat, Indonesia: Universitas Indonesia. [ Links ]
[20] Toregas, C. 1971. A coverage approach for public facility location. Omega, 1(3), pp. 565-573. [ Links ]
[21] ReVelle, C., Toregas, C., & Falkson, L. 1976. Applications of the location set-covering problem. Geographical Analysis, 8(1), pp. 65-76. [ Links ]
[22] Gleason, J. M. 1975. A set covering approach to bus stop location. Omega, 3(6), pp. 605-608. [ Links ]
[23] Lan, G., DePuy, G. W., & Whitehouse, G. E. 2007. An effective and simple heuristic for the set covering problem. European Journal of Operational Research, 176(2), pp. 1387-1403. [ Links ]
[24] Garey, M. R., & Johnson, D. S. 1979. Computers and intractability: A guide to the theory of NP-completeness. San Francisco, CA: Freeman. [ Links ]
[25] Miller, H. J., & Shaw, S. L. 2015. Geographic information systems for transportation in the 21st century. Geography Compass, 9(4), pp. 180-189. [ Links ]
[26] Hull, A., Silva, C., & Bertolini, L. (eds). 2012. COST Action TU1002: Accessibility instruments for planning practice in Europe. Brussels: COST Office. [ Links ]
[27] Rosetti, S., Tiboni, M., Vetturi, D., Zazzi, M., & Caselli, B. 2020. Measuring pedestrian accessibility to public transport in urban areas: A GIS-based discretisation approach. European Transport / Transporti Europei, 76(2) pp. 1-12. [ Links ]
Submitted by authors 9 Jan 2025
Accepted for publication 24 Jun 2025
Available online 29 Aug 2025
* Corresponding author: zulkarnain@ie.ui.ac.id
ORCID® identifiers
A.B. Prasetya
https://orcid.org/0009-0002-5640-5042
Zulkarnain
https://orcid.org/0000-0001-7642-5150
E. Laoh
https://orcid.org/0000-0002-6183-1962
