




Services on Demand
Journal

Article
 English (pdf)
 Article in xml format
 Article references

 Automatic translation
 Send this article by e-mail
Indicators
Related links
-
 Cited by Google
-
 Similars in Google
Share

 Permalink

SAIEE Africa Research Journal
On-line version ISSN 1991-1696Print version ISSN 0038-2221
SAIEE ARJ vol.117 n.2 Observatory, Johannesburg Jun. 2026
A Multi-Faceted Approach to Electricity Theft Detection: Using Community Engagement, Audit Analytics, and Machine Learning Algorithms
C. A. SibiyaI; K. A. OgudoII; E. AladesanmiIII
IDepartment of Electrical and Electronic Engineering Technology, University of Johannesburg, Johannesburg, 2006, South Africa (e-mail: cyncolsibiya@gmail.com). Member, IEEE
IIDepartment of Electrical and Electronic Engineering Technology, University of Johannesburg, Johannesburg, 2006, South Africa (e-mail: kingsleyo@uj.ac.za).SMIEEE
IIIDepartment of Electrical and Electronic Engineering Technology, University of Johannesburg, Johannesburg, South Africa (e-mail: ereolaa@yahoo.co.uk). Member, IEEE
ABSTRACT
Electricity theft represents a significant source of non-technical losses (NTLs) in power distribution networks, leading to substantial financial deficits, grid instability, and safety concerns. This study introduces a machine learning-based methodology to detect and predict electricity theft by examining residential consumption patterns in Pietermaritzburg Municipality, South Africa. Utilising meter data from approximately 42,000 customers, of whom 21,935 made at least one electricity purchase over a five-year period (2019-2024), the research evaluates five machine learning techniques: decision trees, logistic regression, K-nearest neighbours, XGBoost, and random forests. The approach integrates survey data, audit outcomes, and audit evaluations for a holistic analysis. Results indicate that Random Forest outperforms other models, achieving the highest scores across accuracy (0.8), precision (0.75), recall (0.9), and F1-score (0.82) for detecting tampering. Survey findings reveal that 85.0% of respondents link theft to financial hardship, underscoring socio-economic influences. This study provides utilities with practical insights to reduce NTLs, enhance grid reliability, and foster sustainable energy management.
Index Terms: Electricity theft, non-technical losses, machine learning, Decision Tree, Logistic Regression, K-Nearest Neighbours, XGBoost, Random Forest, advanced metering infrastructure, power distribution, affordable and clean energy, industry, innovation and infrastructure, reduced inequalities, sustainable cities and communities.
I. INTRODUCTION
LECTRICITY theft presents a formidable challenge in power distribution networks across the globe, leading to significant financial losses for utility companies and undermining service reliability for consumers. The urgency to devise innovative solutions has never been more critical, especially in developing nations, where "electricity theft accounts for 10.0 - 40.0% of the entire generation capacity in many developing nations"1. with South Africa's state-owned utilities and municipalities reportedly losing approximately ZAR7.5 billion annually 2. According to Eskom, this issue is not unique to South Africa, as electricity theft accounts for around 1.0% of global electricity consumption 3.
Internationally, the scale of losses is considerable: India reportedly loses up to 33.0% of its generated electricity, the United States incurs an estimated US$6.0 billion in annual losses, and the United Kingdom faces losses of approximately £299.0 million each year due to electricity and gas theft 4. These staggering statistics underscore the depth of the crisis, necessitating a multi-faceted approach to combat the issue. This paper proposes a comprehensive strategy that integrates community engagement, audit analytics, and machine learning technologies, aiming to mitigate the pervasive problem of electricity theft. Socio-economic challenges often intersect with electricity theft in communities. For instance, in regions with high poverty rates, individuals may resort to theft as a means of securing access to an essential service when they cannot afford legitimate connections 4. A case study from South Africa illustrates this point; in informal settlements, where a sizeable portion of the population lives without legal electricity, unauthorised connections are frequently adopted. This not only leads to financial losses for utility companies but also poses safety risks, such as electrocution and fire hazards. Electricity theft encompasses a range of illicit activities, including unauthorised connections, meter tampering and bypassing, illegal vending of prepaid electricity, theft of cables and infrastructure, and persistent non-payment 5.
The implications of these socio-economic factors are profound 6. Utilities operating in such environments must grapple with the dual challenges of maintaining profitability while striving to provide equitable access to electricity. This often results in a vicious cycle where the lack of investment in infrastructure exacerbates the problem of theft, leading to further financial strain. Expert opinions suggest that utility companies should not only focus on punitive measures against theft but also invest in community development initiatives that can alleviate the underlying socio-economic conditions.
Unlike prior studies (7 on rule-based machine learning and 11 on deep learning meta-learners) that emphasise technical detection alone, this work innovates by integrating ML with community surveys (revealing socio-economic motives) and on-site audits (geographical tampering insights), addressing gaps in holistic, context-specific approaches for developing regions like South Africa.
Despite significant progress in electricity theft detection research, much of the existing literature primarily concentrates on improving algorithmic performance using electricity consumption data, with limited integration of operational and socio-economic perspectives. Consequently, a gap remains in developing holistic frameworks that combine technical detection with contextual understanding of theft behaviour, particularly within developing-country municipalities where affordability challenges, informal settlements, and infrastructure constraints strongly influence electricity usage patterns.
This study addresses this gap by proposing a multi-faceted approach that integrates machine learning-based anomaly detection with community survey insights and on-site audit analytics. The originality of the proposed framework lies in its ability to link predictive modelling with real-world operational evidence, enabling not only accurate identification of potential tampering but also improved interpretation of underlying drivers of electricity theft. The approach provides practical benefits by supporting targeted inspections, enhancing utility decision-making, and enabling context-aware mitigation strategies tailored to South African municipal environments and similar power distribution systems. The paper is structured as follows: Section II reviews related work; Section III outlines the methodology; Section IV presents electricity theft predictions analysis; Section V discusses survey analysis; Section VI outlines the audit findings with analysis; and Section VII concludes with insights, implications, and recommendations for future research.
II. RELATED WORKS
Electricity theft poses a significant challenge to power utilities, contributing to non-technical losses (NTLs) that impact economic stability and grid efficiency. Recent advancements in machine learning (ML) and deep learning (DL) have revolutionised electricity theft detection (ETD) by leveraging smart meter data to identify fraudulent consumption patterns. This literature review synthesises key findings from recent studies, focusing on ML and DL approaches, privacy-preserving techniques, and challenges such as class imbalance and adversarial vulnerabilities.
Several studies have proposed ML techniques to detect electricity theft by analysing consumption patterns. The authors in 7, introduced a rule-based combined ML (rML) approach that integrates load profiles with expert-derived rules, achieving a recall rate of 93.0% on real-world data. Similarly, 8 developed a stacked ML and DL framework to address challenges like missing values and class imbalance, improving detection accuracy in smart grids. Ensemble methods have also shown promise. The authors in 9 proposed Ensemble NTL Detect, which uses a soft voting ensemble classifier with enhanced imputation algorithms to reduce NTLs effectively (arXiv: Learning). Additionally, authors in 10 employed a Bagged CHAID Decision Tree algorithm, achieving 86.35% accuracy and an Area Under the Curve (AUC) of 0.927 by analysing monthly consumption data.
Deep learning models have demonstrated superior performance in ETD due to their ability to capture complex patterns in high-dimensional data. 11 Shehzad et al. (2023) proposed a DL-based meta-learner model that outperforms traditional classifiers in distinguishing legitimate and fraudulent usage. Similarly, 12 Ibrahim et al. (2021) used a convolutional neural network (CNN) with feature reduction via the blue monkey algorithm, achieving 92.0% accuracy. 13 Hasan et al. (2019) combined CNN and long short-term memory (LSTM) to address class imbalance through synthetic data generation, improving detection accuracy. Furthermore, 14 proposed a heterogeneous ensemble learning model with LSTM, K-Nearest Neighbours (KNN), and Support Vector Machine (SVM), achieving an AUC of 0.98675.
Deep reinforcement learning (DRL) has emerged as a dynamic approach to ETD. However, ML-based ETD models are vulnerable to adversarial attacks. Reference 15 demonstrated that attackers can manipulate consumption data to evade detection, significantly reducing model accuracy. These findings underscore the need for robust models resilient to adversarial manipulations.
Class imbalance and data quality are persistent challenges in ETD. The authors in 16 addressed these issues using a deep neural network, achieving 97.0% AUC and 91.8% accuracy through advanced feature analysis. Reference 17 proposed a two-stage method using distributed random forest, achieving 98.0% accuracy by detecting sudden consumption jumps. The authors in 18 emphasised the impact of sampling frequency, noting that lower frequencies degrade detection performance.
Hybrid models combining ML and DL have shown enhanced performance. Reference 19 presented a hybrid model using AlexNet for feature extraction and AdaBoost for classification, addressing class imbalance and high dimensionality. Reference 20 also created a stacking ensemble model based on boosting classifiers (MLBCSM), which used several boosting methods to make the model more accurate.
In 21, the study examines the impact of socio-economic and governance variables on power theft prevalence in 28 Indian states from 2005 to 2009. Results show that fewer thefts are linked to lower corruption, higher tax-to-Gross Domestic Product (GDP) ratios, private capacity, poverty, literacy, and income. The authors in 22 conducted a study to explore the impact of socio-economic factors on electricity theft among customers of two distribution companies in Haryana. Key factors identified include inefficient work styles, corrupt employees, less-educated individuals, economically disadvantaged groups, government interference, and lack of awareness.
The study suggests that distribution companies (DISCOMs) should focus on fair treatment for all condemned individuals, regardless of political affiliations or influential ties. Additional actions, informed by customer feedback, include publicly disclosing the names of defaulters, imposing fines, raising awareness about electricity theft consequences, and reducing electricity rates. Authors in 23 examine socio-economic and institutional factors contributing to the issue using path analysis and Statistical Package for the Social Sciences (SPSS). The analysis focuses on consumer perceptions of the unlawful use of electricity in the service region of Islamabad Electric Supply Company, Pakistan. Factors such as corruption, power outages, and age negatively influence attitudes towards theft. However, factors like tariff rates, consumption patterns, detection probabilities, legal frameworks, education, and the conduct of utility officials have insignificant effect on consumer motivation to engage in theft.
In 24, authors investigate the factors contributing to electricity theft in Lubumbashi, DR Congo. Survey data from 1,211 households was collected from multiple municipalities. Key factors identified include inadequate law enforcement, corruption, cost of electricity, service quality, and educational issues. The study suggests that implementing policies that incorporate these factors is crucial to address the issue and ensure the revenue generation of utilities in developing nations. The findings highlight the need for effective strategies to combat electricity theft.
Electricity losses are a challenge globally that result in higher electricity rates and contribute to carbon dioxide emissions. Minimising these losses can lead to cost savings, an improved environment, and reduced infrastructure requirements 25. The study in 25 investigates these factors globally using a database of 91 countries and a decade of data from 2005 to 2014. A panel data model was used to identify the determinants of power losses. The results showed significant positive correlations between unemployment and crime at the one percent level, while urbanisation and education showed significant negative correlations. The study presents policy implications based on the evidence linking electricity losses to factors such as low education levels, high unemployment rates, high homicide rates, and reduced urbanisation.
Furthermore, authors in 26 explore socio-economic factors influencing illegal electricity consumption, using econometric techniques to estimate an energy theft equation. The analysis, based on data from 2002 to 2010, suggests that the model could help new firms reduce electricity theft in developing countries like Turkey. Key determinants include temperature index, education, income, social capital, rural population rate, and agricultural production rate. Authors in 27 examined electricity theft utilising a three-tiered principal-agent-client framework. The elements that sustain corruption and theft include their advantageous aspects of reducing electricity costs for consumers and creating illicit private incomes for those susceptible to corruption. The findings indicate that a person engages in electricity theft only when the perceived financial benefits outweigh the potential costs, such as fines incurred upon detection or the risk of job termination.
Moreover, the findings indicate that implementing efficiency wages, enhancing deterrence, and encouraging active consumer participation in reporting crimes can effectively address corruption and pilferage within the electricity sector.
The literature reviewed identifies socio-economic, governance, and institutional factors such as corruption, low education, economic disadvantage, and weak law enforcement as key drivers of electricity theft across regions like India, Pakistan, DR Congo, Turkey, and globally, while also highlighting the efficacy of machine learning (ML) and deep learning (DL) techniques in electricity theft detection (ETD). Advancements in hybrid models, ensemble learning, and privacy-preserving methods show promise, yet challenges persist, including class imbalance, data quality, and adversarial vulnerabilities in ETD systems, alongside limited cross-regional comparisons, inconsistent methodologies, and underexplored factors like technological interventions (smart meters) or psychological influences on consumer behaviour. Most studies rely on data from 2002-2014, overlooking recent advancements in grid technology and governance. Furthermore, while policy recommendations like fines, public disclosure, and efficiency wages are proposed, their practical effectiveness remains unevaluated, particularly in developing nations. Future research should focus on developing robust, scalable, and privacy-preserving ETD frameworks that integrate socio-economic insights with advanced ML/DL techniques to enhance detection accuracy, resilience against emerging threats in smart grids, and effective policy implementation across diverse contexts.
III. METHODOLOGY
This study used a multi-faceted approach to detect theft of electricity, integrating community engagement, audit analytics, and machine learning techniques. The methodology combines quantitative and qualitative research methods to assess community awareness, analyse consumption patterns, and detect non-technical losses (NTL) caused by electricity theft. The details of the methodology are outlined in the following sections; the ML model and survey files are accessible 28.
A. Data collections
A dataset was obtained from the Pietermaritzburg (Msunduzi Municipality), comprising energy purchasing records of approximately 21,935 prepaid subscribers over a continuous five-year period, with the most recent data from February 2024. The municipality has over 42,000 prepaid customers; however, approximately 50.0% of the users had not purchased kilowatt-hours (kWh) in the past five years and were excluded from the dataset. This high level of inactivity indicates deeper structural challenges for the utility, including revenue instability, potential illegal connections, or meter bypassing. The dataset includes attributes such as consumption timing, geographical location, and usage patterns, which serve as the foundation for subsequent analysis.
B. Data Pre-processing
The dataset underwent a structured preprocessing pipeline to ensure data consistency, reproducibility, and suitability for machine learning analysis. All preprocessing steps were implemented using Python-based data analysis libraries. The workflow is summarised as follows:
1) Handling missing values:
The dataset was first examined for missing, inconsistent, or invalid records using predefined data-quality checks. In prepaid electricity systems, energy consumption is only recorded when a customer purchases electricity tokens. Therefore, the absence of a transaction within a billing period does not represent missing data but rather a valid observation corresponding to 0 kWh consumption. Such cases were retained and encoded as zero consumption values. Missing values primarily occurred in administrative fields, including incomplete customer identifiers, corrupted timestamps, or invalid geographical tags. Records with structurally incomplete identifiers or unreadable timestamps (representing less than 2% of the total dataset) were removed to prevent incorrect temporal aggregation. No statistical imputation techniques (mean, median, or interpolation) were applied to consumption variables to avoid introducing artificial behavioural patterns into customer usage profiles.
2) Feature Engineering:
Raw transactional records were transformed into analytical features suitable for modelling. Time-based attributes such as monthly consumption totals, purchase frequency, average purchase interval, and consumption variability were derived. Additional anomaly-related indicators, including sudden drops or spikes in consumption relative to historical averages, were computed to capture potential tampering behaviour.
3) Feature Selection:
Relevant predictors were selected based on domain knowledge and correlation analysis. Selected features included consumption timing, geographical location, historical usage trends, and derived anomaly indicators. Highly redundant or non-informative attributes were removed to reduce model complexity and improve generalisation.
4) Data Visualisation and Analysis:
Descriptive statistics and graphical visualisations were performed to understand consumption distributions and detect irregular patterns prior to modelling. Visual inspection supported the identification of abnormal consumption reductions and seasonal usage variations.
5) Model Development and Evaluation Preparation:
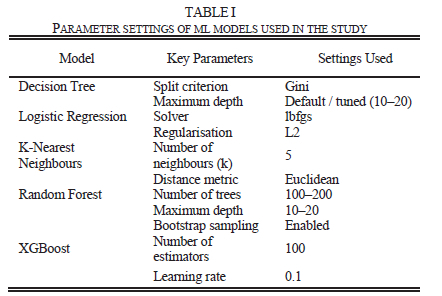
Following preprocessing, the cleaned dataset was partitioned into training and testing subsets using an 80/20 split. Five ML models were selected: Decision Tree (for interpretability), Logistic Regression (baseline linear classifier), K-Nearest Neighbours (KNN, for local pattern detection in consumption clusters), Random Forest (ensemble for handling imbalance and feature interactions), and XGBoost. Table I summarises the key parameter settings and configuration details used for each machine learning model to ensure reproducibility of the experimental results.
Detailed theoretical descriptions and implementation principles of these classifiers have been previously presented in 29, 30; therefore, this study emphasises their practical application and comparative performance in a real-world electricity theft detection scenario rather than reiterating established algorithmic formulations. Model robustness was ensured through 5-fold cross-validation and trained. Hyperparameter optimisation was performed using grid search. Given the class imbalance observed in audit-labelled tampering cases model tuning prioritised recall to minimise undetected theft cases while maintaining acceptable precision.
6) Standardisation and Anomaly Detection:
Numerical features were standardised to ensure comparable feature scales across models sensitive to magnitude differences. Pattern recognition and statistical anomaly detection techniques were applied to highlight deviations from expected consumption ranges, forming additional inputs to the classification models.
C. Survey Methodology
1) Research design:
A mixed-methods approach was employed, combining quantitative surveys to assess community awareness and attitudes toward electricity theft with qualitative meter audits to identify theft instances. This design enabled a comprehensive understanding of both community perceptions and actual theft occurrences. The link to the survey questions is made available 31.
2) Study area:
The study was conducted in urban and rural communities within the Pietermaritzburg Municipality to compare electricity theft prevalence and community awareness across diverse socio-economic environments.
3) Sample Population and Sampling Technique:
The survey data (n=65) was collected via structured questionnaires targeting demographics, awareness, and motives, with responses coded categorically. A meter audit sample of 4,000 households was randomly chosen to cover different customers within the municipality area of supply, out of 42,982 registered customers.
4) Data collection methods:
Survey Instrument (Questionnaire): A structured questionnaire was developed with three sections: Demographic Information, Knowledge of Electricity Theft, and Attitudes and Practices. The questionnaire was administered via Google Forms to utility employees, engineers, residents, and other stakeholders. Meter Audit: Physical inspections of electricity meters were conducted by trained utility technicians.
5) Data Analysis:
Survey Data Analysis: Quantitative survey data collected via Google Forms were analysed using descriptive statistics, including frequencies and percentages, to summarise demographic characteristics, awareness levels, and attitudes toward electricity theft. Meter Audit Data Analysis: Audit data was compiled into a report detailing confirmed theft cases, tampering methods, and their correlation with survey responses. Cross-analysis was performed to determine whether households with low awareness were more likely to have tampered meters.
This methodology integrated community engagement, audit analytics, and machine learning algorithms to provide a robust framework for detecting electricity theft and possibly contribute to reduced NTL and improved utility management.
IV. RESULTS ANALYSIS AND DISCUSSION
A. Electricity Theft Predictions Analysis and Discussion
1) Consumer Electricity consumption patterns:
The graph in Fig. 1 illustrates the average kilowatt-hour (kWh) consumption trends over a period from mid-2019 to early 2024, categorised by three different power limits: 20.0 A, 40.0 A, and 60.0 A power access limit is known as a current limit. This analysis focuses on its potential relevance to tampering with electricity, such as unauthorised manipulation of power limits or meters, which is a critical concern in energy management and security.
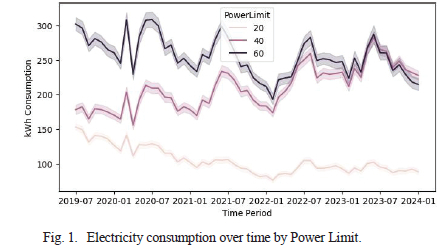
Electricity consumption data analysis from July 2019 to January 2024, as depicted in Fig. 1, reveals a significant trend that requires further investigation. Initially, consumption fluctuated with peaks corresponding to the imposed power limits of 20.0 A, 40.0 A, and 60.0 A, reflecting typical usage patterns. This reflects the greater capacity of connected appliances and the likelihood of higher income or commercial usage in higher-limit customers. All three groups show a noticeable step increase in consumption beginning in early 2020. This period coincides with the COVID-19 lockdowns, which may have increased residential energy use due to stay-at-home measures and remote work.
Following the initial jump, consumption patterns stabilise and exhibit periodic fluctuations consistent with seasonal demand cycles, such as increased use of heating or cooling appliances. However, a marked decline in consumption across all limits becomes evident from mid-2022, with a continued downward trend into 2023-2024. Notably, the 20.0A group demonstrates a gradual and consistent decline in energy consumption from mid-2020 to 2024, reaching levels below 50.0 kWh/month. This unexpected reduction, inconsistent with prior stable or increasing trends, raises concerns about potential electricity tampering.
Such drops could indicate unauthorised interventions, such as meter tampering or bypasses, which are common methods of energy theft. Further forensic analysis of meter data and on-site inspections are recommended to ascertain the cause and mitigate any illicit activities affecting energy distribution and revenue. The 40.0A and 60.0A groups show some convergence in recent years, indicating a saturation point in appliance usage or behavioural changes due to increasing energy costs or demand-side management programmes including the integration of renewable energy systems such as rooftop solar as, which many customers in that category can afford.
To enhance electricity theft detection, this study establishes power (current) limit thresholds and corresponding usage ranges to identify suspicious consumption patterns. For households with a 20.0A current limit, typical monthly usage ranges from 100.0 to 300.0 kWh, with consumption below 50.0 kWh or above 400.0 kWh flagged as suspicious. For a 40.0A limit, the expected range is 300.0 to 600.0 kWh, with anomalies detected below 150.0 kWh or above 800.0 kWh. For a 60.0A limit, usage typically spans 600.0 to over 1000.0 kWh, with irregularities noted below 300.0 kWh or above 1200.0 kWh. These thresholds, derived from historical consumption data and audit findings, enable utilities to pinpoint potential theft through deviations from expected patterns, supporting targeted interventions and improving grid reliability.
2) Anomaly detection and confusion matrix using five techniques:
The confusion matrices for the five models (Logistic Regression, Decision Tree, Random Forest, K-Nearest Neighbours, and XGBoost) evaluated at the customer level reveal distinct performance characteristics in predicting tampering. The model in Fig. 2(a) shows a strong ability to identify tampered cases (high true positives), but it has a significant number of false positives, indicating a tendency to over-predict tampering. This suggests a high sensitivity but lower specificity. Fig. 2(d) shows the decision tree model's classification performance. Fig. 2(c) illustrates the random forest model's predictive accuracy. Fig. 2(b) Presents the K-Nearest Neighbours model's results, and Fig. 2(e) Highlights the XGBoost model's classification outcomes.
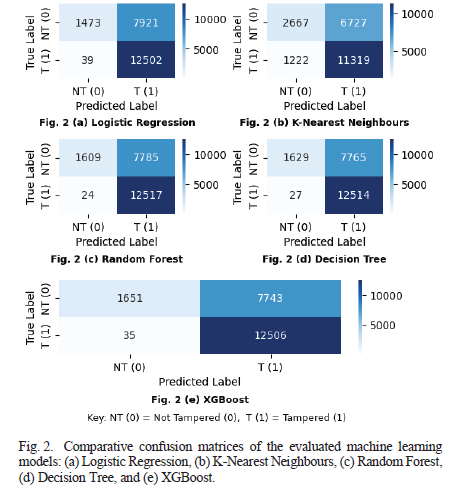
All models demonstrate high true positive rates (ranging from 11,319 to 12,517), indicating strong sensitivity in detecting tampered cases. However, the false positive rates are notably high across Logistic Regression (7,921), Decision Tree (7,765), Random Forest (7,785), and XGBoost (7,743), suggesting a tendency to over-predict tampering. The K-Nearest Neighbours model stands out with the lowest false positives (6,727) but suffers from the highest false. The Random Forest and Decision Tree models show the highest true positive counts (12,517 and 12,514), suggesting robust detection of tampered cases.
However, their high false positive rates limit specificity. The K-Nearest Neighbours model offers a better balance by reducing false positives at the cost of increased false negatives, which may be preferable in scenarios where avoiding false alarms is critical. Logistic Regression and XGBoost exhibit similar performance profiles, with moderate false negative rates and high false positives, aligning with the ensemble and tree-based models' trends. These results suggest that model selection should depend on the specific application needs prioritising sensitivity (detecting all tampered cases) or specificity (minimising false alarms). Further optimisation, such as adjusting thresholds or feature engineering, could enhance overall performance.
3) Analysis of Distribution of Predicted Tampering Status by Power Limit (Decision Tree)
The distribution of predicted tampering status (Not tampering [0] and tampering [1]) among customers based on their monthly energy consumption, categorised by three power limits (20.0 A, 40.0 A, and 60.0 A), as predicted by a Decision Tree model, is illustrated by the graph in Fig. 3. The y-axis represents the number of customers by monthly consumption ( kWh), while the x-axis denotes the power limit categories. The number of customers is counted monthly for the period of 60 months; hence, the number of customers refers to the number of tampering instances with a maximum of one count per month per customer. The Decision Tree model's predictions indicate a strong correlation between power limits and predicted tampering status. At the lowest limit (20.0 A), the model predicts a substantial majority of customers' monthly consumption (300,000) as tampering, reflecting insufficient energy purchase leading to manipulation. As the power limit increases to 40.0 A, the number of not tampering predictions rises to 200,000 cases, suggesting a moderation in tampering behaviour, though tampering remains significant (250,000).
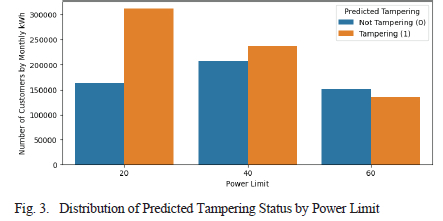
At the highest limit (60.0 A), the model predicts almost an equal distribution of around (150,000) cases each, implying that a 60.0 A limit may better accommodate legitimate consumption, minimising tampering. These findings highlight the importance of setting appropriate power limits to deter tampering over and above punitive measures, with higher limits potentially aligning with actual needs. Further analysis, including validation against actual tampering data and consideration of socioeconomic factors, is recommended to refine these insights.
4) Analysis of model performance
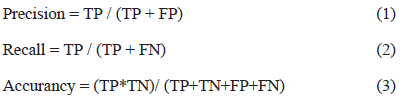
To enhance the accuracy and scalability of electricity theft detection, a range of supervised machine learning models were trained and evaluated using labelled customer consumption data, including features derived from meter audits and historical usage patterns. Furthermore, the accuracy is computed and shown. This method makes it easier to evaluate the classifier's ability to correctly identify anomalies in the data. True positive (TP), false positive (FP), true negative (TN), and false negative (FN) are the four components that constitute the system. The actual class labels are represented by the rows of the matrix, while the expected class labels are represented by the columns. The objects outside the diagonal indicate wrong classifications, resulting in an accuracy score, whereas the items along the diagonal (from top-left to bottom-right) show appropriate predictions. Equations 1,2 and 3 below shows some of the formulars used to determine the precision, recall and accuracy of the evaluated models from different techniques 32.
The objective was to identify which algorithm performs best in classifying tampered meters (tampering=1) with high reliability. Five commonly used classification models - Decision Tree, Logistic Regression, K-Nearest Neighbours (KNN), Random Forest, and XGBoost were assessed based on four key evaluation metrics: accuracy, precision, recall, and F1-score for the tampering class 33. Fig. 4 and Table II present a comparative evaluation of five machine learning classifiers in detecting cases of electricity meter tampering cases (tampering=1). All models achieved comparable accuracy (~0.70-0.80), with minor differences. However, notable performance variations emerge in class-specific metrics, especially recall and F1 score, which are more indicative of a model's ability to correctly identify tampering cases.
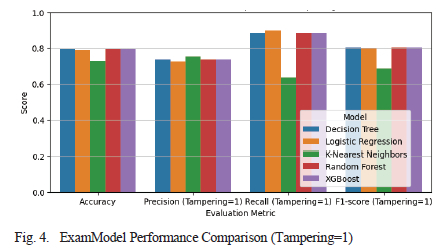
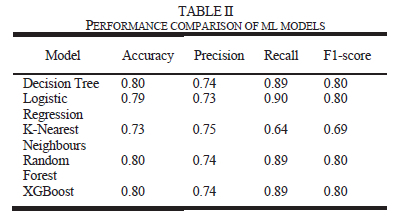
Random Forest and XGBoost consistently outperformed other models across all metrics, achieving the highest recall of approximately 0.89, indicating their strong ability to detect true tampering instances without excessive false negatives. In contrast, KNN exhibited the lowest recall (~0.64), suggesting it missed a considerable number of actual tampering cases. This is critical in electricity theft detection, where false negatives can lead to continued losses. Both Random Forest and XGBoost also maintained high precision and F1-scores, reflecting balanced performance. Given these results, ensemble models are the most effective classifiers for real-world deployment in electricity theft detection systems.
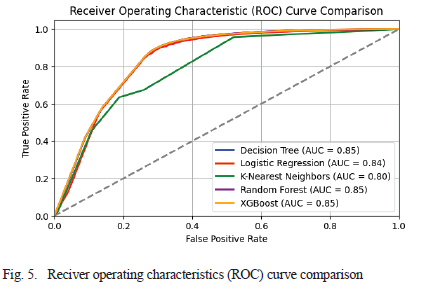
Although the overall accuracy values remain below 90%, this outcome is expected in real-world electricity theft detection due to class imbalance and behavioural overlap between legitimate and tampered consumption patterns. In such applications, recall and F1-score provide more meaningful evaluation measures than accuracy, since undetected tampering cases directly contribute to continued non-technical losses. Therefore, the achieved performance reflects realistic operational conditions using authentic municipal data and remains consistent with comparable studies based on real-world electricity consumption datasets. From Fig. 5, The Receiver operating characteristic (ROC) curves show that ensemble models achieve the highest Area under the ROC curve (AUC) (0.85), consistent with their strong recall and F1-scores. Random Forest, XGBoost, and Decision Tree maintain superior discrimination while keeping false positive rates lower than KNN, which shows the weakest curve. This figure reinforces that ensemble-based methods provide the most reliable and balanced performance for electricity theft detection.
B. Survey Results and Discussion
1) Electricity theft survey and analysis
The study was conducted to comprehend the patterns and perspectives related to the act of power theft. The aim of this study was to gain a comprehensive understanding of many factors that contribute to power theft and to analyse potential approaches to mitigate this problem 15. The survey was essential for collecting relevant information that can help properly resolve the issue. Furthermore, the survey aimed to assess the level of public knowledge and opinions regarding energy theft and its consequences for society. The following are the results of the survey.
The survey participants were of different age groups, from 18 - 51 years of age, as illustrated by Fig. 6. A total of 65 respondents participated in the survey. Most participants (32 respondents, 49.2%) were between the ages of 21 and 35 years. Participants aged between 36 and 50 years formed the second largest group, while respondents aged 18 - 20 years represented the smallest cohort (approximately 3.1%, 2 participants). Participants aged 51 years and above accounted for 7.7% of the total sample.
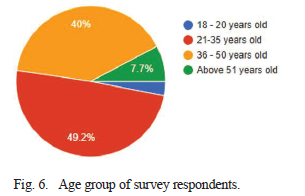
Fig. 7 shows that 41.5% of contributions were from the participants residing in suburb areas, 26.2% are residing in rural areas, 18.5% are those residing in townships, 9.2% and 4.6% are the residents of rural-townships and central business development (CBD)/city centre, respectively. In Fig. 8, 96.9% (63) of participants indicated that they are familiar with or have personally seen cases of electricity theft in their local area. Of the remaining two respondents, one indicated uncertainty while the other reported no awareness of any such cases.
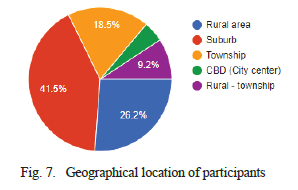
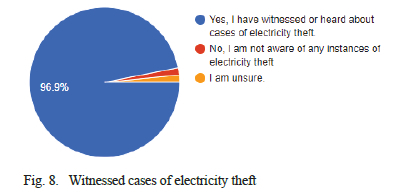
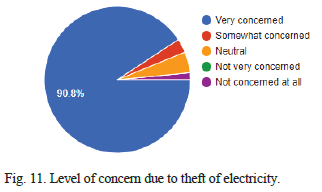
Fig. 9 shows that out of the respondents, 60.0% reported having suspicions about someone engaging in energy theft, while 26.2% claimed to have never suspected anybody of such activity. Additionally, 13.8% chose not to divulge their stance on the matter. Also, 85.0% of respondents believe that the theft of electricity is due to financial adversity, (35.0%), and 23.0% of respondents believe that it is due to deliberate deception and insufficient knowledge of the repercussions of the act, respectively, as shown in Fig. 10. 17.0% of respondents identified the high cost of electricity as a perceived driver of electricity theft. In addition, 90.8% and 3.1% of the respondents are concerned or somewhat concerned about the theft of electricity, respectively, with 1.5% not concerned and 4.6% neutral, as shown in Fig. 10 from the survey.
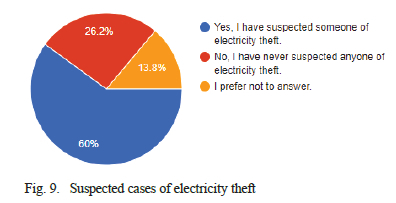
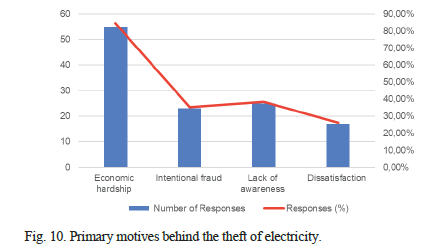
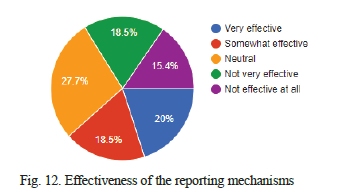
Fig. 12 reveals mixed opinions regarding the effectiveness of current electricity theft reporting mechanisms. The largest group (27.7%) held a neutral view. Positive assessments were slightly more common than negative ones, with 20.4% of respondents rating the mechanisms as very effective and 18.5% as somewhat effective (combined positive: 38.9%). In contrast, 18.5% considered them ineffective to some degree and 15.4% ineffective at all (combined negative: 33.9%). Overall, no single category dominated strongly, and views were fairly dispersed.
The level of electricity theft has been indicated by respondents on a scale of 1 to 10, where 1 was none to very low and 10 was very high. 10 respondents representing 15.4% indicated that the level of electricity theft is at the level of 4 and 5. 8 of the participants indicated that the level of electricity theft is at the lowest scale of 1, which represents 12.3%. Only 5 participants representing 7.7% indicated a scale level of 10, translating to the act of electricity theft being very high, as illustrated by Fig. 13.
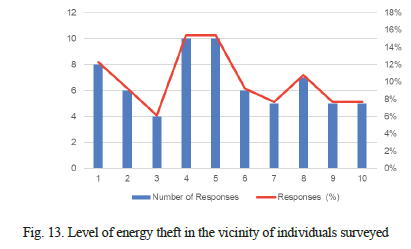
Fig. 14 shows the level of socio-economic factors contributing to electricity theft as per the 65 participants. 75.4% of the participants indicated that socio-economic factors play a significant role in the theft of electricity and that it needs attention. 9.2% indicated to be unsure, and 15.4% of respondents said socioeconomic factors are not related to the theft of electricity.
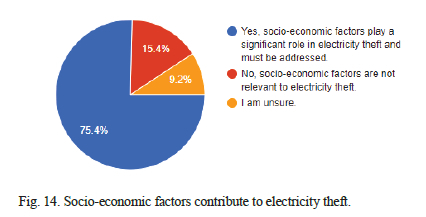
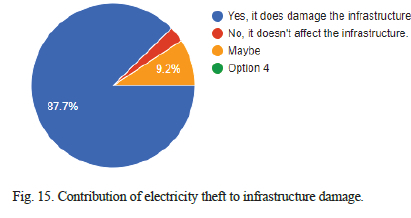
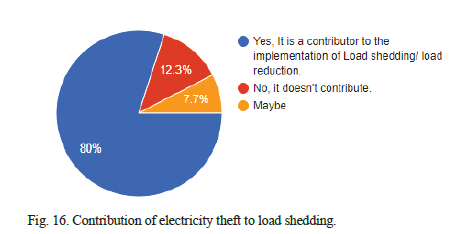
Fig. 15 and Fig. 16 illustrates that, according to respondents, electricity theft is perceived as a major contributing factor to both infrastructure damage and load shedding. 87.7% of the 65 respondents say theft of electricity damages the infrastructure, and 80.0% believe the theft of electricity contributes to RSA experiencing load shedding.
The survey participants indicated their views on measures to deter electricity theft in Fig. 17. Providing financial assistance or flexible payment arrangements received the highest support, with 43 out of 65 respondents (66.2%) identifying it as a potential mitigation strategy. Increasing public awareness of the consequences of electricity theft was supported by 37 respondents (56.9%), while 36 respondents (55.4%) favoured the integration of advanced metering infrastructure (AMI) with tamper-detection capabilities. Furthermore, 30 respondents (46.2%) supported enhanced monitoring and surveillance of high-risk areas.
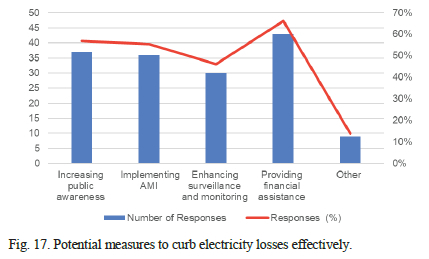
The other 9 respondents, forming 13.8%, proposed the following feasible remedies to mitigate electricity theft.
-
Providing financial assistance to offset the exorbitant expenses associated with power.
-
Eliminating the connection between electricity supply and politics, it is important to recognise that electricity production is costly and should be treated as a regular consumable item, such as food.
-
Reducing the cost of power to a fixed amount for household consumption, such as ZAR200.00 per month, and ensure that payment is mandatory.
-
An amalgamation of mindfulness and heightened concentration on efficiency and honesty among utility employees.
-
Implementing advanced metering will not be effective if continuation to use conventional metering, as it may be easily bypassed. Therefore, it is crucial to also upgrade the meter box, as this will significantly contribute to the solution.
-
The process of applying for electricity needs improvement.
C. Audit findings and Discussion
The data represented graphically in this section shows insights into the tampering and non-tampering rates for different types of electricity meters in various areas: townships, suburban regions, and rural areas.
Fig. 18 compares credit and prepaid meters in the township area. Among credit meters, 17 are tampered with, while 116 are intact. For prepaid meters, 30 are tampered with, and 9 are intact. This indicates a higher tampering rate in prepaid meters within the township. In the suburban region, there are fewer tampered credit meters (5) compared to prepaid meters (12). However, the number of untampered meters is significantly higher, with 1,105 credit meters and 364 prepaid meters not tampered with. This shows that tampering is much less prevalent in suburban areas, especially for credit meters, as illustrated by Fig. 19.
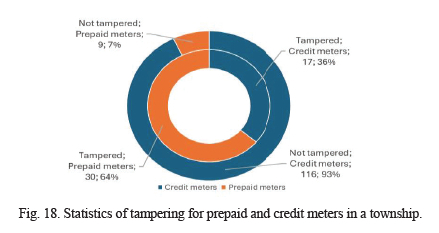
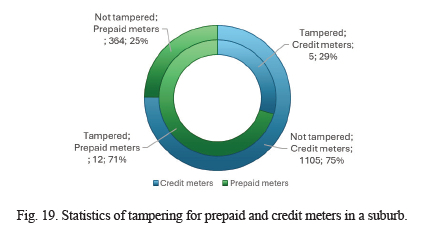
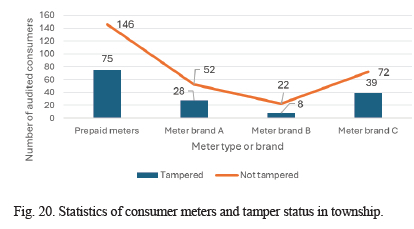
Fig. 20 provides tampering statistics by brand for prepaid meters in the township area. Prepaid meters show the highest tampering rates, with 75 tampered meters, followed by Meter Brand C with 39. Meter Brand A has 28 tampered meters, and Meter Brand B has 8 tampered meters and is the least tampered from the 221 audited meters in the area. This data suggests that Meter Brand C is more susceptible to tampering in townships, while the other two brands exhibit significant tampering activity. Meter Brand A is an intelligent meter with a lot of smart meter capabilities, Meter Brand C is a smart meter, and Meter Brand B is a traditional prepaid meter. In rural areas, tampering is much more widespread. Prepaid meters have the highest tampered meters, at 1,124, while Meter Brand C also has high tampered rates (492 tampered meters). Compared to townships and suburban areas, rural areas experience a significantly higher level of meter tampering, especially with Meter Brand C followed by A, as shown in Fig. 21.
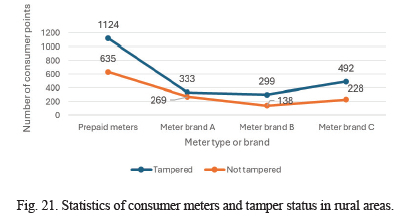
These figures reveal geographical and brand-related differences in tampering behaviour, with rural areas and prepaid meters being more vulnerable to tampering than suburban areas and credit meters. The statistics suggest potential areas for targeted interventions to reduce tampering based on meter type and location.
V. CONCLUSION
The integrated approach to electricity theft detection presented in this study, combining community engagement, audit analytics, and machine learning, offers a robust framework for addressing non-technical losses (NTLs) in the Pietermaritzburg Municipality, South Africa. By analysing electricity consumption data from 21,935 prepaid meter customers over five years (2019-2024), the study identified clear patterns linked to meter tampering and electricity theft. Among the machine learning models evaluated, Random Forest and XGBoost performed best overall. These models achieved the highest scores in accuracy, precision, recall, and F1 score for correctly identifying tampered accounts. The results highlight the strong potential of ensemble learning methods to improve tampering detection. This works especially well when combined with thoughtful feature engineering, which creates meaningful derived variables from the raw data, and anomaly detection techniques. Overall, this approach provides utilities with a more accurate and scalable way to identify and address non-technical losses on a large scale.
Survey results underscore the socio-economic drivers of electricity theft, with 85.0% of respondents attributing it to financial hardship and 75.4% recognising the role of socio-economic factors, suggesting that solutions must extend beyond technological interventions. Audit findings further reveal geographical disparities, with rural areas and prepaid meters showing higher tampering rates, necessitating targeted strategies such as improved meter security and community education. The observed decline in consumption across all power limits (20.0A, 40.0A, and 60.0A) from 2023 onwards may indicate emerging energy conservation trends or tampering, warranting further forensic investigation.
The study's implications are profound for utility management, advocating for a balanced approach that integrates advanced metering infrastructure with socio-economic support, such as financial aid (supported by 66.2% of respondents) and public awareness campaigns (56.9%). Future extensions could explore real-time monitoring systems, validate findings with larger datasets, and assess the impact of policy interventions on reducing NTLs. This holistic strategy not only can mitigate financial losses estimated at ZAR7.5 billion annually in South Africa but also has the potential to enhance grid reliability and promotes equitable access to electricity, paving the way for sustainable energy management in developing countries.
REFERENCES
[1] S. T. Abel, J. Tsado, and O. J. Tola, "Mitigation of Electricity Theft at Low Distribution Voltage End Using Matrix Converter," in 2022 5th Information Technology for Education and Development (ITED), Nov. 1-3, 2022, pp. 1-5, doi: 10.1109/ITED56637.2022.10051599.
[2] Parliamentary, Monitoring, Group, and (PMG). "Quarter 3 expenditure of SOEs for 2023/24 " https://pmg.org.za/committee-meeting/38318/ (accessed Accessed: Mar. 20, 2026.
[3] J. D. Mujuzi, "Electricity theft in South Africa: examining the need to clarify the offence and pursue private prosecution?," Obiter, vol. 41, no. 1, pp. 78-87, Apr. 1, 2020 [ Links ]
[4] D. Dangar and S. K. Joshi, "Electricity Theft Detection Techniques for Distribution System in GUVNL.," in 2nd Two Days National Conference on Recent Trends In Electrical and Electronics & Communication Engineering (rteece 2014), 2014, pp. 11-18.
[5] P. Mills, "PC proxy: a method for dynamical tracer reconstruction," Environmental Fluid Mechanics, vol. 18, no. 6, pp. 1533-1558, Dec 2018. [ Links ]
[6] S. Janthong, R. Duangsoithong, and K. Chalermyanont, "Feature Extraction of Risk Group and Electricity Theft by using Electrical Profiles and Physical Data for Classification in the Power Utilities," ECTI Transactions on Computer and Information Technology (ECTI-CIT), vol. 18, no. 1, pp. 51-63, Jan. 20, 2024. [ Links ]
[7] S. Bahrami, E. Yumuk, A. Kerem, B. Topçu, and A. Kaya, "Electricity Theft Detection Using Rule-Based Machine Leaning (rML) Approach," Gazi Üniversitesi Fen Bilimleri Dergisi Part C: Tasarım ve Teknoloji, vol. 12, no. 2, pp. 438-456, Jun. 6, 2024.
[8] I. U. Khan, N. Javeid, C. J. Taylor, K. A. Gamage, and X. Ma, "A stacked machine and deep learning-based approach for analysing electricity theft in smart grids," IEEE Transactions on Smart Grid, vol. 13, no. 2, pp. 1633-1644, Dec. 9, 2021. [ Links ]
[9] M. Akhmet, M. Tleubergenova, and A. J. E. Zhamanshin, "Modulo periodic Poisson stable solutions of quasilinear differential equations," vol. 23, no. 11, p. 1535, Nov. 18, 2021.
[10] M. S. Saeed, M. W. Mustafa, U. U. Sheikh, A. Khidrani, and M. N. H. Mohd, "Theft detection in power utilities using ensemble of chaid decision tree algorithm," Science Proceedings Series, vol. 2, no. 2, pp. 161-165, Oct. 3, 2020. [ Links ]
[11] F. Shehzad, Z. Ullah, M. Alhussein, K. Aurangzeb, and S. Aslam, "Deep learning-based meta-learner strategy for electricity theft detection," Frontiers in Energy Research, vol. 11, p. 1232930, Sep. 27, 2023. [ Links ]
[12] N. M. Ibrahim, S. T. F. Al-Janabi, and B. Al-Khateeb, "Electricity-theft detection in smart grids based on deep learning," Bulletin of Electrical Engineering Informatics, vol. 10, no. 4, pp. 2285-2292, Aug. 1, 2021. [ Links ]
[13] M. N. Hasan, R. N. Toma, A.-A. Nahid, M. M. Islam, and J.-M. Kim, "Electricity theft detection in smart grid systems: A CNN-LSTM based approach," Energies, vol. 12, no. 17, p. 3310, Aug. 28, 2019. [ Links ]
[14] R. Xia, Y. Gao, Y. Zhu, D. Gu, and J. Wang, "An efficient method combined data-driven for detecting electricity theft with stacking structure based on grey relation analysis," Energies, vol. 15, no. 19, p. 7423, Oct. 10, 2022. [ Links ]
[15] O. Dizdar, Y. Mao, W. Han, and B. Clerckx, "Rate-splitting multiple access: A new frontier for the PHY layer of 6G," in 2020 IEEE 92nd vehicular technology conference (VTC2020-Fall), Nov. 18, 2020: IEEE, pp. 1-7.
[16] L. J. Lepolesa, S. Achari, and L. Cheng, "Electricity theft detection in smart grids based on deep neural network," IEEE Access, vol. 10, pp. 39638-39655, Apr. 11, 2022. [ Links ]
[17] S. A. Badawi, D. Guessoum, I. Elbadawi, and A. Albadawi, "A novel Time-Series transformation and Machine-Learning-Based method for NTL fraud detection in utility companies," Mathematics, vol. 10, no. 11, p. 1878, May 30, 2022. [ Links ]
[18] F. Soleimani Nasab and F. Ghaderi, "On the effect of sampling frequency on the electricity theft detection performance," IET Signal Processing, vol. 16, no. 9, pp. 1094-1105, Dec, 2022. [ Links ]
[19] A. Ullah, N. Javaid, M. Asif, M. U. Javed, and A. S. Yahaya, "Alexnet, adaboost and artificial bee colony based hybrid model for electricity theft detection in smart grids," IEEE Access, vol. 10, pp. 18681-18694, Feb. 8, 2022. [ Links ]
[20] N. Javaid, M. Akbar, A. Aldegheishem, N. Alrajeh, and E. A. Mohammed, "Employing a machine learning boosting classifiers based stacking ensemble model for detecting non technical losses in smart grids," IEEE Access, vol. 10, pp. 121886-121899, Nov. 17, 2022. [ Links ]
[21] V. Gaur and E. Gupta, "The determinants of electricity theft: An empirical analysis of Indian states," Energy Policy, vol. 93, pp. 127-136, 2016 Jun. 1, 2016. [ Links ]
[22] S. Saini, S. Singh, and R. Singh, "Customer Attitudes Towards the Role of Socio-Economic Factors in Electricity Theft: An Empirical Investigation," International Journal of Social Ecology Sustainable Development, vol. 13, no. 6, pp. 1-21, Nov. 1, 2022. [ Links ]
[23] Z. Babar, F. Jamil, and W. Haq, "Consumer's perception towards electricity theft: A case study of Islamabad and Rawalpindi using a path analysis," Energy policy, vol. 169, p. 113189, Oct. 1, 2022. [ Links ]
[24] M. Kasumba and B. W. Banza, "Identification of Factors Encouraging Household Consumers to Engage in Theft of Electricity in Lubumbashi DR Congo," Rev Ind Eng Lett, vol. 5, no. 1, pp. 22-30, 2019. [ Links ]
[25] H. Briseño and O. Rojas, "Factors associated with electricity losses: A panel data perspective," International Journal of Energy Economics Policy, vol. 10, no. 5, pp. 281-286, 2020. [ Links ]
[26] C. Yurtseven, "The causes of electricity theft: An econometric analysis of the case of Turkey," Utilities Policy, vol. 37, pp. 70-78, Dec. 1, 2015. [ Links ]
[27] F. Jamil and E. Ahmad, "Policy considerations for limiting electricity theft in the developing countries," Energy policy, vol. 129, pp. 452-458, 2019. [ Links ]
[28] C. A. Sibiya, K. A. Ogudo, and E. J. Aladesanmi, "Electricity purchase history ", IEEE Dataport, March 25, 2026, doi:10.21227/v2tj-p57.
[29] C. A. Sibiya, K. A. Ogudo, and E. J. Aladesanmi, "Machine Learning-Based Anomaly Detection in Residential Electricity Usage Patterns Using Meter Data-Case Study (Msunduzi Municipality)," in 2024 IEEE PES/IAS PowerAfrica, 2024: IEEE, pp. 1-5, 7 Oct 2024.
[30] N. Teffo, P. Bokoro, L. Muremi, and T. Paepae, "Performance evaluation of selected machine learning techniques in the detection of non-technical losses in the distribution system," in 2024 32nd Southern African Universities Power Engineering Conference (SAUPEC), 2024: IEEE, pp. 1-524, Jun. 2024.
[31] C. A. Sibiya, K. A. Ogudo, and E. J. Aladesanmi, "Electricity theft (tampering) in communities and awareness," Google Form survey. [Online]. Available: https://forms.gle/bYSe48orf3ykTLdd7. [Accessed: 12-Mar-2024] .
[32] J. C. Obi, "A comparative study of several classification metrics and their performances on data," World Journal of Advanced Engineering Technology and Sciences, vol. 8, no. 1, pp. 308-314, Feb 2023. [ Links ]
[33] V. S. S. Nandipati and L. V. Boddala, "Credit card approval prediction: A comparative analysis between logistic regression, knn, decision trees, random forest, xgboost," ed, 2024.

Cyncol A. Sibiya was born in Johannesburg, South Africa. He received the MEng degree from Central University of Technology, Bloemfontein, Free state, South Africa in 2021, the B.Tech. from Durban University of Technology, Durban, KwaZulu-Natal, South Africa in 2018, and a National Diploma from Mangosuthu University of Technology, Durban, KwaZulu-Natal, South Africa in 2015. He is currently pursuing the PhD degree in Electrical and Electronics Engineering at the University of Johannesburg, Johannesburg, South Africa.
From 2020 to 2024, he was a Manager for Metering and Tariffs section at Msunduzi Municipality in Pietermaritzburg, South Africa, from 2019 to 2020 and 2018 to 2019 he was an Engineering Technologies/Project Engineer at Umgeni-uThukela water and Umhlathuze Municipality respectively, in 2017 he was a Junior Engineer at Vusaken Engineering Consulting. Since 2024 he has been a Lecturer at the Mangosuthu University of Technology, Durban, South Africa, specializing in Electrical and Electronic Engineering Technology. He is the Author of more than 2 articles, and 6 conference papers. His research interest includes development of new technological systems in the field of energy and security to solve everyday problems and better the future. He is passionate about advancing knowledge in the field, balancing teaching responsibilities with active research endeavors, contributing to innovation and the development of practical solutions.
Mr Sibiya is a professional registered engineering technologist with ECSA and he is a member of the IPET and IAS. Mr. Sibiya's awards and honors include the best presentation awards in the international research conference REPE2020 - ICSGE2020 and ICACER 2021 - ICEEEP 2021.
Kingsley A. Ogudo, received a PhD in Electrical Electronic /Telecommunications and a master's degree in electrical and Electronics Engineering from the Tshwane University of Technology (TUT), South Africa, in 2010 and 2016 respectively. He received his second PhD in Electronics and Optoelectronics systems from the University of Paris Est, France in July year 2018.
His research interest includes electronic wireless telecommunication systems, optoelectronic devices, power electronics; system Integration of devices based on renewable Energy management Sources, Telecommunication engineering high-frequency electronics, AI, IoT and data analytics, physics and applied mathematics. He is a Professional Engineer Technologist certified by ECSA and he is a Senior member of the IEEE Society. He is a Fellow at SAIEE, and Secretary General for SAIEE Entrepreneur & innovation chapter.
He has lectured in three different university (Tshwane University of Technology, UNISA and UJ) for the past 14 years, and has thought different electrical & electronics engineering modules (Subjects) to both undergraduates and post-graduate's students. He has acted as an associate guest editor for prestigious journals, and as an editor of a book for the past 5 years. He has published over 160 international ISI Journal articles and international conference papers. He is currently an Associate Professor/Researcher and head of department of Electrical and Electronics Engineering Technology, University of Johannesburg (UJ), South Africa.

Ereola J. Aladesanmi, was born in Nigeria. He received B. Tech (Hons) in Electrical & Electronics Engineering from Ladoke Akintola University of Technology, Ogbomosho, Oyo-State, Nigeria, in 2006, and MSc degree in Electrical Engineering from University of Cape Town in 2015, and a Ph.D. degree from the University of KwaZulu-Natal, South Africa in 2021.
He is very proficient in data analysis with python and R language. His research interests include power electronics and renewable energy, microgrid and energy storage systems, energy management, and machine learning. His work focuses on the design, modelling, and optimization of off-grid and hybrid energy systems, as well as the techno-economic analysis and life cycle assessment of clean energy technologies.
He has authored peer-reviewed publications and participated in international projects addressing energy access, grid integration, and sustainable development. Dr. Aladesanmi collaborates with academic institutions, development organizations, and government agencies to advance innovative, scalable, and sustainable energy solutions. He is a member of the IEEE and other professional bodies and actively contributes to research and policy discourse in the fields of energy systems, power electronics, and development engineering.
