



Services on Demand
Journal

Article
 English (pdf)
 Article in xml format
 Article references
 Automatic translation
 Send this article by e-mail
Indicators
Related links
-
 Cited by Google
 -
 Similars in Google
Share

 Permalink
Water SA
On-line version ISSN 1816-7950Print version ISSN 0378-4738
Water SA vol.51 n.2 Pretoria Apr. 2025
https://doi.org/10.17159/wsa/2025.v51.i2.4105
RESEARCH PAPER
Characterisation and water resource assessment of Shashani sand river, Matabeleland South, Zimbabwe
Tinashe ShumbaI; Annatoria ChinyamaII; Courage BangiraIII; Peter RwakatiwanaI; Oniward SvubureI
ISchool of Agriculture - Chinhoyi University of Technology, Private Bag 7724, Chinhoyi, Zimbabwe
IICarpe Diem School of Engineering, PO Box 1666, Bulawayo, Zimbabwe
IIIMarondera University of Agricultural Sciences and Technology, PO Box 35, Marondera, Zimbabwe
ABSTRACT
Sand rivers are a common water source throughout the dry regions of the world. However, there is limited literature with regards to their storage capacity and potential water supply. The objective of this study was to characterise the Shashani sand river and assess its potential for water supply, by. estimating aquifer volume and recharge. Sand depth was determined by mechanical probing, and surface area of the river by remote sensing, enabling calculation of aquifer volume. Storage capacity was estimated by multiplying the volume by the porosity, and climatic data used to determine potential recharge into the Shashani sand river, for typical dry, wet and normal years. The Soil Conservation Service (SCS) curve number method was used to determine runoff into Shashani River. The volume of the aquifer was estimated at 23 900 000 m3. The potential recharge from Shashani sand river before abstraction and water losses was 843 831 880 m3 for a wet year, 227 662 070 m3 for a dry year and 550 450 900 m3 for a normal year. The study showed that Shashani sand river has a very high water storage capacity and has the potential to supply water to farmers for domestic use and irrigation of community gardens throughout the year. Findings from this study are useful to water authorities for water budgeting and agricultural planning. Further studies are required to investigate the sustainable abstraction rate. This study will inform the procedures used in the characterisation of sand rivers for agricultural usage; the approach used is lower in cost than others used in the characterisation of resources in the region. The chosen methodology can be applied in the quantification of other sand rivers globally.
Keywords: Sand River, aquifer potential, aquifer recharge, water resources, storage capacity
INTRODUCTION
Due to low precipitation experienced in the semi-arid regions of Zimbabwe, surface reservoirs usually become empty in the dry season (Ayanlade et al., 2022; Hussey, 2007). Consequently, limited water access restricts agricultural practices due to unreliable water sources (Ncube et al., 2010). Sub-Saharan Africa (SSA) faces the problem of inadequate water supply, and the bulk of the inhabitants rely on agriculture as their main source of livelihood (Mokwunye, 2010; Mutiro and Lautze, 2015). In order to enhance water accessibility in semi-arid regions, several adaptation systems, including surface reservoirs, have been engineered to fulfil the domestic and agricultural water demands of smallholder farmers (De Hamer et al., 2008). Sand rivers have also emerged as an alternative source of water supply in Sub-Saharan Africa (Duker et al., 2020). Smallholder farmers, rural communities, and local authorities often rely on sand rivers as a last resort, especially during droughts when other water sources have been depleted (Nissen-Petersen, 2006). Sand dams (water-harvesting structures built across a seasonal sandy riverbed) are also gaining popularity to improve the usage of sand rivers, as suggested by Castelli et al. (2022).
Gwate (2012) defined sand rivers as the dry riverbed and the underlying alluvial aquifer, which usually contains groundwater throughout the year. Alluvial aquifers are groundwater units, generally unconfined, hosted in laterally discontinuous layers of sand, silt and clay deposited by a river in a river channel, banks or floodplain (Love et al., 2007). From these definitions one can conclude that the alluvial aquifer is integral to a sand river system as this is the primary storage in such a system. In literature the terms 'sand river' and 'alluvial aquifer' are used interchangeably since the two exist together.
In SSA, surface flow occurs for a limited period during the rainy season and the water levels of the alluvial aquifers are replenished (Mansell and Hussey, 2005). Water continues to flow within the alluvial material after surface flow has ceased (Svubure et al., 2007). The alluvial material in the river provides temporary water storage which can be exploited to augment water supply during the dry periods. Alluvial aquifers have a direct relationship with the stream flow because of their shallow depth (Mvandaba et al., 2015), and they contribute significantly to the water budget (Gwate, 2012).
No surface flow occurs until the aquifer is saturated (Mansell and Hussey, 2005). Alluvial aquifers are recharged by replenishment from the intermittent surface flow, lateral groundwater flow as well as intermittent rainfall (Mpala, et al., 2020). De Hamer et al., (2008) described the aquifer recharge and river flow processes as simultaneous rather than independent. As a flood travels down the riverbed, water infiltrates into the sandy and gravel alluvial deposits of the channel beds. According to Nissen-Petersen (2006), flash floods also contribute to the recharge process of alluvial aquifers.
Sand rivers have been utilized as a water source in agriculture for many years, and there has been development in the abstraction of water from sand rivers over time (Saveca et al., 2022).
Hussey (2003) points out that the expertise to abstract water is a traditional talent in Southern Africa. The exploitation of sand rivers has proven to be sustainable, as evidenced by the use of sand rivers as a water source for some large-scale projects such as the Chisumbanje Irrigation Project in Zimbabwe (Gwate, 2012; Hussey, 2003). They have been used for domestic water supply for small towns, livestock watering, irrigated gardens, and commercial applications such as large-scale irrigation schemes and cattle ranching (Hussey, 2007).
Limited knowledge about the capacity of sand rivers in the SSA region hinders optimal water resource management, potentially leading to underutilization or overexploitation. Therefore, studying the capacity of these rivers is crucial to ensure sustainable exploitation of the resource. The Shashani river has been assessed at a small scale for irrigation by subsistence farmers (Moulahoum, 2018). However, there have been no previous studies to inform management of the river at a larger scale. The objective of this study was to characterise Shashani sand river and assess the availability of water resources for irrigated agriculture.
MATERIALS AND METHODS
Study area
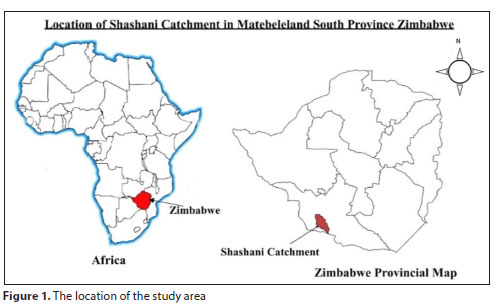
Shashani River is a tributary of the Limpopo River, and is located in Matabeleland South Province in Zimbabwe (Fig. 1). The Shashani sub-catchment (Fig. 2) is estimated to cover an area of 2 826 km2 (Mpala et al., 2016) and is situated in the northern part of the Limpopo Basin. Shashani River flows in a southward direction and is 206 km long. It originates near the town of Sandown in the central watershed of Zimbabwe (Mpala et al., 2016). The upstream third of the river passes through a commercial farming region and is dammed at two sites. The Shashani Dam is located 37 km downstream of the source and the larger Gulati Dam is located 92 km downstream of the source. The middle and lower third of the river pass through a communal farming area and a conservation zone, respectively, with most sand abstraction practised in this area (Mpala et al., 2016). The Shashani River was chosen for this study because of the availability of both satellite and weather data from previous studies. The Shashani River is used as a water source by farmers in the region.
Methods
To characterise the Shashani sand river, the physical and hydraulic properties of the aquifer were determined. The physical properties that were determined were the total volume of the alluvium, the depth of the alluvium and the total surface area of the river channel. The hydraulic properties that were determined were storage capacity of the aquifer and recharge of the aquifer.
The volume of the alluvium was determined by multiplying the total surface area of the river by the average depth of the aquifer. To determine the average aquifer depth, a probing exercise was conducted along the river channel. The probing process involved mechanically driving a steel rod into the sediment of the sand river until it reached the bedrock. The exercise was executed in two stages, in July 2021 and in September 2021, because those were the driest periods of the year and there was easy access to the riverbed. To increase the reliability of the results, three sections (which allowed for a long, unobstructed area ideal for reliable probing) along Shashani River were probed to find the average depth. The locations of these sections are presented in Fig. 3. In order to improve the accuracy of measuring the depth at a section, the probing points were located at 9 equidistant points (50 m apart ) along the midsection, right bank, and left bank of the river. The 9 readings were averaged for the value of the aquifer depth at each section. Any significant deviation from the average depth at a specific point could indicate the presence of a potential obstruction, such as a rock or boulder. To improve the spatial resolution of aquifer depth data for this basin-wide study, historical depth measurements from upstream (Moulahoum, 2018) and downstream (Mpala et al., 2016) locations were integrated into the analysis. The average aquifer depth in this study was the average of all the measured depths in the study and the historical aquifer depth values from literature.
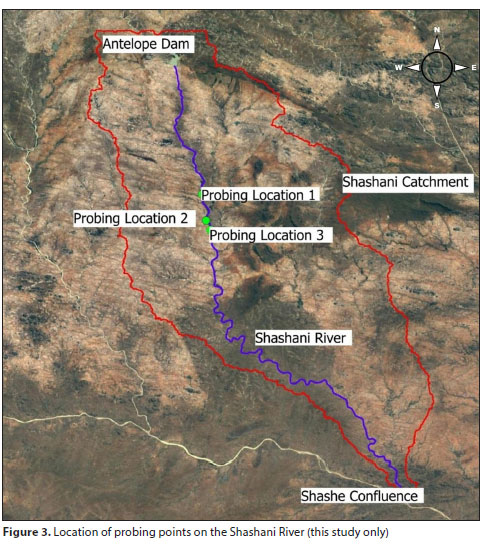
The total surface area of the river channel was estimated using Google Earth, from Antelope Dam to Shashe Confluence. A polygon was generated by digitizing the riverbed's perimeter on the digital map. The area enclosed by this polygon was subsequently quantified using the integrated area measurement function within the Google Earth software application. The volume of the aquifer was determined by multiplying the average depth by the surface area, as shown in Eq. 1.

The storage capacity of the aquifer was determined by multiplying the total volume of the alluvium by the porosity of the sand in the aquifer. It is assumed that the maximum storage capacity of an alluvial aquifer is the total volume of voids in the alluvium, since only the pores between the sand particles have the capacity to store water. Therefore, the storage capacity was determined using Eq. 2 below:

The porosity was calculated using Eq. 3 developed by Vukovic and Soro (1992):

where:
n = porosity
Cu = coefficient of grain uniformity
The coefficient of grain uniformity was determined by the grain size analysis test. In the analysis, 8 sediment samples were collected from 3 distinct locations: upstream, middle, and downstream, and sieved using ASTM standard sieves. A digital scale with a 500 g capacity and 0.01 g accuracy was used to precisely measure the mass of sediment retained on each sieve. The coefficient of grain uniformity (Cu) was derived from the particle size distribution curve and used to determine porosity.
For a comprehensive characterization of the alluvial aquifer, a hydrological budget analysis was done to quantify the inflow (recharge) and outflow (abstraction) components of the water balance. A quantitative analysis of channel precipitation, catchment runoff, and lateral inflow from neighbouring groundwater sources was used to estimate the potential recharge into the alluvial aquifer. The net recharge into the aquifer taking into account outflows was determined using Eq. 4:

where:
Qg.in = groundwater inflow (m3/yr)
Qsurf = surface flow (m3/yr)
Qg.out = groundwater outflow (m3/yr)
TP = total precipitation (m/yr)
R = runoff from catchment area (m3/yr)
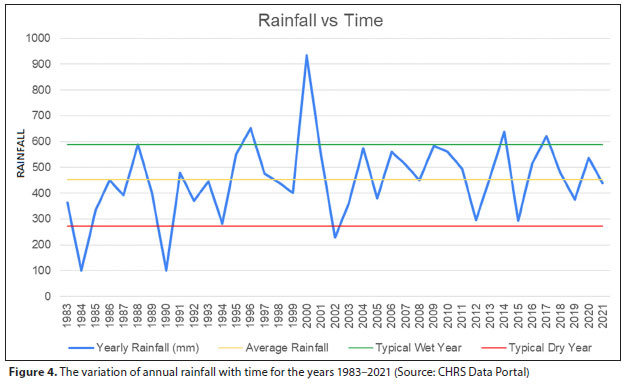
The net recharge into the alluvial aquifer was estimated for different climatic conditions so as to understand the potential water supply of the aquifer. For run-off determination and precipitation estimation, typical wet, dry and normal years were selected. The climate was classified into three major categories: wet years, dry years and normal years as modelled by Knapp et al. (2015). A typical wet year was taken as a year with annual rainfall at least 30% greater than the normal annual rainfall and a typically dry year as a year with annual rainfall at least 40% less than the normal annual rainfall. The normal rainfall was taken as the statistical average of rainfall over the period under study (Knapp et al., 2015). The study area suffers from a significant lack of available data and weather stations, therefore the rainfall data were downloaded from the Centre for Hydrometeorology and Remote Sensing (CHRS) Data Portal for the years 1983-2021. This period was selected because a long range of data would give a more accurate statistical average.
The normal years were taken as the years with rainfall values close to the average rainfall. The values to determine the wet year and the dry year were calculated using the Eqs 5 and 6:

To capture contemporary climate characteristics, recent occurrences of these regimes were selected for in-depth analysis.
To determine the runoff for each typical year the accumulated excess rainfall for each day was added as shown in Eq. 7:

where:
Ρε = accumulated excess rainfall
R = surface runoff
The accumulated excess runoff was determined using the SCS curve number method using Eq. 8:

where the parameter S is mapped to the curve number, CN, as:

The average curve number of the catchment was calculated from the various land cover types. The formula to determine the
average curve number is given in Eq. 10:

where:
CN = average curve number for the whole catchment
A = total catchment area
CNi. = curve number for each land cover type
Ai = area of each land cover type
The USDA SCS curve number method is a widely used empirical method for estimating the amount of surface runoff from a rainfall event. The curve number is determined by analysing the characteristics of the catchment, such as land use, soil type, and antecedent moisture conditions. The soil characteristics determine the rate of infiltration and the amount of water that will flow into the river. Land use cover types were determined using data from Environmental Systems Research Institute (ESRI) land use/land cover (LULC) maps derived from ESA Sentinel-2 imagery at 10 m resolution. This was a composite of LULC predictions for 10 classes throughout the year so as to generate a representative snapshot of a typical year.
The curve number was determined using the hydrologic soil groups, land treatment or land cover type, the hydrological condition and antecedent moisture conditions for each land cover type. The hydrologic conditions and land treatment were assessed during a field survey.
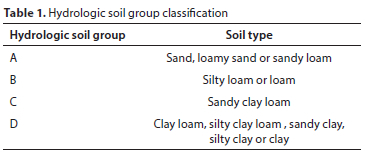
The soil classification was based on the USDA NRCS (2017), as shown in Table 1.
The high permeability of the Shashani River (4.07 m/h, Mansell and Hussey, 2005 cited in Mpala et al., 2016) suggests near-instantaneous recharge from rainfall falling on the river channel. Thus, it was assumed that all rainfall directly recharged the alluvial aquifer prior to the initiation of surface runoff. The volume of rainfall water into the aquifer was estimated by multiplying the recorded rainfall values for the typical year by the total surface area of the aquifer. The total volume of rain water entering the aquifer was determined by Eq. 11:

where:
TP = total precipitation volume into the aquifer (m3)
The surface inflow was considered to be negligible in this study since the river is dammed upstream.
The upstream inflow and downstream outflow is influenced by the hydraulic gradient. However, the hydraulic conductivity of the material influences the rate at which the water flows through to the next section. The hydraulic conductivity which was used was obtained from previous studies by Jele (2018). To determine the hydraulic gradient of the water table, probing was used. The same sections that were used to determine the aquifer depth were studied to determine the hydraulic gradient as shown in Fig 3. During the process of probing, the steel rod reaches the water layer, and as the rod is pulled out the water molecules remain on the steel rod. The length of the mechanical probe which had water molecules was measured to determine the height of the water table from the bedrock. The hydraulic gradient was calculated for the three different sections under study, and the average value was then used as representative of the whole section.
Therefore:

To determine the groundwater inflow and groundwater outflow, historical data for specific discharge were obtained from Jele (2018), due to the absence of working piezometers in the study area. The Darcy Equation was adopted in this study to determine the specific discharge along the river channel. The slope of the water table was calculated from the difference in water levels for the upstream and downstream cross-sections of the study area. The cross-sectional area of the flow path was determined from the results of the topographical survey. The volume of the water was then determined by multiplying the discharge with the average cross-sectional area.

where:
q = specific discharge (m/s)
k = hydraulic conductivity (m/s)
 = slope of the water table (m/m)
Qg,in = qAf
Qg,out = -qAf
where:
Qgin = groundwater inflow (m3/yr)
Qgout = groundwater outflow (m3/yr)
Af = cross-sectional area of the flow path
RESULTS
Storage capacity of the aquifer
In this study the maximum sand depth that was recorded during field measurements was 3.0 m at one section of the river and the average depth of the Shashani sand river was 2.04 m. After incorporating the findings by Moulahoum (2018) and Mpala et al. (2016), the average depth of the aquifer was estimated to be 1.9 m. The total surface area of the aquifer was found to be 12 573 060.27 m2, and the aquifer volume was 23 900 000 m3. The average porosity of sand is 0.35; this implies that the sand river is able to store 8 365 000 m3 of water.
Recharge estimation
The variation of rainfall in the study area is shown in Fig. 4. The rainfall values for the typical wet, dry and normal year were found to be 589 mm, 271 mm and 453 mm, respectively. For this study a typical wet year was taken to be 2017, the dry year was taken to be 2015 and the normal year was taken to be 2021. These years were specifically chosen because they are more recent and thus better representative of the current weather patterns.
From the observations it was found that Shashani catchment consists of sandy clay and silt clay soils, thus the soils are classified as hydrologic soil groups C and D, respectively, in accordance with guidelines of the USDA NRCS (2007). The results of the curve number determination are as shown in Table 2.
Using the rainfall data and computed curve number, the accumulated runoff for the typical wet, dry and normal years were found to be 386 mm, 252 mm and 104 mm, respectively. The volumetric contribution of the runoff to the water remaining in Shashani River was 836 420 227 m3 for a typical wet year, 544 749 349 m3 for a normal year and 224 253 194 m3 for a dry year.
Precipitation
The volumetric contribution of direct rainfall to the water in Shashani sand river were 7 410 385 m3 for a typical wet year, 5 700 286 m3 for a typical normal year and 3 407 601 m3 for a typical dry year. Previous studies by Mansell and Hussey (2005) and Mpala et al. (2020) indicated that the permeability of Shashani River is about 4.07 m/h. This suggests that the recharge is instantaneous, hence the direct rainfall was assumed to recharge the aquifer.
Potential recharge into the sand river
The potential recharge into Shashani sand river before any abstraction and water losses was 843 831 882.4 m3 for a wet year, 550 450 905.4 m3 for a normal year and 227 662 065.4 m3 for a dry year.
DISCUSSION
The sand river was characterised in terms of its geometry, properties and the volume of water available in the hydrological catchment. The study demonstrated that the water supply to the Shashani catchment is considerably greater than the sand river's ability to accommodate it. The potential for use of the resource is great. This is in agreement with Duker et al. (2020) and Love et al. (2007), who suggested increasing the usage of the resource based on their findings. Building upon the work of Ibrahim and Fataw (2020), one can conclude that the sand river aquifer exhibits the capacity to store sufficient water to irrigate 36 000 ha of maize for an entire growing season. This highlights the aquifer's potential to sustain agricultural activities. Depending on the availability of other contributing factors such as land and financial resources for maximum production, this water is sufficient to support the production of about 18 000 tonnes of maize, which might assist in alleviation of hunger in Zimbabwe (Lunduka et al., 2019).
CONCLUSIONS AND RECOMMENDATIONS
The objective of this study was to characterise the Shashani sand river and assess its potential for water supply. The results of the study revealed that Shashani River has great potential to supply water for irrigation since its storage capacity is large. The study has shown that a relatively large amount of water recharge is available in Shashani sand river annually. However, the Shashani sand river is not capable of storing all of the water. The water that is stored is adequate for significant agricultural activity in the region. Despite its great potential, currently the use Shashani sand river has been limited to small-scale irrigation, i.e., small gardens for domestic supply of vegetables. The limitations of this study were that it depended on historical data to measure flows along the river. Piezometers and weather stations need to be installed along the river channel to accurately measure the flows to aid planning. The findings of this study are useful to water authorities and stakeholders to do water budgeting at a catchment level, rather than for particular sections. The methods adopted in this study can be applied in other areas, therefore this approach can be used to estimate the potential of other sand rivers.
Further studies can also be done along the river to determine the connectivity between the sand river and other groundwater sources in the vicinity of the river. In addition, studies can be done to estimate the abstraction and other water losses along the river. Installation of weather stations is necessary to ensure the accuracy of the results in determining the runoff volume and other water losses for the future. This will assist in the estimation of the safe yield so as to find sustainable abstraction rates. The authors also recommend the construction of sand dams to reduce the amount of water lost through downstream outflow.
ACKNOWLEDGEMENTS
The authors would like to acknowledge Chinhoyi University of Technology at which this research was conducted. This research was supported by IHE Delft University (DUPC2) under the CES_RURAL project. The fieldwork investigations and research were supported by the Dabane Trust. The authors also acknowledge the Civil and Water Engineering Department at the National University of Science and Technology, Zimbabwe, for providing the laboratory for soil testing and analysis.
REFERENCES
AYANLADE A, OLUWARANTI A, AYANLADE OS, BORDERON M, STERLY H, SAKDAPOLRAK P and AYINDE AFO (2022) Extreme climate events in sub-Saharan Africa: A call for improving agricultural technology transfer to enhance adaptive capacity. Clim. Services 27 100311. https://doi.org/10.1016/j.cliser.2022.100311 [ Links ]
CASTELLI G, PIEMONTESE L, QUINN R, AERTS J, ELSNER P, ERTSEN M and BRESCI E (2022) Sand dams for sustainable water management: challenges and future opportunities. SSRN Electron. J. https://doi.org/10.2139/ssrn.3998987 [ Links ]
DE HAMER W, LOVE D, BOOIJ MJ and HOEKSTRA AY (2007) A rainfall-runoff model for two small ungauged catchment using the water balance of a reservoir for calibration. In: Proc. 8th Waternet/ WARFSA/GWP-SA Symposium, 31 October - 2 November 2007, Lusaka. URL: http://doc.utwente.nl/61523/ (Accessed 21 October 2021). [ Links ]
DUKER AEC, MAWOYO TA, BOLDING A, DE FRAITURE C and VAN DER ZAAG P (2020) Shifting or drifting? The crisis-driven advancement and failure of private smallholder irrigation from sand river aquifers in southern arid Zimbabwe. Agric. Water Manage. 241 106342. https://doi.org/10.1016/j.agwat.2020.106342 [ Links ]
GWATE O (2012) Rethinking appropriate technology for rural water supply in semi arid regions of Zimbabwe. In: Proceedings of the IASTED African Conference on Water Resource Management, AfricaWRM 2012, September 2012. 292-298. https://doi.org/10.2316/P.2012.762-013 [ Links ]
HUSSEY SW (2003) The feasibility of sand-abstraction as a viable method of ground water abstraction. Phd thesis, Loughborough University. [ Links ]
HUSSEY S (2007) Water From Sand Rivers: Guidelines for Abstraction. WEDC, Loughborough University, Loughborough. [ Links ]
IBRAHIM B and FATAW I (2020) Scheduling supplementary irrigation for maize production: analysis of the requirements for climate smart farming for rural development. Open Access Lib. J. 7. https://doi.org/10.4236/oalib.1106942 [ Links ]
ISRIC (2005) Atlas of SOTER-derived maps of Zimbabwe: Impact of desertification on food security. ISRIC - World Soil Information, Wageningen. [ Links ]
JELE L (2018) Investigating the sustainable abstraction rate for alluvial aquifers; A case study of the Shashani River. BEng thesis, National University of Science and Technology, Zimbabwe. [ Links ]
KNAPP AK, HOOVER DL, WILCOX KR, AVOLIO ML, KOERNER SE, LA PIERRE KJ, LOIK ME, LUO Y, SALA OE and SMITH MD (2015) Characterizing differences in precipitation regimes of extreme wet and dry years: implications for climate change experiments. Glob. Change Biol. 21 (7) 2624-2633. https://doi.org/10.1111/gcb.12888 [ Links ]
LOVE D, DE HAMER W, OWEN RJS, BOOIJ M, UHLENBROOK S, HOEKSTRA AY and VAN DER ZAAG P (2007) Case studies of groundwater - surface water interactions and scale relationships in small alluvial aquifers. In: Proc. 8th Waternet/WARFSA/GWP-SA Symposium, 31 October - 2 November 2007, Lusaka. [ Links ]
LUNDUKA RW, MATEVA KI, MAGOROKOSHO C and MANJERU P (2019) Impact of adoption of drought-tolerant maize varieties on total maize production in south eastern Zimbabwe. Climate and Development 11 (1) 35-46. https://doi.org/10.1080/17565529.2017.1372269 [ Links ]
MANSELL MG and HUSSEY SW (2005) An investigation of flows and losses within the alluvial sands of ephemeral rivers in Zimbabwe. J. Hydrol. 314 (1-4) 192-203. https://doi.org/10.1016/j.jhydrol.2005.03.015 [ Links ]
MOKWUNYE U (2010) Regional review of Africa's agricultural research and development. Background Paper for the Global Conference on Agricultural Research for Development (GCARD), 28-31 March 2010, Montpellier. Food and Agriculture Organization of the United Nations (FAO). [ Links ]
MOULAHOUM AW (2018) Numerical modelling tools to optimize a water abstraction system in the Shashane sand river aquifer (Zimbabwe). MSc thesis, IHE Delft University. [ Links ]
MPALA SC, GAGNON AS, MANSELL MG and HUSSEY SW (2016) The hydrology of sand rivers in Zimbabwe and the use of remote sensing to assess their level of saturation. Phys. Chem. Earth 93 24-36. https://doi.org/10.1016/j.pce.2016.03.004 [ Links ]
MPALA SC, GAGNON AS, MANSELL MG and HUSSEY SW (2020) Modelling the water level of the alluvial aquifer of an ephemeral river in south-western Zimbabwe. Hydrol. Sci. J. 65 (8) 1399-1415. https://doi.org/10.1080/02626667.2020.1750615 [ Links ]
MUTIRO J and LAUTZE J (2015) Irrigation in Southern Africa: Success or failure? Irrig. Drain. 64 (2) 180-192. https://doi.org/10.1002/ird.1892 [ Links ]
MVANDABA V, HUGHES D, KAPANGAZIWIRI E, MWENGE KAHINDA J, HOBBS P, MADONSELA S and OOSTHUIZEN N (2018) The delineation of alluvial aquifers towards a better understanding of channel transmission losses in the Limpopo River Basin. Phys. Chem. Earth A/B/C 108 60-73. https://doi.org/10.1016/j.pce.2018.06.004 [ Links ]
NCUBE B, MANZUNGU E, LOVE D, MAGOMBEYI M, GUMBO B and LUPANKWA K (2010) The challenge of integrated water resource management for improved rural livelihoods: Managing risk, mitigating drought and improving water productivity in the water scarce Limpopo Basin. CPWF Project Report. CGIAR Challenge Program on Water and Food. CGIAR, Colombo. [ Links ]
NISSEN-PETERSEN E (2006) Water from dry river beds. Royal Danish Embassy, Kenya. [ Links ]
OK E, ALEMAW B, TAFESSE N and KEAITSE E (2017) Estimating hydraulic properties of alluvial sand aquifer in Motloutse River course, eastern Botswana. Asian Rev. Environ. Earth Sci. 4 (1) 28-35. [ Links ]
SAVECA PSL, ABI A, STIGTER TY, LUKAS E and FOURIE F (2022) Assessing groundwater dynamics and hydrological processes in the Sand River deposits of the Limpopo River, Mozambique. Front. Water 3. https://doi.org/10.3389/frwa.2021.731642 [ Links ]
SVUBURE O, GUMBO T, SOROPA G and RUSERE F (2011) Evaluation of the sand abstraction systems for rural water supply: the case of Lupane District, Zimbabwe. Int. J. Eng. Sci. Technol. 3 (1) 757-765. [ Links ]
USDA NRCS (United States Department of Agriculture Natural Resources Conservation Service) (2017) Soil Survey Manual. Agriculture Handbook No. 18. Natural Resources Conservation Service, United States Department of Agriculture. [ Links ]
VUKOVIC M and SORO A (1992) Determination of Hydraulic Conductivity of Porous Media from Grain-Size Composition. Water Resources Publications, LLC Highlands Ranch, Colorado. [ Links ]
 Correspondence:
Tinashe Shumba
Email: c21144621j@student.cut.ac.zw
Received: 24 October 2023
Accepted: 3 April 2025